Byromville, GA Map & Demographics
Byromville Map
Byromville Overview
$25,300
PER CAPITA INCOME
$62,250
AVG FAMILY INCOME
$48,603
AVG HOUSEHOLD INCOME
3.9%
WAGE / INCOME GAP [ % ]
96.1¢/ $1
WAGE / INCOME GAP [ $ ]
$5,580
FAMILY INCOME DEFICIT
0.48
INEQUALITY / GINI INDEX
583
TOTAL POPULATION
268
MALE POPULATION
315
FEMALE POPULATION
85.08
MALES / 100 FEMALES
117.54
FEMALES / 100 MALES
42.3
MEDIAN AGE
3.5
AVG FAMILY SIZE
2.9
AVG HOUSEHOLD SIZE
230
LABOR FORCE [ PEOPLE ]
48.7%
PERCENT IN LABOR FORCE
0.4%
UNEMPLOYMENT RATE
Byromville Zip Codes
Byromville Area Codes
Income in Byromville
Income Overview in Byromville
Per Capita Income in Byromville is $25,300, while median incomes of families and households are $62,250 and $48,603 respectively.
| Characteristic | Number | Measure |
| Per Capita Income | 583 | $25,300 |
| Median Family Income | 127 | $62,250 |
| Mean Family Income | 127 | $79,720 |
| Median Household Income | 175 | $48,603 |
| Mean Household Income | 175 | $80,815 |
| Income Deficit | 127 | $5,580 |
| Wage / Income Gap (%) | 583 | 3.91% |
| Wage / Income Gap ($) | 583 | 96.09¢ per $1 |
| Gini / Inequality Index | 583 | 0.48 |
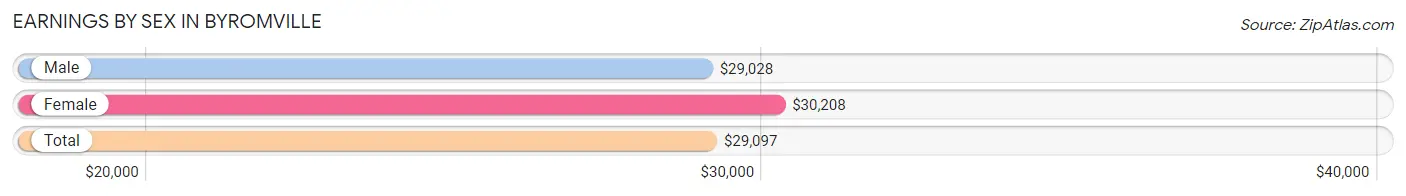
Earnings by Sex in Byromville
Average Earnings in Byromville are $29,097, $29,028 for men and $30,208 for women, a difference of 3.9%.
| Sex | Number | Average Earnings |
| Male | 120 (52.4%) | $29,028 |
| Female | 109 (47.6%) | $30,208 |
| Total | 229 (100.0%) | $29,097 |
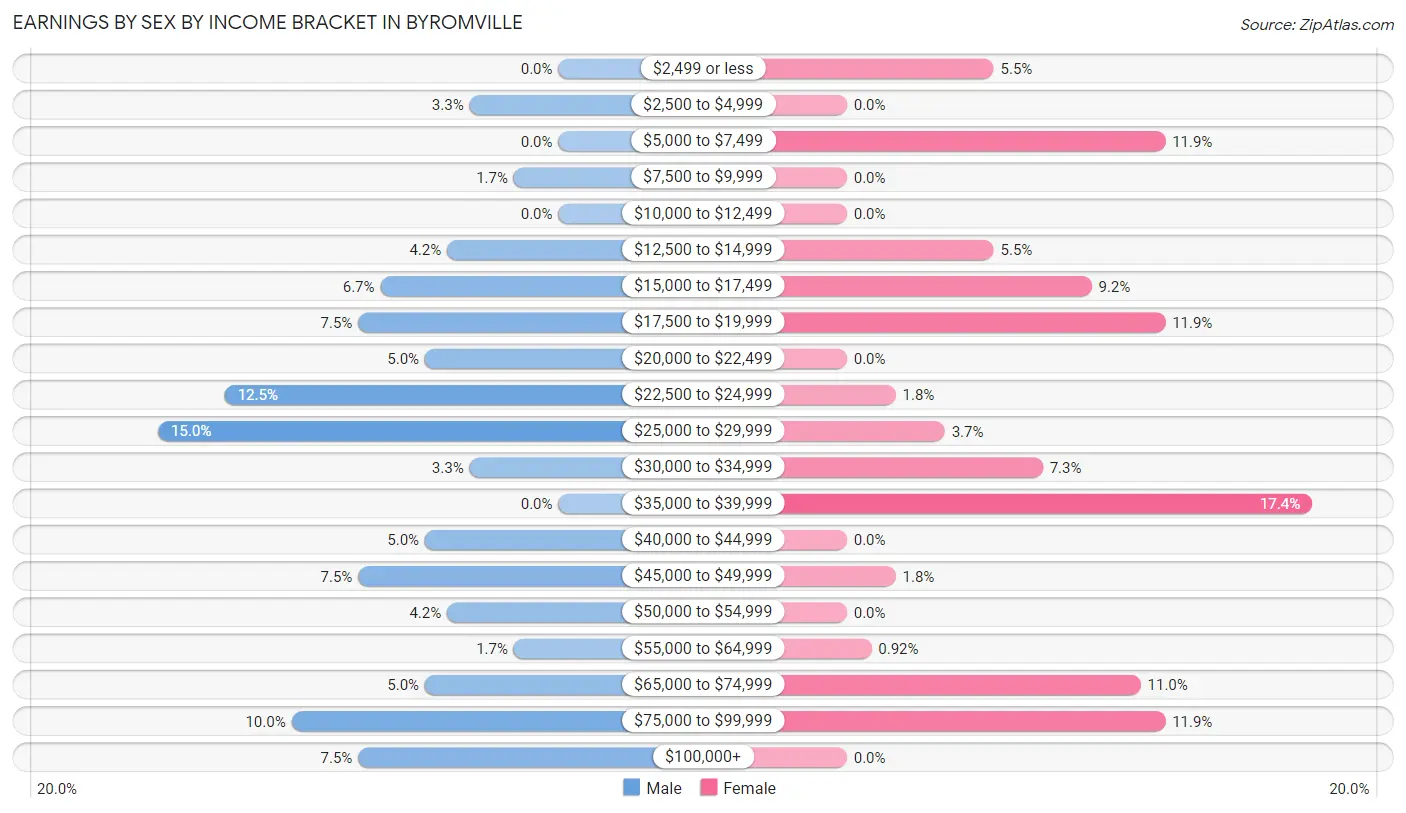
Earnings by Sex by Income Bracket in Byromville
The most common earnings brackets in Byromville are $25,000 to $29,999 for men (18 | 15.0%) and $35,000 to $39,999 for women (19 | 17.4%).
| Income | Male | Female |
| $2,499 or less | 0 (0.0%) | 6 (5.5%) |
| $2,500 to $4,999 | 4 (3.3%) | 0 (0.0%) |
| $5,000 to $7,499 | 0 (0.0%) | 13 (11.9%) |
| $7,500 to $9,999 | 2 (1.7%) | 0 (0.0%) |
| $10,000 to $12,499 | 0 (0.0%) | 0 (0.0%) |
| $12,500 to $14,999 | 5 (4.2%) | 6 (5.5%) |
| $15,000 to $17,499 | 8 (6.7%) | 10 (9.2%) |
| $17,500 to $19,999 | 9 (7.5%) | 13 (11.9%) |
| $20,000 to $22,499 | 6 (5.0%) | 0 (0.0%) |
| $22,500 to $24,999 | 15 (12.5%) | 2 (1.8%) |
| $25,000 to $29,999 | 18 (15.0%) | 4 (3.7%) |
| $30,000 to $34,999 | 4 (3.3%) | 8 (7.3%) |
| $35,000 to $39,999 | 0 (0.0%) | 19 (17.4%) |
| $40,000 to $44,999 | 6 (5.0%) | 0 (0.0%) |
| $45,000 to $49,999 | 9 (7.5%) | 2 (1.8%) |
| $50,000 to $54,999 | 5 (4.2%) | 0 (0.0%) |
| $55,000 to $64,999 | 2 (1.7%) | 1 (0.9%) |
| $65,000 to $74,999 | 6 (5.0%) | 12 (11.0%) |
| $75,000 to $99,999 | 12 (10.0%) | 13 (11.9%) |
| $100,000+ | 9 (7.5%) | 0 (0.0%) |
| Total | 120 (100.0%) | 109 (100.0%) |
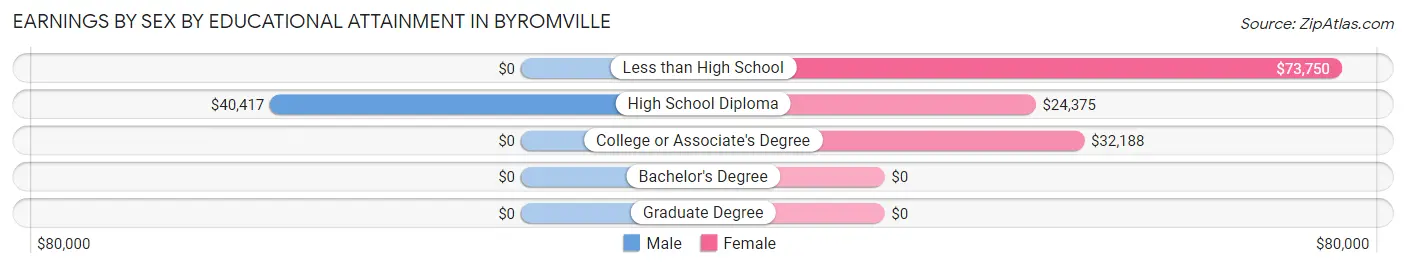
Earnings by Sex by Educational Attainment in Byromville
Average earnings in Byromville are $29,479 for men and $35,625 for women, a difference of 17.2%. Men with an educational attainment of high school diploma enjoy the highest average annual earnings of $40,417, while those with high school diploma education earn the least with $40,417. Women with an educational attainment of less than high school earn the most with the average annual earnings of $73,750, while those with high school diploma education have the smallest earnings of $24,375.
| Educational Attainment | Male Income | Female Income |
| Less than High School | - | - |
| High School Diploma | $40,417 | $24,375 |
| College or Associate's Degree | - | - |
| Bachelor's Degree | - | - |
| Graduate Degree | - | - |
| Total | $29,479 | $35,625 |
Family Income in Byromville
Family Income Brackets in Byromville
According to the Byromville family income data, there are 36 families falling into the $35,000 to $49,999 income range, which is the most common income bracket and makes up 28.3% of all families.
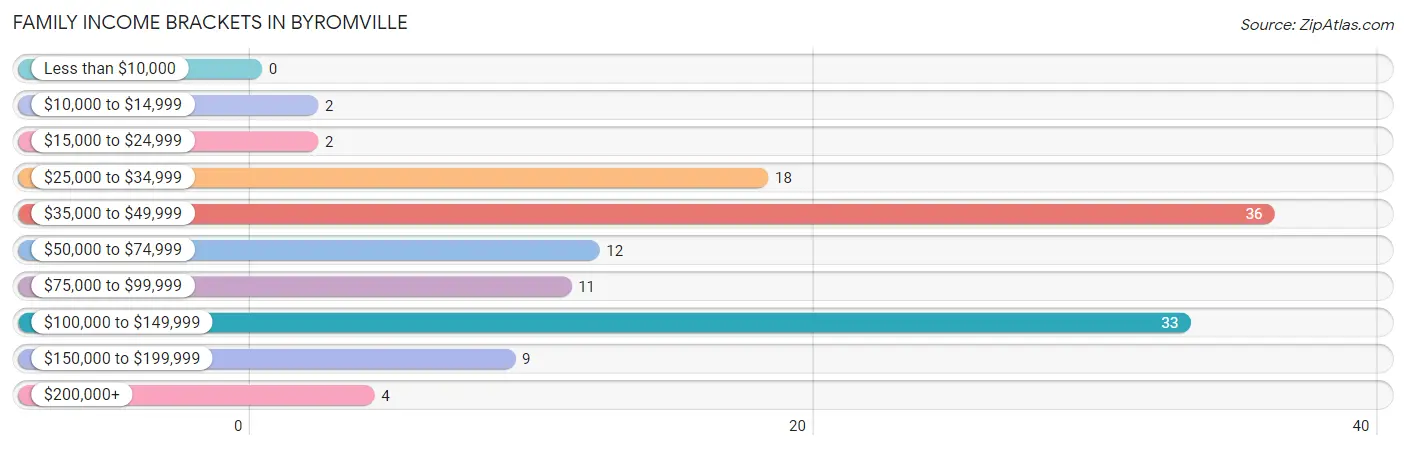
| Income Bracket | # Families | % Families |
| Less than $10,000 | 0 | 0.0% |
| $10,000 to $14,999 | 2 | 1.6% |
| $15,000 to $24,999 | 2 | 1.6% |
| $25,000 to $34,999 | 18 | 14.2% |
| $35,000 to $49,999 | 36 | 28.3% |
| $50,000 to $74,999 | 12 | 9.4% |
| $75,000 to $99,999 | 11 | 8.7% |
| $100,000 to $149,999 | 33 | 26.0% |
| $150,000 to $199,999 | 9 | 7.1% |
| $200,000+ | 4 | 3.1% |
Family Income by Famaliy Size in Byromville
3-person families (54 | 42.5%) account for the highest median family income in Byromville with $76,250 per family, while 3-person families (54 | 42.5%) have the highest median income of $25,417 per family member.
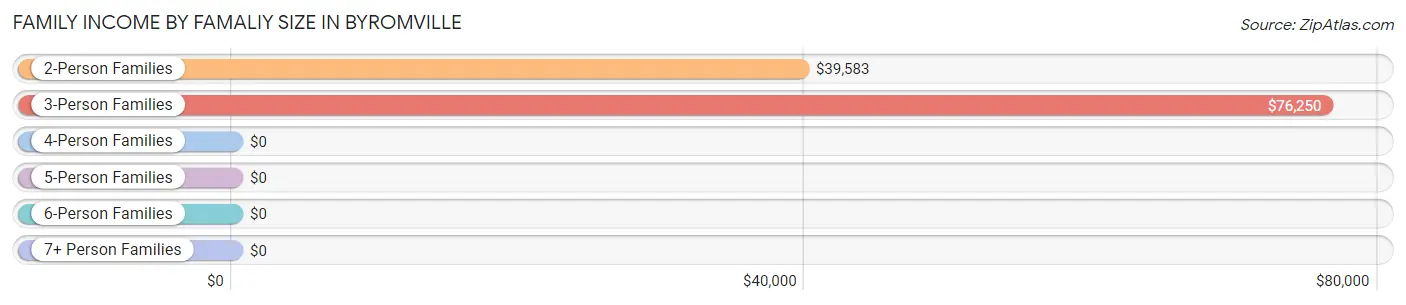
| Income Bracket | # Families | Median Income |
| 2-Person Families | 39 (30.7%) | $39,583 |
| 3-Person Families | 54 (42.5%) | $76,250 |
| 4-Person Families | 25 (19.7%) | $0 |
| 5-Person Families | 9 (7.1%) | $0 |
| 6-Person Families | 0 (0.0%) | $0 |
| 7+ Person Families | 0 (0.0%) | $0 |
| Total | 127 (100.0%) | $62,250 |
Family Income by Number of Earners in Byromville
The median family income in Byromville is $62,250, with families comprising 2 earners (46) having the highest median family income of $113,438, while families with 1 earner (44) have the lowest median family income of $41,875, accounting for 36.2% and 34.6% of families, respectively.
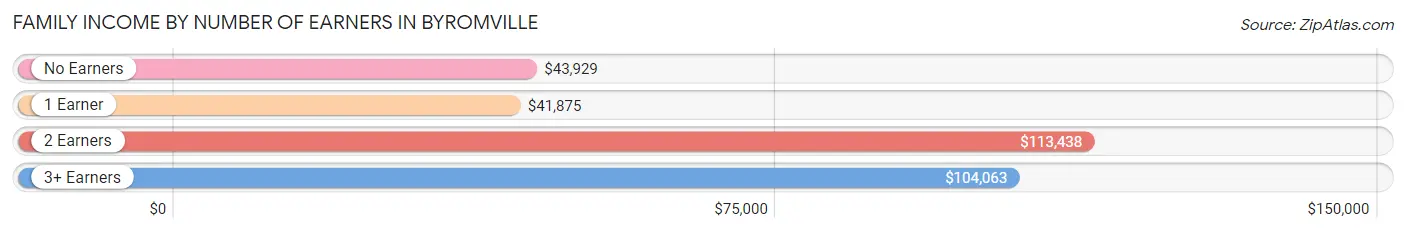
| Number of Earners | # Families | Median Income |
| No Earners | 22 (17.3%) | $43,929 |
| 1 Earner | 44 (34.6%) | $41,875 |
| 2 Earners | 46 (36.2%) | $113,438 |
| 3+ Earners | 15 (11.8%) | $104,063 |
| Total | 127 (100.0%) | $62,250 |
Household Income in Byromville
Household Income Brackets in Byromville
With 45 households falling in the category, the $35,000 to $49,999 income range is the most frequent in Byromville, accounting for 25.7% of all households. In contrast, only 7 households (4.0%) fall into the less than $10,000 income bracket, making it the least populous group.
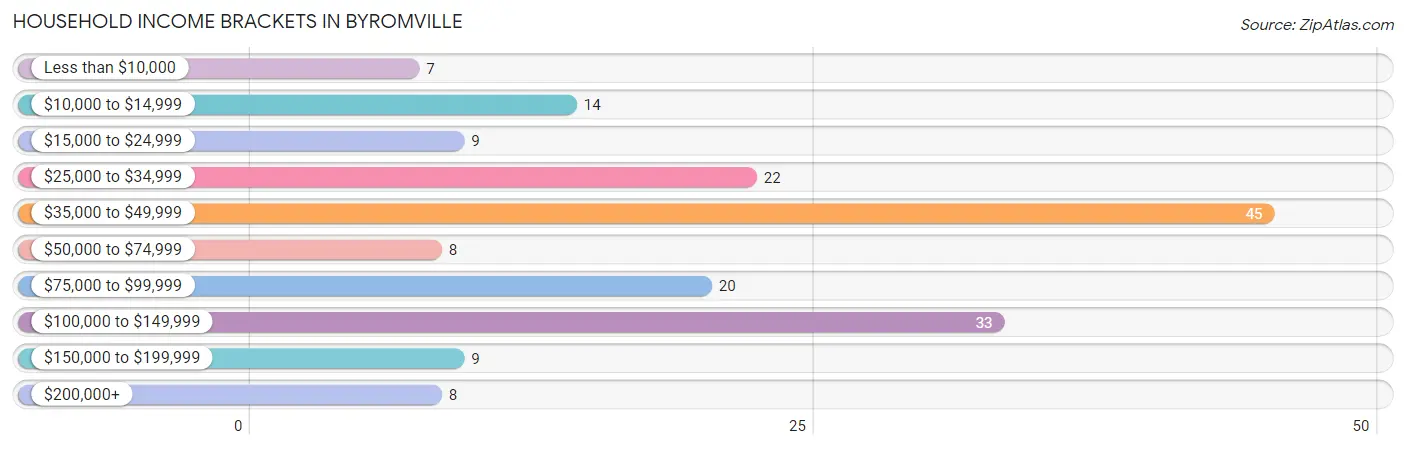
| Income Bracket | # Households | % Households |
| Less than $10,000 | 7 | 4.0% |
| $10,000 to $14,999 | 14 | 8.0% |
| $15,000 to $24,999 | 9 | 5.1% |
| $25,000 to $34,999 | 22 | 12.6% |
| $35,000 to $49,999 | 45 | 25.7% |
| $50,000 to $74,999 | 8 | 4.6% |
| $75,000 to $99,999 | 20 | 11.4% |
| $100,000 to $149,999 | 33 | 18.9% |
| $150,000 to $199,999 | 9 | 5.1% |
| $200,000+ | 8 | 4.6% |
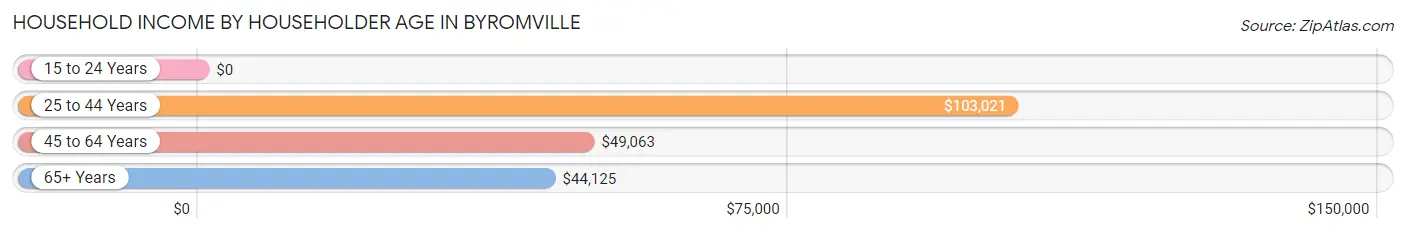
Household Income by Householder Age in Byromville
The median household income in Byromville is $48,603, with the highest median household income of $103,021 found in the 25 to 44 years age bracket for the primary householder. A total of 65 households (37.1%) fall into this category.
| Income Bracket | # Households | Median Income |
| 15 to 24 Years | 0 (0.0%) | $0 |
| 25 to 44 Years | 65 (37.1%) | $103,021 |
| 45 to 64 Years | 49 (28.0%) | $49,063 |
| 65+ Years | 61 (34.9%) | $44,125 |
| Total | 175 (100.0%) | $48,603 |
Poverty in Byromville
Income Below Poverty by Sex and Age in Byromville
With 8.6% poverty level for males and 9.8% for females among the residents of Byromville, 15 year old males and 25 to 34 year old females are the most vulnerable to poverty, with 1 males (33.3%) and 8 females (57.1%) in their respective age groups living below the poverty level.
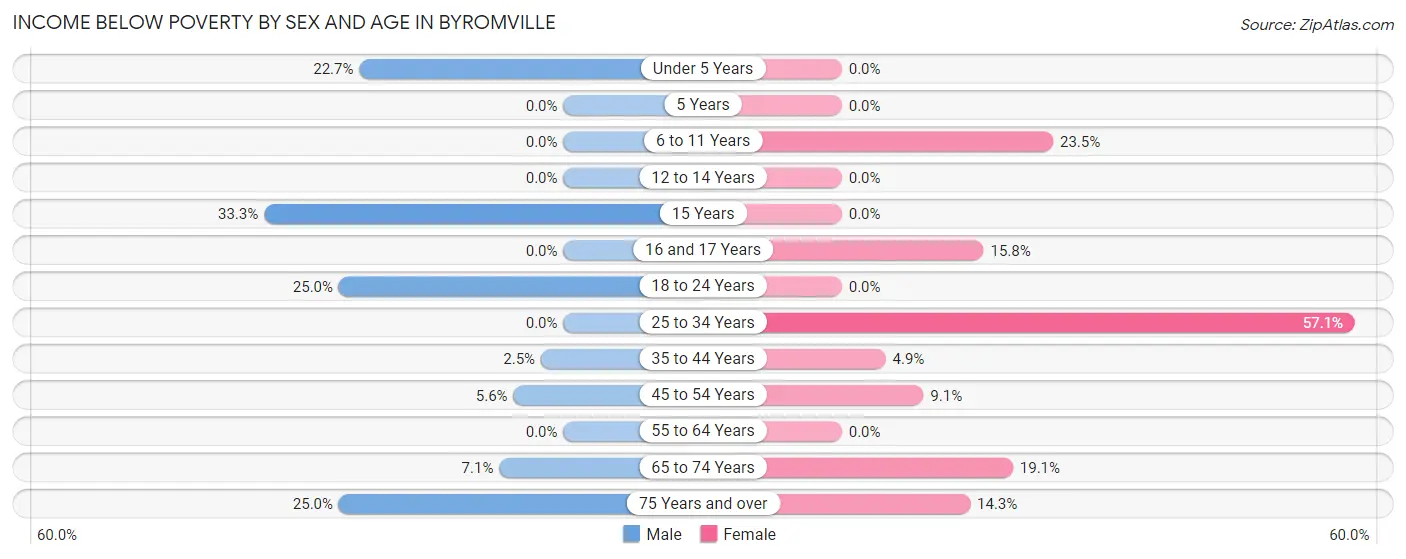
| Age Bracket | Male | Female |
| Under 5 Years | 5 (22.7%) | 0 (0.0%) |
| 5 Years | 0 (0.0%) | 0 (0.0%) |
| 6 to 11 Years | 0 (0.0%) | 4 (23.5%) |
| 12 to 14 Years | 0 (0.0%) | 0 (0.0%) |
| 15 Years | 1 (33.3%) | 0 (0.0%) |
| 16 and 17 Years | 0 (0.0%) | 3 (15.8%) |
| 18 to 24 Years | 5 (25.0%) | 0 (0.0%) |
| 25 to 34 Years | 0 (0.0%) | 8 (57.1%) |
| 35 to 44 Years | 1 (2.5%) | 2 (4.9%) |
| 45 to 54 Years | 1 (5.6%) | 2 (9.1%) |
| 55 to 64 Years | 0 (0.0%) | 0 (0.0%) |
| 65 to 74 Years | 1 (7.1%) | 4 (19.1%) |
| 75 Years and over | 5 (25.0%) | 5 (14.3%) |
| Total | 19 (8.6%) | 28 (9.8%) |
Income Above Poverty by Sex and Age in Byromville
According to the poverty statistics in Byromville, males aged 6 to 11 years and females aged under 5 years are the age groups that are most secure financially, with 100.0% of males and 100.0% of females in these age groups living above the poverty line.
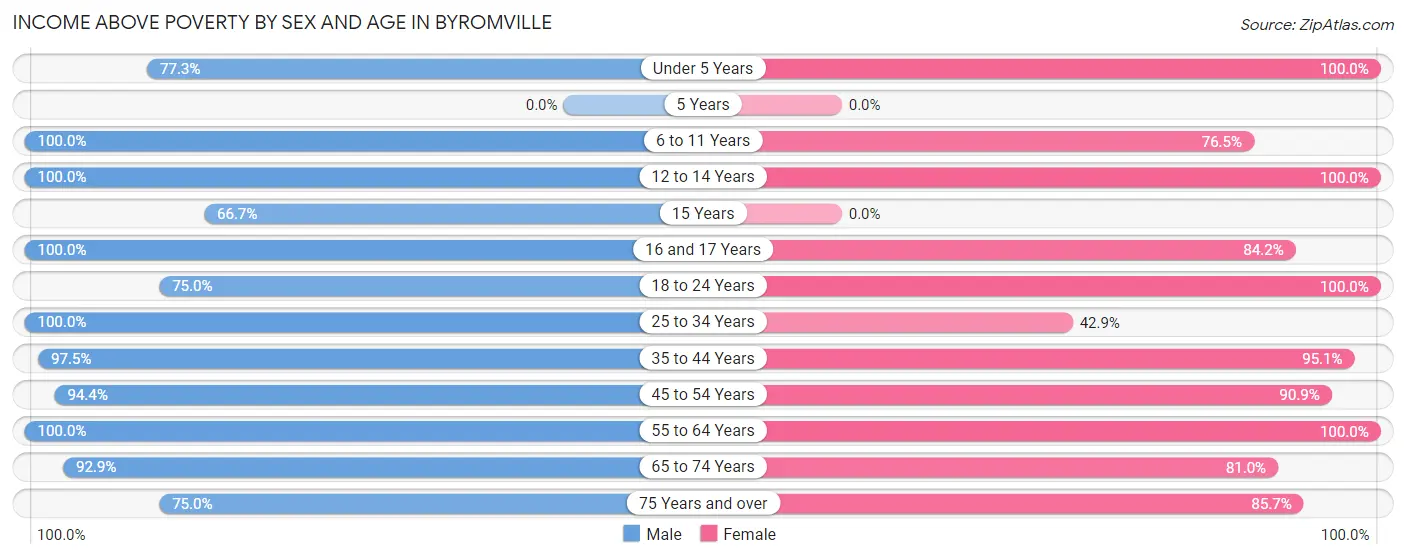
| Age Bracket | Male | Female |
| Under 5 Years | 17 (77.3%) | 16 (100.0%) |
| 5 Years | 0 (0.0%) | 0 (0.0%) |
| 6 to 11 Years | 15 (100.0%) | 13 (76.5%) |
| 12 to 14 Years | 4 (100.0%) | 34 (100.0%) |
| 15 Years | 2 (66.7%) | 0 (0.0%) |
| 16 and 17 Years | 4 (100.0%) | 16 (84.2%) |
| 18 to 24 Years | 15 (75.0%) | 30 (100.0%) |
| 25 to 34 Years | 36 (100.0%) | 6 (42.9%) |
| 35 to 44 Years | 39 (97.5%) | 39 (95.1%) |
| 45 to 54 Years | 17 (94.4%) | 20 (90.9%) |
| 55 to 64 Years | 26 (100.0%) | 36 (100.0%) |
| 65 to 74 Years | 13 (92.9%) | 17 (80.9%) |
| 75 Years and over | 15 (75.0%) | 30 (85.7%) |
| Total | 203 (91.4%) | 257 (90.2%) |
Income Below Poverty Among Married-Couple Families in Byromville
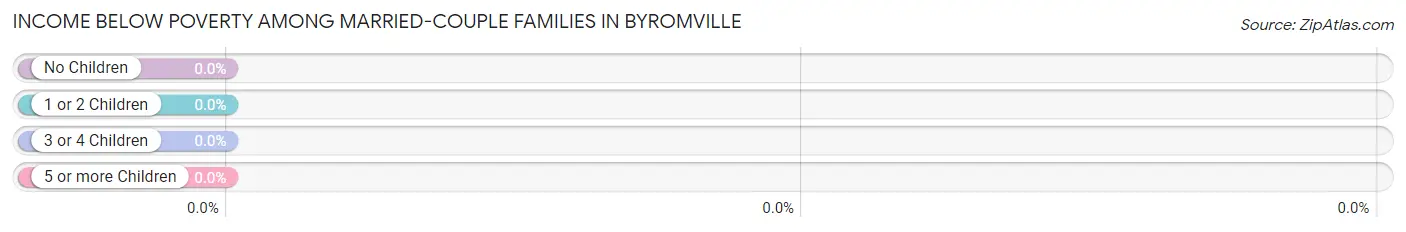
| Children | Above Poverty | Below Poverty |
| No Children | 39 (100.0%) | 0 (0.0%) |
| 1 or 2 Children | 36 (100.0%) | 0 (0.0%) |
| 3 or 4 Children | 8 (100.0%) | 0 (0.0%) |
| 5 or more Children | 0 (0.0%) | 0 (0.0%) |
| Total | 83 (100.0%) | 0 (0.0%) |
Income Below Poverty Among Single-Parent Households in Byromville
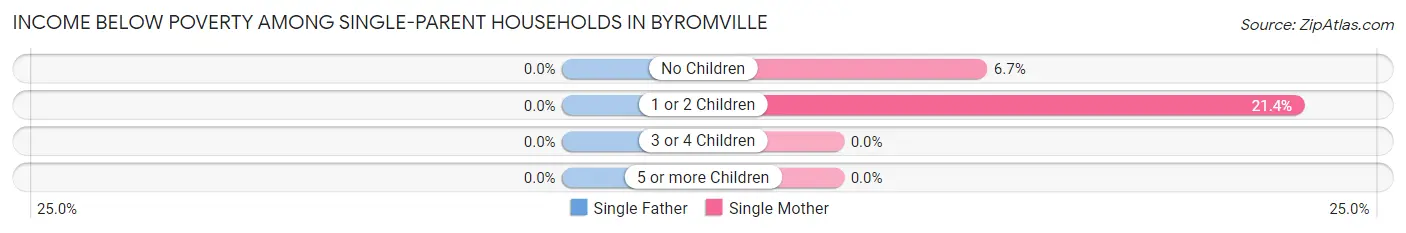
| Children | Single Father | Single Mother |
| No Children | 0 (0.0%) | 2 (6.7%) |
| 1 or 2 Children | 0 (0.0%) | 3 (21.4%) |
| 3 or 4 Children | 0 (0.0%) | 0 (0.0%) |
| 5 or more Children | 0 (0.0%) | 0 (0.0%) |
| Total | 0 (0.0%) | 5 (11.4%) |
Income Below Poverty Among Married-Couple vs Single-Parent Households in Byromville
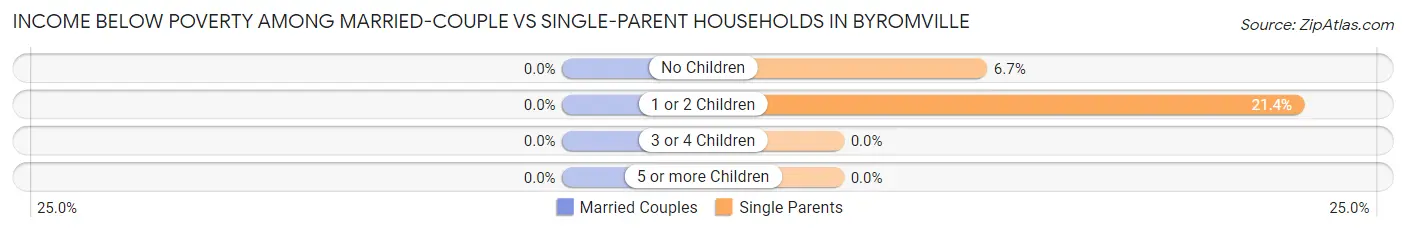
| Children | Married-Couple Families | Single-Parent Households |
| No Children | 0 (0.0%) | 2 (6.7%) |
| 1 or 2 Children | 0 (0.0%) | 3 (21.4%) |
| 3 or 4 Children | 0 (0.0%) | 0 (0.0%) |
| 5 or more Children | 0 (0.0%) | 0 (0.0%) |
| Total | 0 (0.0%) | 5 (11.4%) |
Race in Byromville
The most populous races in Byromville are White / Caucasian (285 | 48.9%), Black / African American (181 | 31.0%), and Hispanic or Latino (129 | 22.1%).
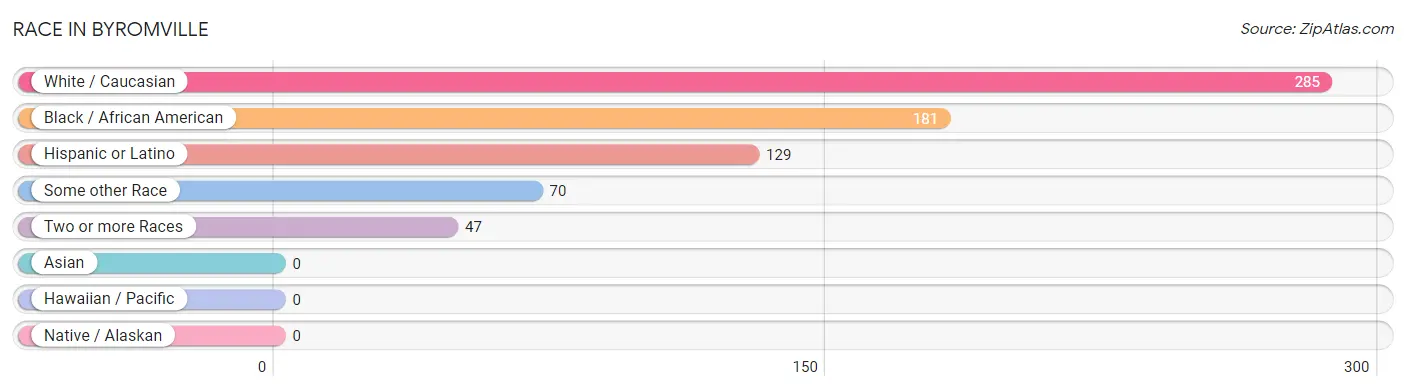
| Race | # Population | % Population |
| Asian | 0 | 0.0% |
| Black / African American | 181 | 31.0% |
| Hawaiian / Pacific | 0 | 0.0% |
| Hispanic or Latino | 129 | 22.1% |
| Native / Alaskan | 0 | 0.0% |
| White / Caucasian | 285 | 48.9% |
| Two or more Races | 47 | 8.1% |
| Some other Race | 70 | 12.0% |
| Total | 583 | 100.0% |
Ancestry in Byromville
The most populous ancestries reported in Byromville are Mexican (129 | 22.1%), American (49 | 8.4%), English (29 | 5.0%), Irish (24 | 4.1%), and Cherokee (21 | 3.6%), together accounting for 43.2% of all Byromville residents.
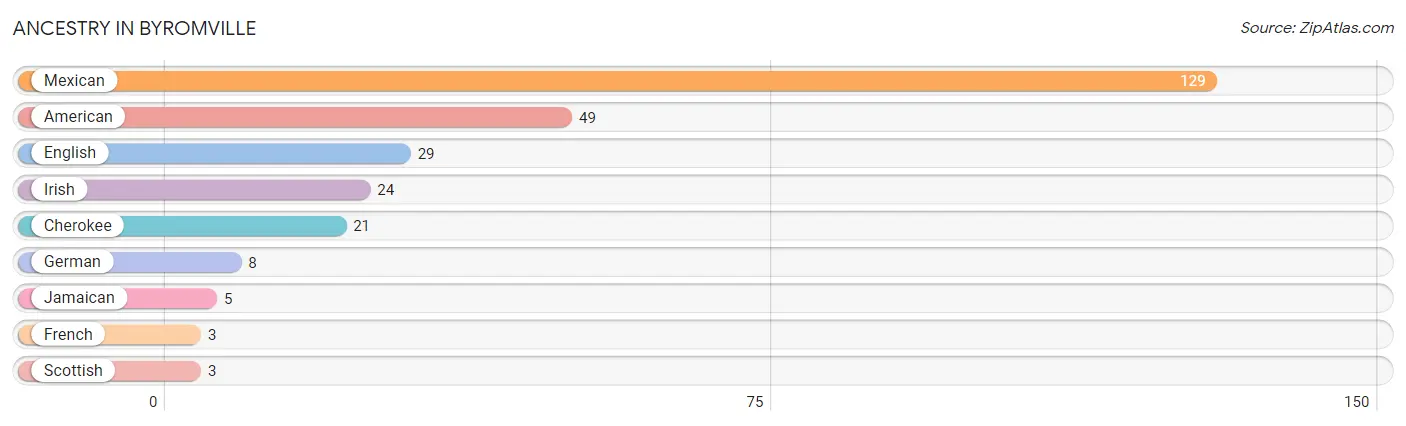
| Ancestry | # Population | % Population |
| American | 49 | 8.4% |
| Cherokee | 21 | 3.6% |
| English | 29 | 5.0% |
| French | 3 | 0.5% |
| German | 8 | 1.4% |
| Irish | 24 | 4.1% |
| Jamaican | 5 | 0.9% |
| Mexican | 129 | 22.1% |
| Scottish | 3 | 0.5% | View All 9 Rows |
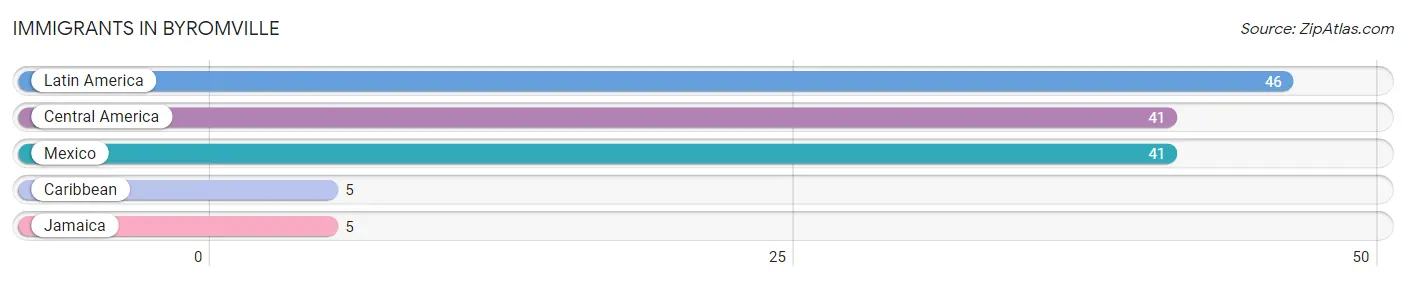
Immigrants in Byromville
The most numerous immigrant groups reported in Byromville came from Latin America (46 | 7.9%), Central America (41 | 7.0%), Mexico (41 | 7.0%), Caribbean (5 | 0.9%), and Jamaica (5 | 0.9%), together accounting for 23.7% of all Byromville residents.
| Immigration Origin | # Population | % Population |
| Caribbean | 5 | 0.9% |
| Central America | 41 | 7.0% |
| Jamaica | 5 | 0.9% |
| Latin America | 46 | 7.9% |
| Mexico | 41 | 7.0% | View All 5 Rows |
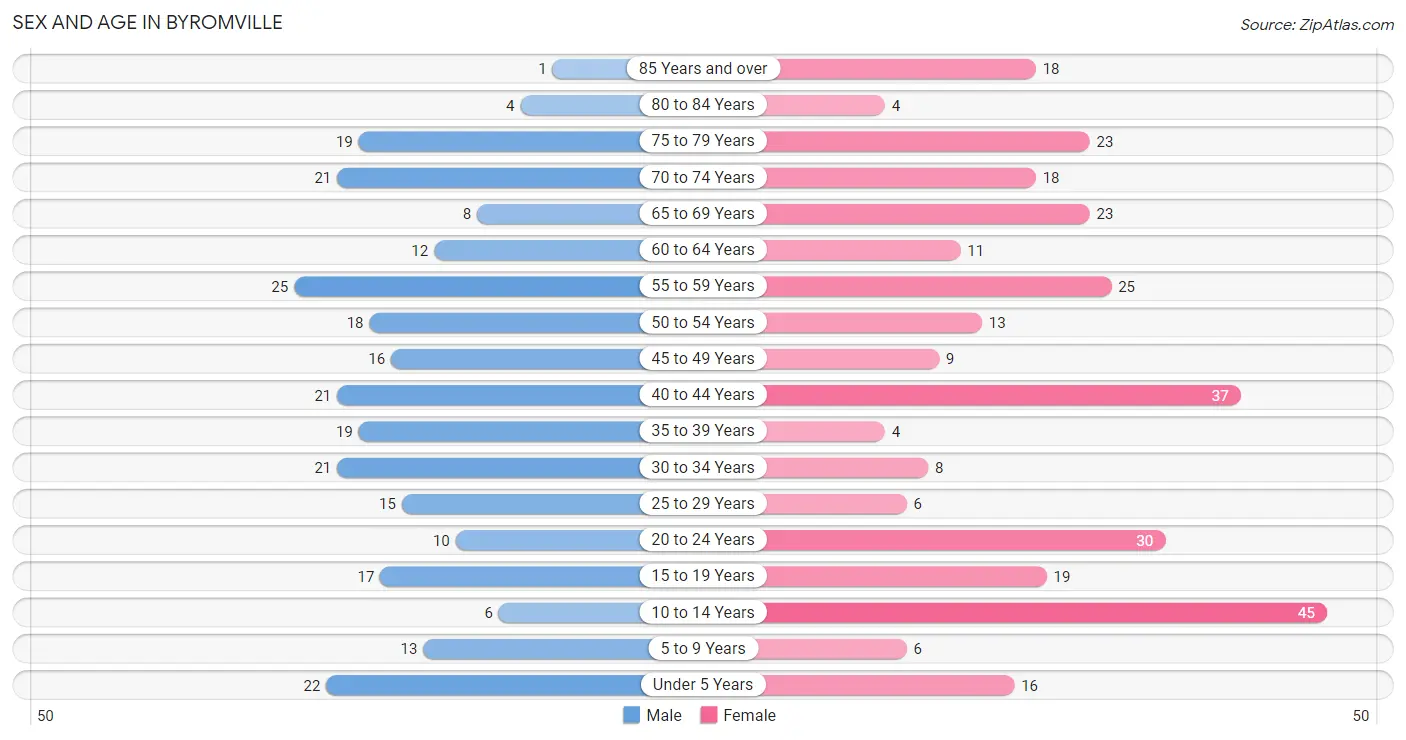
Sex and Age in Byromville
Sex and Age in Byromville
The most populous age groups in Byromville are 55 to 59 Years (25 | 9.3%) for men and 10 to 14 Years (45 | 14.3%) for women.
| Age Bracket | Male | Female |
| Under 5 Years | 22 (8.2%) | 16 (5.1%) |
| 5 to 9 Years | 13 (4.9%) | 6 (1.9%) |
| 10 to 14 Years | 6 (2.2%) | 45 (14.3%) |
| 15 to 19 Years | 17 (6.3%) | 19 (6.0%) |
| 20 to 24 Years | 10 (3.7%) | 30 (9.5%) |
| 25 to 29 Years | 15 (5.6%) | 6 (1.9%) |
| 30 to 34 Years | 21 (7.8%) | 8 (2.5%) |
| 35 to 39 Years | 19 (7.1%) | 4 (1.3%) |
| 40 to 44 Years | 21 (7.8%) | 37 (11.7%) |
| 45 to 49 Years | 16 (6.0%) | 9 (2.9%) |
| 50 to 54 Years | 18 (6.7%) | 13 (4.1%) |
| 55 to 59 Years | 25 (9.3%) | 25 (7.9%) |
| 60 to 64 Years | 12 (4.5%) | 11 (3.5%) |
| 65 to 69 Years | 8 (3.0%) | 23 (7.3%) |
| 70 to 74 Years | 21 (7.8%) | 18 (5.7%) |
| 75 to 79 Years | 19 (7.1%) | 23 (7.3%) |
| 80 to 84 Years | 4 (1.5%) | 4 (1.3%) |
| 85 Years and over | 1 (0.4%) | 18 (5.7%) |
| Total | 268 (100.0%) | 315 (100.0%) |
Families and Households in Byromville
Median Family Size in Byromville
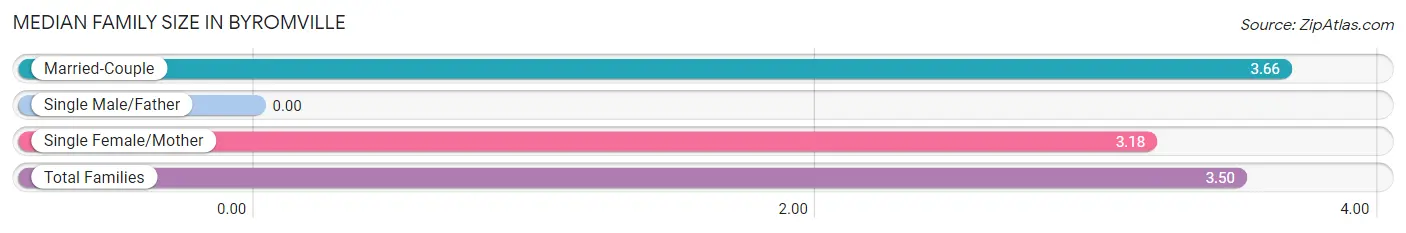
| Family Type | # Families | Family Size |
| Married-Couple | 83 (65.3%) | 3.66 |
| Single Male/Father | 0 (0.0%) | - |
| Single Female/Mother | 44 (34.6%) | 3.18 |
| Total Families | 127 (100.0%) | 3.50 |
Median Household Size in Byromville
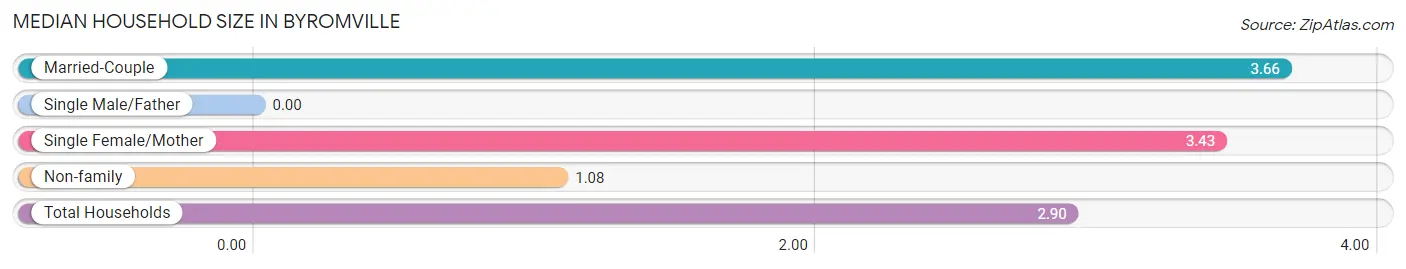
| Household Type | # Households | Household Size |
| Married-Couple | 83 (47.4%) | 3.66 |
| Single Male/Father | 0 (0.0%) | - |
| Single Female/Mother | 44 (25.1%) | 3.43 |
| Non-family | 48 (27.4%) | 1.08 |
| Total Households | 175 (100.0%) | 2.90 |
Household Size by Marriage Status in Byromville
Out of a total of 175 households in Byromville, 127 (72.6%) are family households, while 48 (27.4%) are nonfamily households. The most numerous type of family households are 3-person households, comprising 59, and the most common type of nonfamily households are 1-person households, comprising 45.
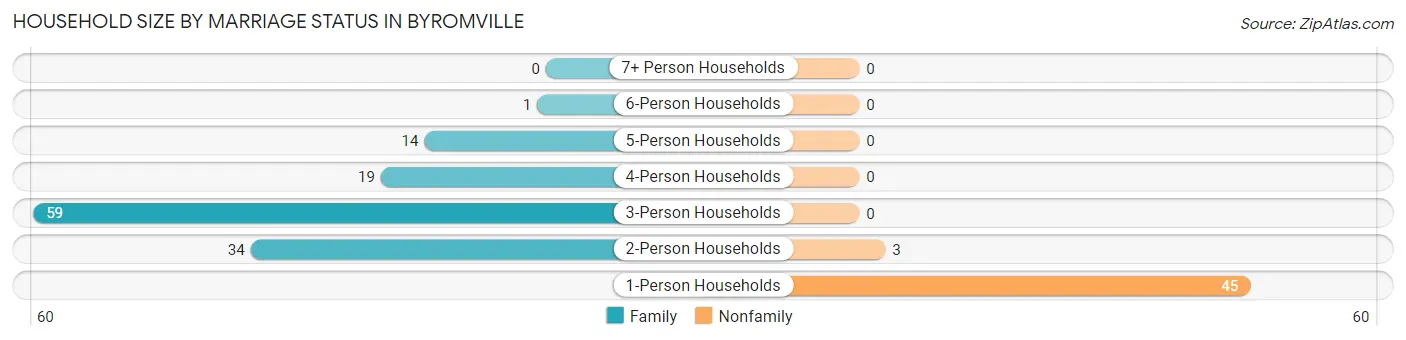
| Household Size | Family Households | Nonfamily Households |
| 1-Person Households | - | 45 (25.7%) |
| 2-Person Households | 34 (19.4%) | 3 (1.7%) |
| 3-Person Households | 59 (33.7%) | 0 (0.0%) |
| 4-Person Households | 19 (10.9%) | 0 (0.0%) |
| 5-Person Households | 14 (8.0%) | 0 (0.0%) |
| 6-Person Households | 1 (0.6%) | 0 (0.0%) |
| 7+ Person Households | 0 (0.0%) | 0 (0.0%) |
| Total | 127 (72.6%) | 48 (27.4%) |
Female Fertility in Byromville
Fertility by Age in Byromville
Average fertility rate in Byromville is 35.0 births per 1,000 women. Women in the age bracket of 20 to 34 years have the highest fertility rate with 91.0 births per 1,000 women. Women in the age bracket of 20 to 34 years acount for 100.0% of all women with births.
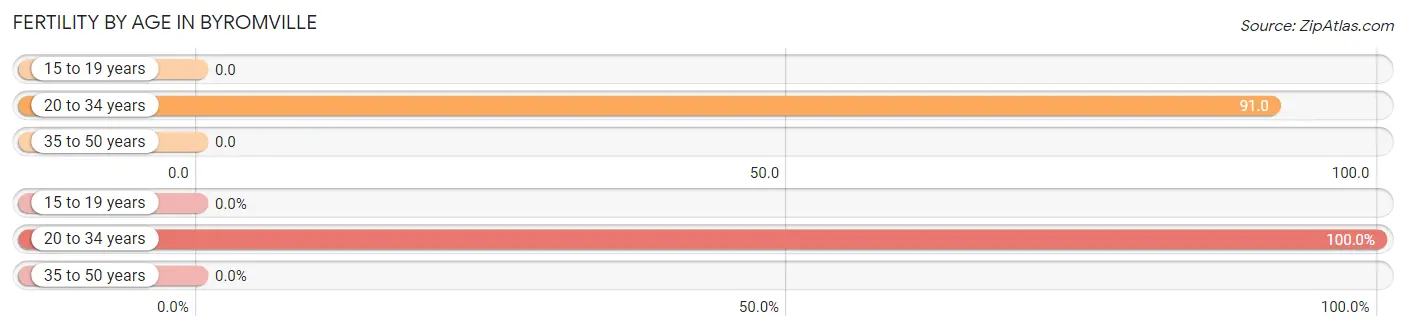
| Age Bracket | Women with Births | Births / 1,000 Women |
| 15 to 19 years | 0 (0.0%) | 0.0 |
| 20 to 34 years | 4 (100.0%) | 91.0 |
| 35 to 50 years | 0 (0.0%) | 0.0 |
| Total | 4 (100.0%) | 35.0 |
Fertility by Age by Marriage Status in Byromville
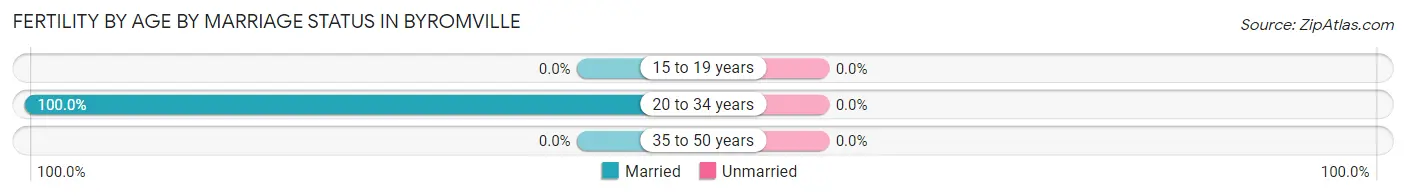
| Age Bracket | Married | Unmarried |
| 15 to 19 years | 0 (0.0%) | 0 (0.0%) |
| 20 to 34 years | 4 (100.0%) | 0 (0.0%) |
| 35 to 50 years | 0 (0.0%) | 0 (0.0%) |
| Total | 4 (100.0%) | 0 (0.0%) |
Fertility by Education in Byromville
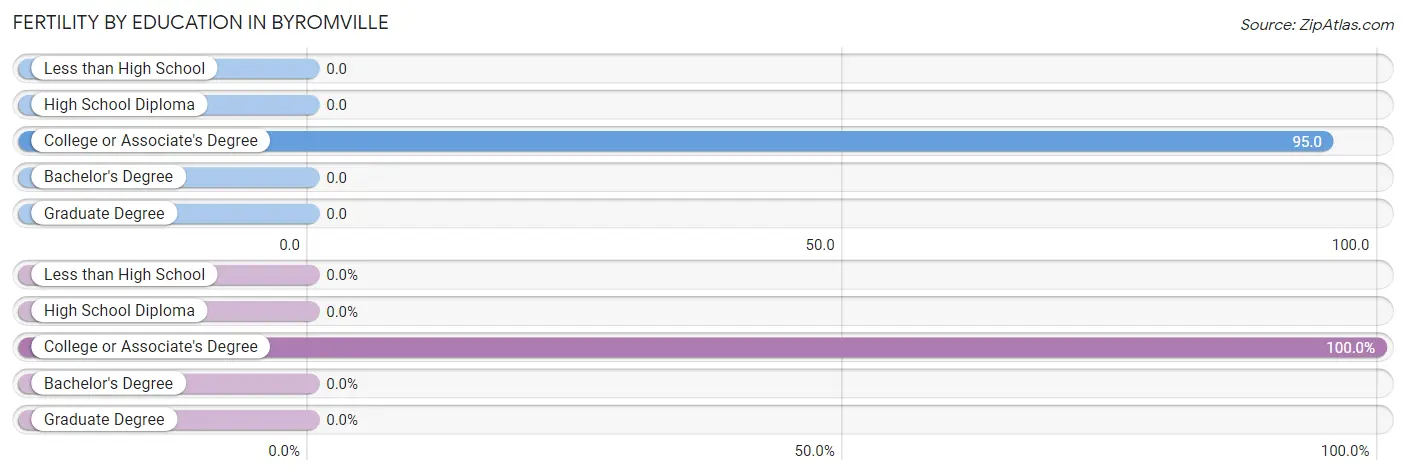
| Educational Attainment | Women with Births | Births / 1,000 Women |
| Less than High School | 0 (0.0%) | 0.0 |
| High School Diploma | 0 (0.0%) | 0.0 |
| College or Associate's Degree | 4 (100.0%) | 95.0 |
| Bachelor's Degree | 0 (0.0%) | 0.0 |
| Graduate Degree | 0 (0.0%) | 0.0 |
| Total | 4 (100.0%) | 35.0 |
Fertility by Education by Marriage Status in Byromville
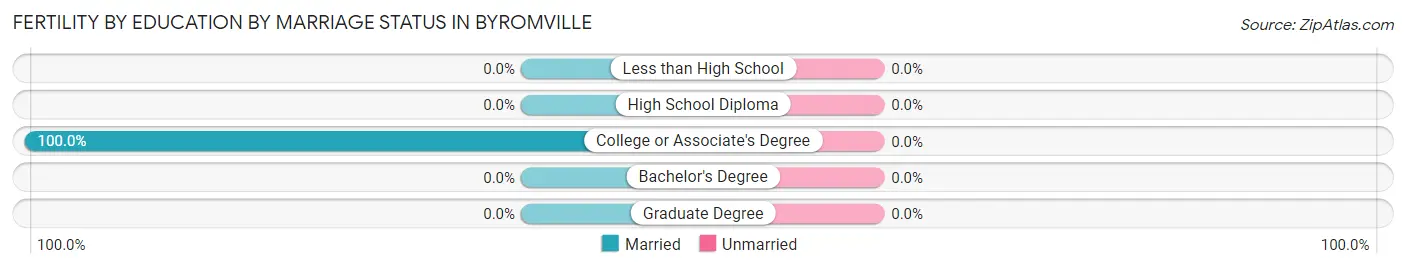
| Educational Attainment | Married | Unmarried |
| Less than High School | 0 (0.0%) | 0 (0.0%) |
| High School Diploma | 0 (0.0%) | 0 (0.0%) |
| College or Associate's Degree | 4 (100.0%) | 0 (0.0%) |
| Bachelor's Degree | 0 (0.0%) | 0 (0.0%) |
| Graduate Degree | 0 (0.0%) | 0 (0.0%) |
| Total | 4 (100.0%) | 0 (0.0%) |
Employment Characteristics in Byromville
Employment by Class of Employer in Byromville
Among the 225 employed individuals in Byromville, private company employees (187 | 83.1%), state government employees (13 | 5.8%), and not-for-profit organizations (9 | 4.0%) make up the most common classes of employment.
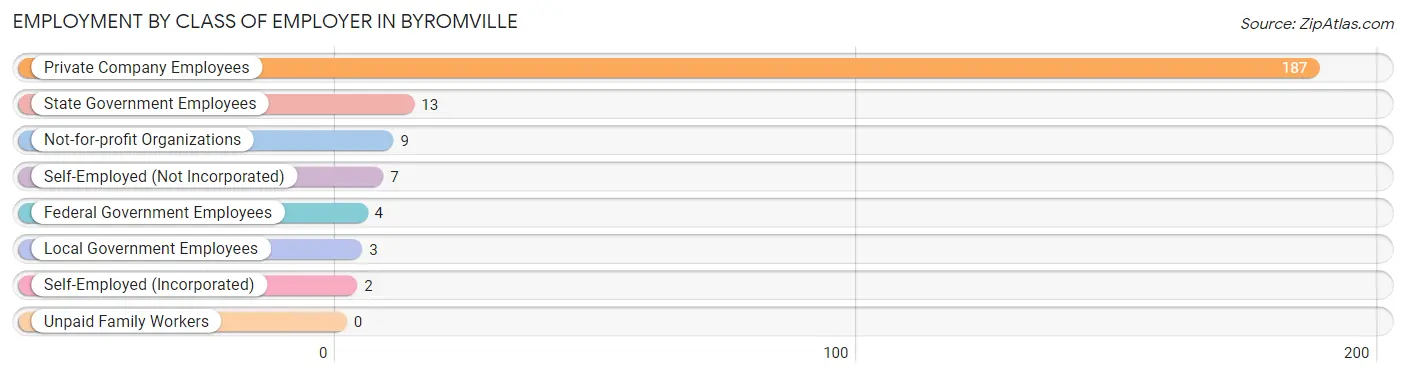
| Employer Class | # Employees | % Employees |
| Private Company Employees | 187 | 83.1% |
| Self-Employed (Incorporated) | 2 | 0.9% |
| Self-Employed (Not Incorporated) | 7 | 3.1% |
| Not-for-profit Organizations | 9 | 4.0% |
| Local Government Employees | 3 | 1.3% |
| State Government Employees | 13 | 5.8% |
| Federal Government Employees | 4 | 1.8% |
| Unpaid Family Workers | 0 | 0.0% |
| Total | 225 | 100.0% |
Employment Status by Age in Byromville
According to the labor force statistics for Byromville, out of the total population over 16 years of age (472), 48.7% or 230 individuals are in the labor force, with 0.4% or 1 of them unemployed. The age group with the highest labor force participation rate is 25 to 29 years, with 100.0% or 21 individuals in the labor force. Within the labor force, the 35 to 44 years age range has the highest percentage of unemployed individuals, with 1.5% or 1 of them being unemployed.
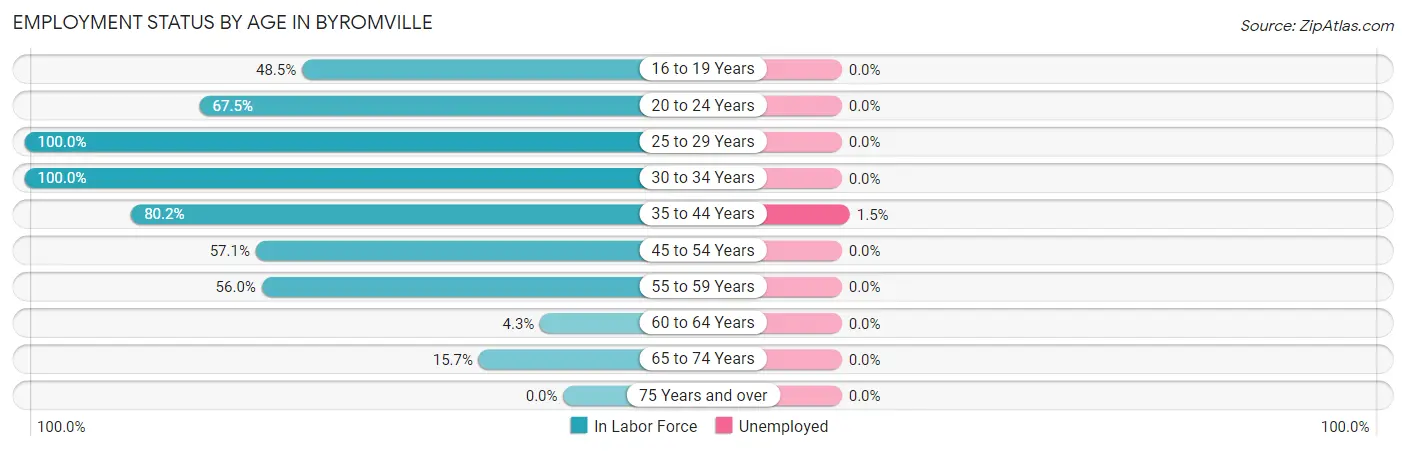
| Age Bracket | In Labor Force | Unemployed |
| 16 to 19 Years | 16 (48.5%) | 0 (0.0%) |
| 20 to 24 Years | 27 (67.5%) | 0 (0.0%) |
| 25 to 29 Years | 21 (100.0%) | 0 (0.0%) |
| 30 to 34 Years | 29 (100.0%) | 0 (0.0%) |
| 35 to 44 Years | 65 (80.2%) | 1 (1.5%) |
| 45 to 54 Years | 32 (57.1%) | 0 (0.0%) |
| 55 to 59 Years | 28 (56.0%) | 0 (0.0%) |
| 60 to 64 Years | 1 (4.3%) | 0 (0.0%) |
| 65 to 74 Years | 11 (15.7%) | 0 (0.0%) |
| 75 Years and over | 0 (0.0%) | 0 (0.0%) |
| Total | 230 (48.7%) | 1 (0.4%) |
Employment Status by Educational Attainment in Byromville
According to labor force statistics for Byromville, 67.7% of individuals (176) out of the total population between 25 and 64 years of age (260) are in the labor force, with 0.6% or 1 of them being unemployed. The group with the highest labor force participation rate are those with the educational attainment of less than high school, with 80.3% or 57 individuals in the labor force. Within the labor force, individuals with high school diploma education have the highest percentage of unemployment, with 1.4% or 1 of them being unemployed.
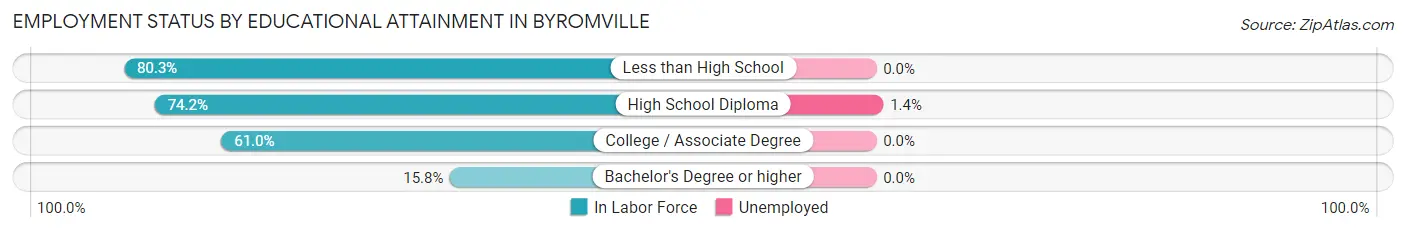
| Educational Attainment | In Labor Force | Unemployed |
| Less than High School | 57 (80.3%) | 0 (0.0%) |
| High School Diploma | 69 (74.2%) | 1 (1.4%) |
| College / Associate Degree | 47 (61.0%) | 0 (0.0%) |
| Bachelor's Degree or higher | 3 (15.8%) | 0 (0.0%) |
| Total | 176 (67.7%) | 2 (0.6%) |
Employment Occupations by Sex in Byromville
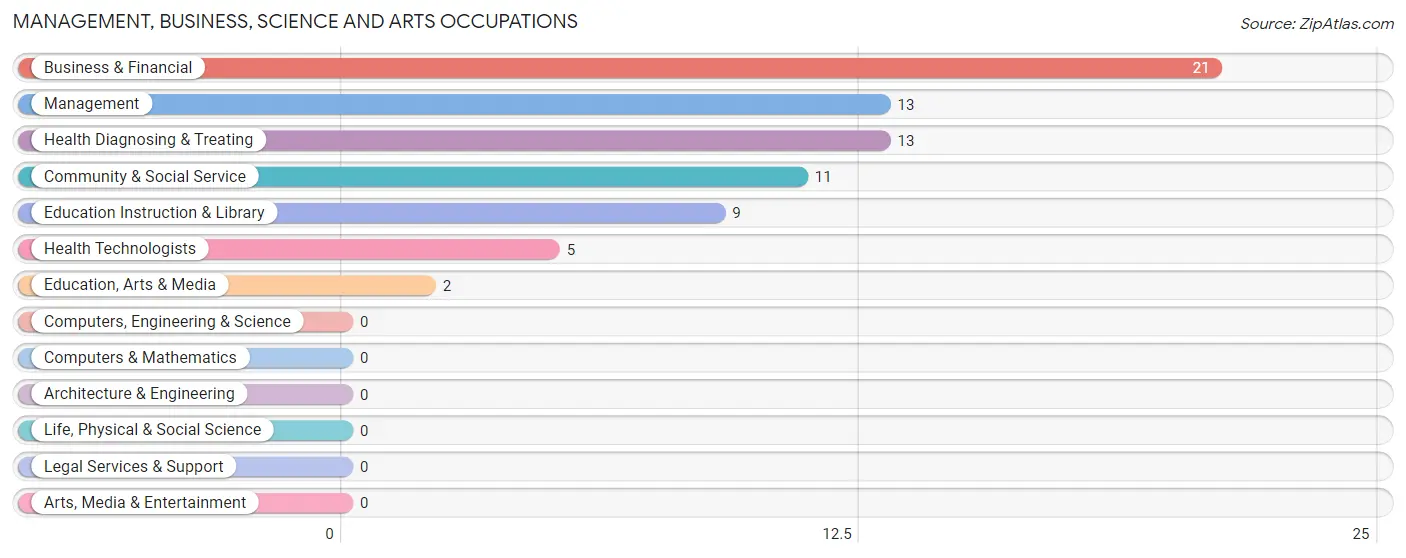
Management, Business, Science and Arts Occupations
The most common Management, Business, Science and Arts occupations in Byromville are Business & Financial (21 | 9.2%), Management (13 | 5.7%), Health Diagnosing & Treating (13 | 5.7%), Community & Social Service (11 | 4.8%), and Education Instruction & Library (9 | 3.9%).
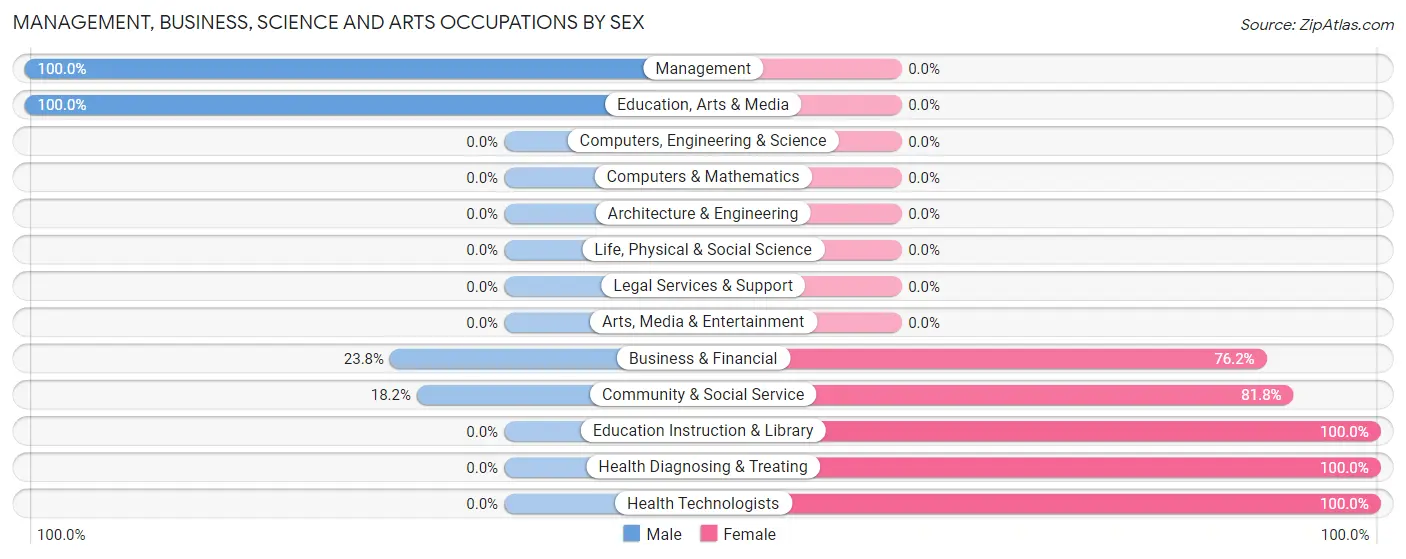
Management, Business, Science and Arts Occupations by Sex
Within the Management, Business, Science and Arts occupations in Byromville, the most male-oriented occupations are Management (100.0%), Education, Arts & Media (100.0%), and Business & Financial (23.8%), while the most female-oriented occupations are Education Instruction & Library (100.0%), Health Diagnosing & Treating (100.0%), and Health Technologists (100.0%).
| Occupation | Male | Female |
| Management | 13 (100.0%) | 0 (0.0%) |
| Business & Financial | 5 (23.8%) | 16 (76.2%) |
| Computers, Engineering & Science | 0 (0.0%) | 0 (0.0%) |
| Computers & Mathematics | 0 (0.0%) | 0 (0.0%) |
| Architecture & Engineering | 0 (0.0%) | 0 (0.0%) |
| Life, Physical & Social Science | 0 (0.0%) | 0 (0.0%) |
| Community & Social Service | 2 (18.2%) | 9 (81.8%) |
| Education, Arts & Media | 2 (100.0%) | 0 (0.0%) |
| Legal Services & Support | 0 (0.0%) | 0 (0.0%) |
| Education Instruction & Library | 0 (0.0%) | 9 (100.0%) |
| Arts, Media & Entertainment | 0 (0.0%) | 0 (0.0%) |
| Health Diagnosing & Treating | 0 (0.0%) | 13 (100.0%) |
| Health Technologists | 0 (0.0%) | 5 (100.0%) |
| Total (Category) | 20 (34.5%) | 38 (65.5%) |
| Total (Overall) | 120 (52.4%) | 109 (47.6%) |
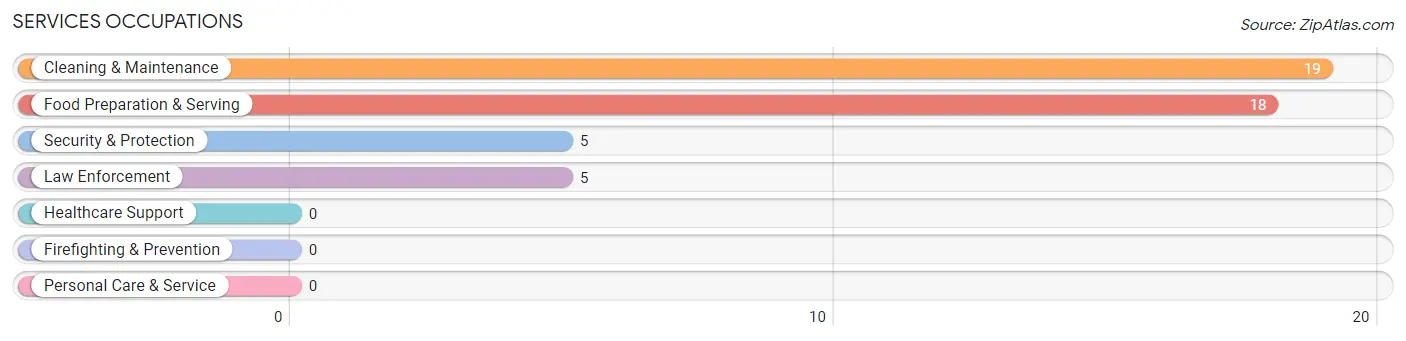
Services Occupations
The most common Services occupations in Byromville are Cleaning & Maintenance (19 | 8.3%), Food Preparation & Serving (18 | 7.9%), Security & Protection (5 | 2.2%), and Law Enforcement (5 | 2.2%).
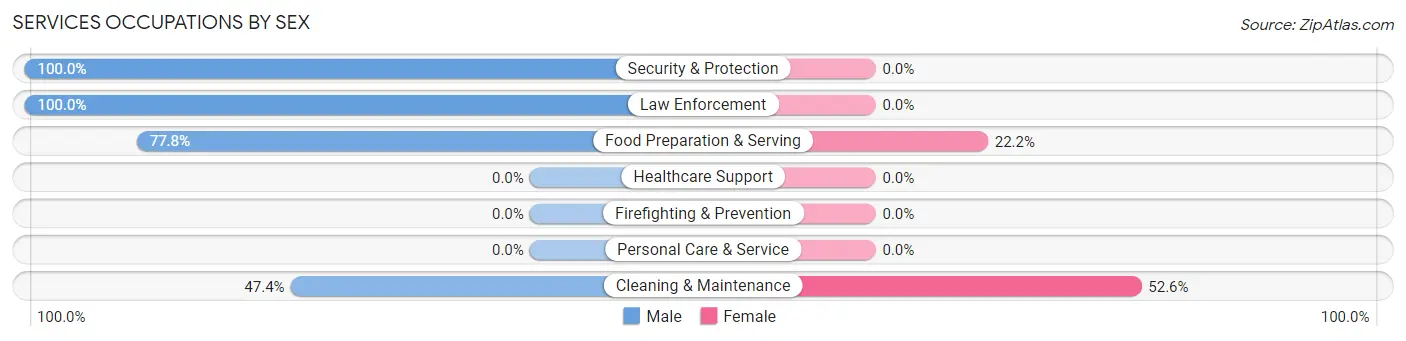
Services Occupations by Sex
Within the Services occupations in Byromville, the most male-oriented occupations are Security & Protection (100.0%), Law Enforcement (100.0%), and Food Preparation & Serving (77.8%), while the most female-oriented occupations are Cleaning & Maintenance (52.6%), and Food Preparation & Serving (22.2%).
| Occupation | Male | Female |
| Healthcare Support | 0 (0.0%) | 0 (0.0%) |
| Security & Protection | 5 (100.0%) | 0 (0.0%) |
| Firefighting & Prevention | 0 (0.0%) | 0 (0.0%) |
| Law Enforcement | 5 (100.0%) | 0 (0.0%) |
| Food Preparation & Serving | 14 (77.8%) | 4 (22.2%) |
| Cleaning & Maintenance | 9 (47.4%) | 10 (52.6%) |
| Personal Care & Service | 0 (0.0%) | 0 (0.0%) |
| Total (Category) | 28 (66.7%) | 14 (33.3%) |
| Total (Overall) | 120 (52.4%) | 109 (47.6%) |
Sales and Office Occupations
The most common Sales and Office occupations in Byromville are Office & Administration (14 | 6.1%), and Sales & Related (6 | 2.6%).
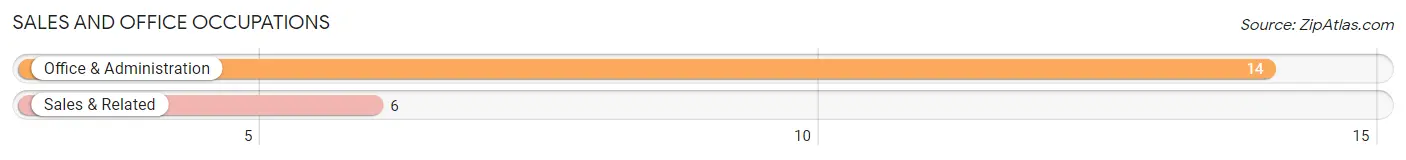
Sales and Office Occupations by Sex
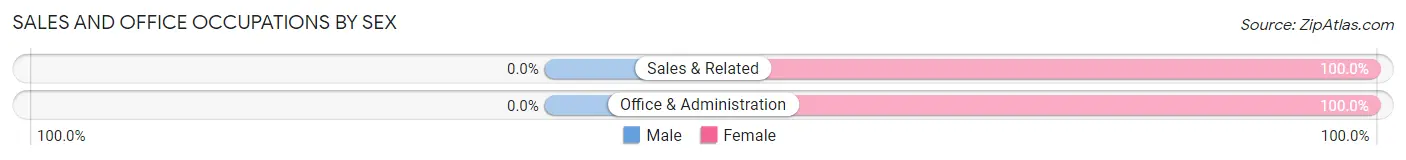
| Occupation | Male | Female |
| Sales & Related | 0 (0.0%) | 6 (100.0%) |
| Office & Administration | 0 (0.0%) | 14 (100.0%) |
| Total (Category) | 0 (0.0%) | 20 (100.0%) |
| Total (Overall) | 120 (52.4%) | 109 (47.6%) |
Natural Resources, Construction and Maintenance Occupations
The most common Natural Resources, Construction and Maintenance occupations in Byromville are Construction & Extraction (15 | 6.6%), Installation, Maintenance & Repair (15 | 6.6%), and Farming, Fishing & Forestry (1 | 0.4%).
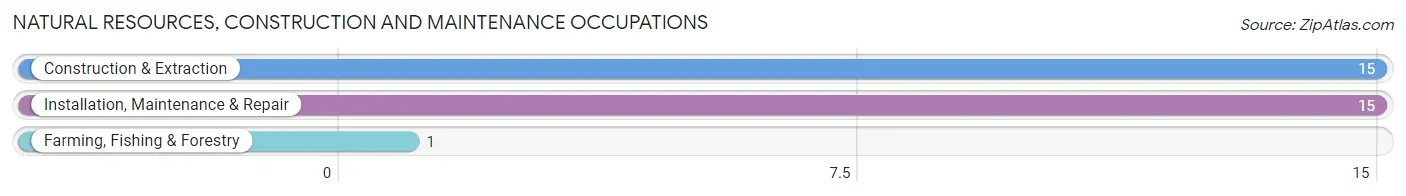
Natural Resources, Construction and Maintenance Occupations by Sex
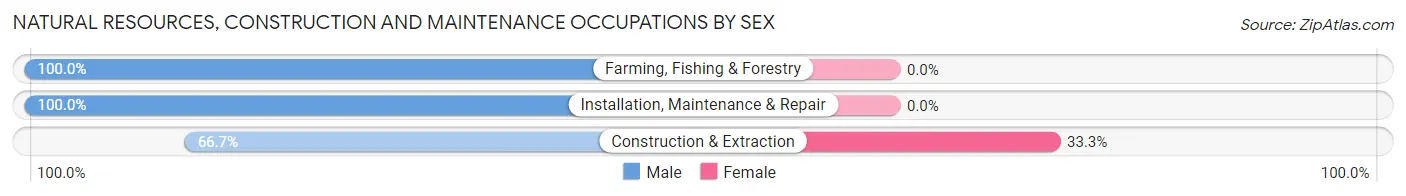
| Occupation | Male | Female |
| Farming, Fishing & Forestry | 1 (100.0%) | 0 (0.0%) |
| Construction & Extraction | 10 (66.7%) | 5 (33.3%) |
| Installation, Maintenance & Repair | 15 (100.0%) | 0 (0.0%) |
| Total (Category) | 26 (83.9%) | 5 (16.1%) |
| Total (Overall) | 120 (52.4%) | 109 (47.6%) |
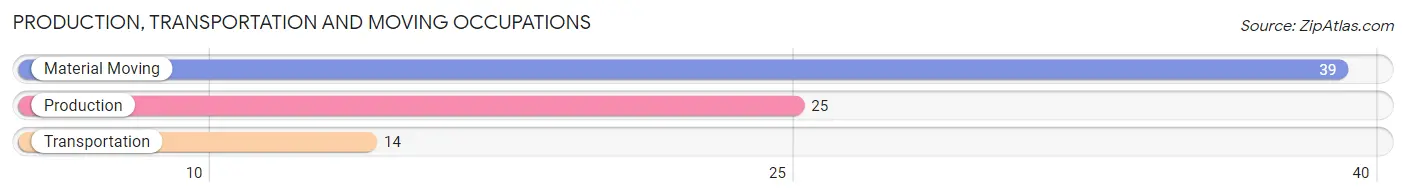
Production, Transportation and Moving Occupations
The most common Production, Transportation and Moving occupations in Byromville are Material Moving (39 | 17.0%), Production (25 | 10.9%), and Transportation (14 | 6.1%).
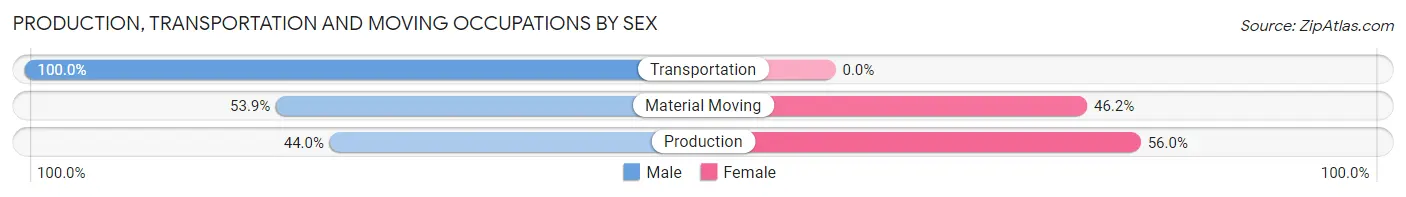
Production, Transportation and Moving Occupations by Sex
| Occupation | Male | Female |
| Production | 11 (44.0%) | 14 (56.0%) |
| Transportation | 14 (100.0%) | 0 (0.0%) |
| Material Moving | 21 (53.8%) | 18 (46.2%) |
| Total (Category) | 46 (59.0%) | 32 (41.0%) |
| Total (Overall) | 120 (52.4%) | 109 (47.6%) |
Employment Industries by Sex in Byromville
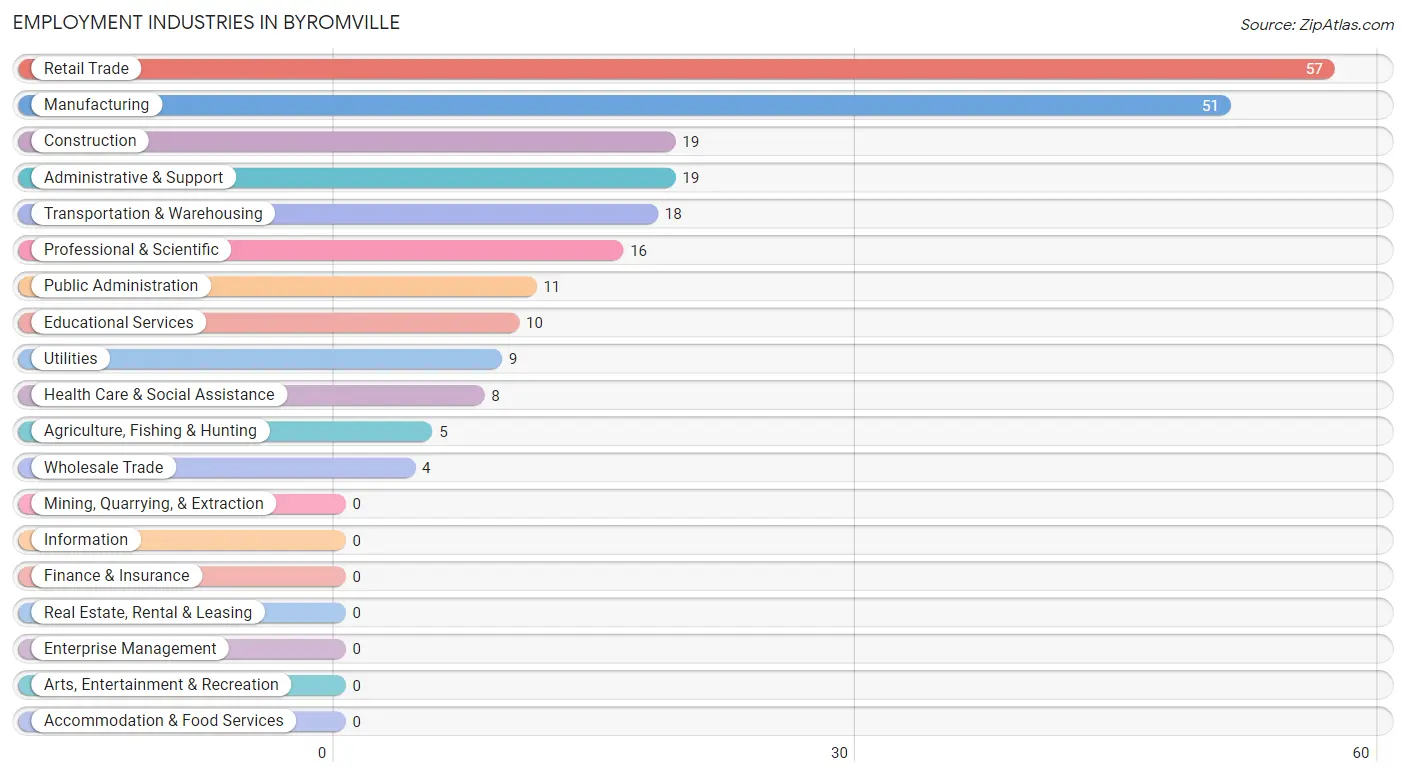
Employment Industries in Byromville
The major employment industries in Byromville include Retail Trade (57 | 24.9%), Manufacturing (51 | 22.3%), Construction (19 | 8.3%), Administrative & Support (19 | 8.3%), and Transportation & Warehousing (18 | 7.9%).
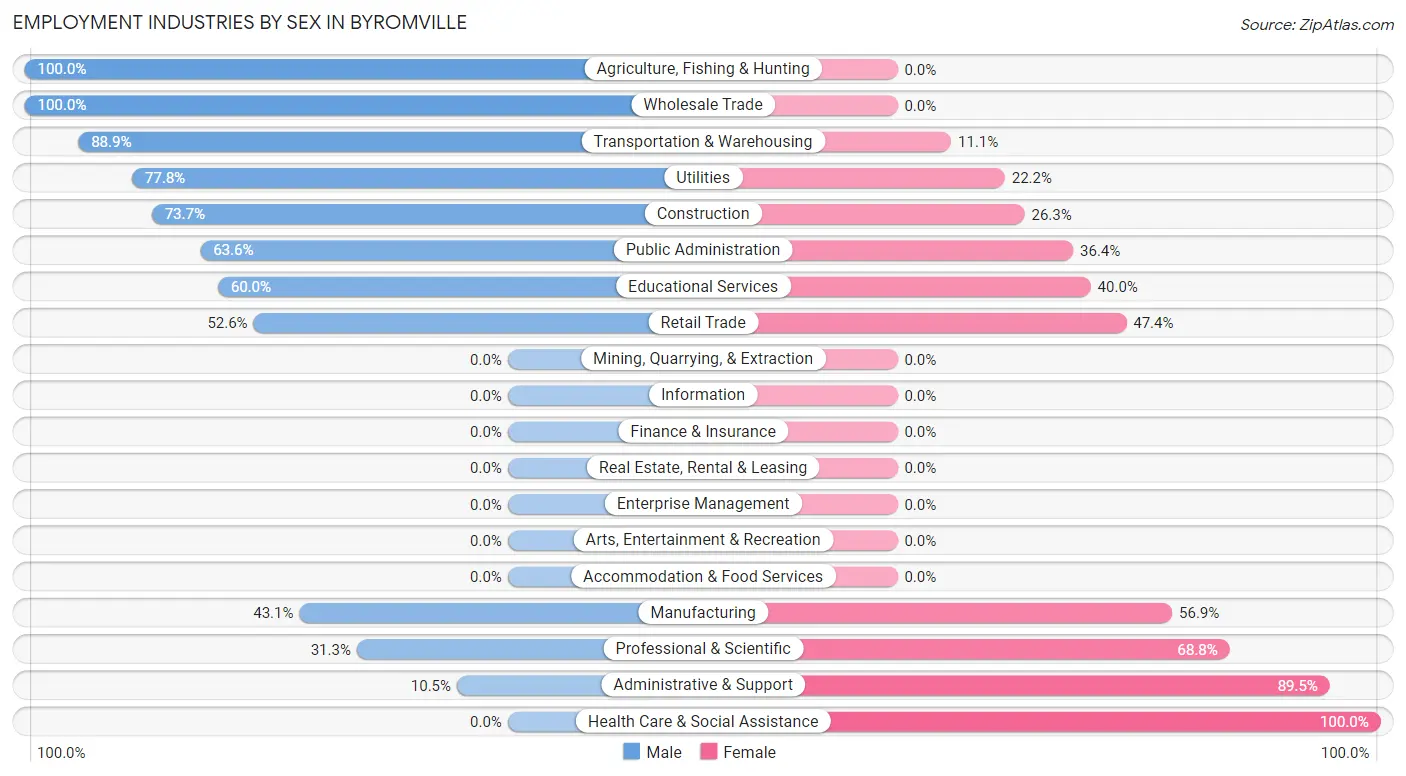
Employment Industries by Sex in Byromville
The Byromville industries that see more men than women are Agriculture, Fishing & Hunting (100.0%), Wholesale Trade (100.0%), and Transportation & Warehousing (88.9%), whereas the industries that tend to have a higher number of women are Health Care & Social Assistance (100.0%), Administrative & Support (89.5%), and Professional & Scientific (68.8%).
| Industry | Male | Female |
| Agriculture, Fishing & Hunting | 5 (100.0%) | 0 (0.0%) |
| Mining, Quarrying, & Extraction | 0 (0.0%) | 0 (0.0%) |
| Construction | 14 (73.7%) | 5 (26.3%) |
| Manufacturing | 22 (43.1%) | 29 (56.9%) |
| Wholesale Trade | 4 (100.0%) | 0 (0.0%) |
| Retail Trade | 30 (52.6%) | 27 (47.4%) |
| Transportation & Warehousing | 16 (88.9%) | 2 (11.1%) |
| Utilities | 7 (77.8%) | 2 (22.2%) |
| Information | 0 (0.0%) | 0 (0.0%) |
| Finance & Insurance | 0 (0.0%) | 0 (0.0%) |
| Real Estate, Rental & Leasing | 0 (0.0%) | 0 (0.0%) |
| Professional & Scientific | 5 (31.2%) | 11 (68.8%) |
| Enterprise Management | 0 (0.0%) | 0 (0.0%) |
| Administrative & Support | 2 (10.5%) | 17 (89.5%) |
| Educational Services | 6 (60.0%) | 4 (40.0%) |
| Health Care & Social Assistance | 0 (0.0%) | 8 (100.0%) |
| Arts, Entertainment & Recreation | 0 (0.0%) | 0 (0.0%) |
| Accommodation & Food Services | 0 (0.0%) | 0 (0.0%) |
| Public Administration | 7 (63.6%) | 4 (36.4%) |
| Total | 120 (52.4%) | 109 (47.6%) |
Education in Byromville
School Enrollment in Byromville
The most common levels of schooling among the 123 students in Byromville are high school (50 | 40.6%), middle school (32 | 26.0%), and elementary school (21 | 17.1%).
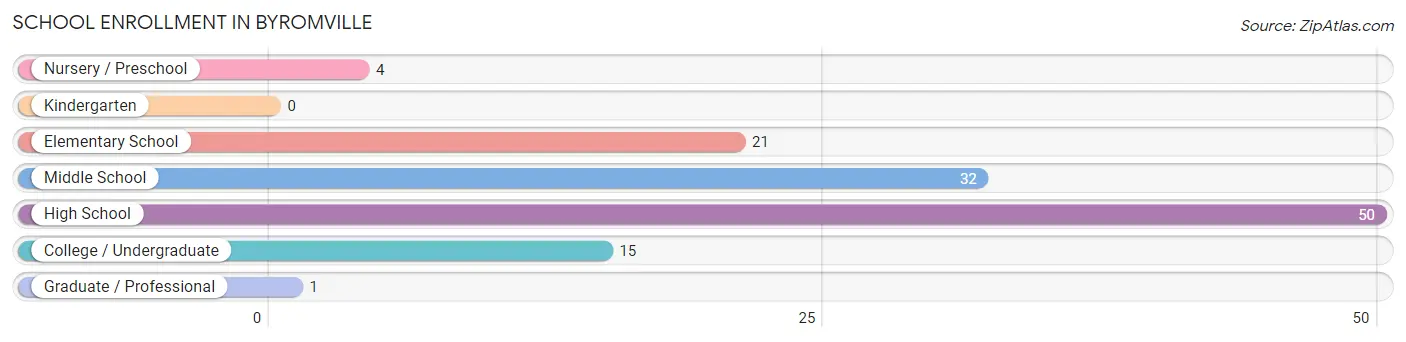
| School Level | # Students | % Students |
| Nursery / Preschool | 4 | 3.3% |
| Kindergarten | 0 | 0.0% |
| Elementary School | 21 | 17.1% |
| Middle School | 32 | 26.0% |
| High School | 50 | 40.6% |
| College / Undergraduate | 15 | 12.2% |
| Graduate / Professional | 1 | 0.8% |
| Total | 123 | 100.0% |
School Enrollment by Age by Funding Source in Byromville
Out of a total of 123 students who are enrolled in schools in Byromville, 4 (3.3%) attend a private institution, while the remaining 119 (96.7%) are enrolled in public schools. The age group of 25 to 34 year olds has the highest likelihood of being enrolled in private schools, with 1 (100.0% in the age bracket) enrolled. Conversely, the age group of 3 to 4 year olds has the lowest likelihood of being enrolled in a private school, with 4 (100.0% in the age bracket) attending a public institution.
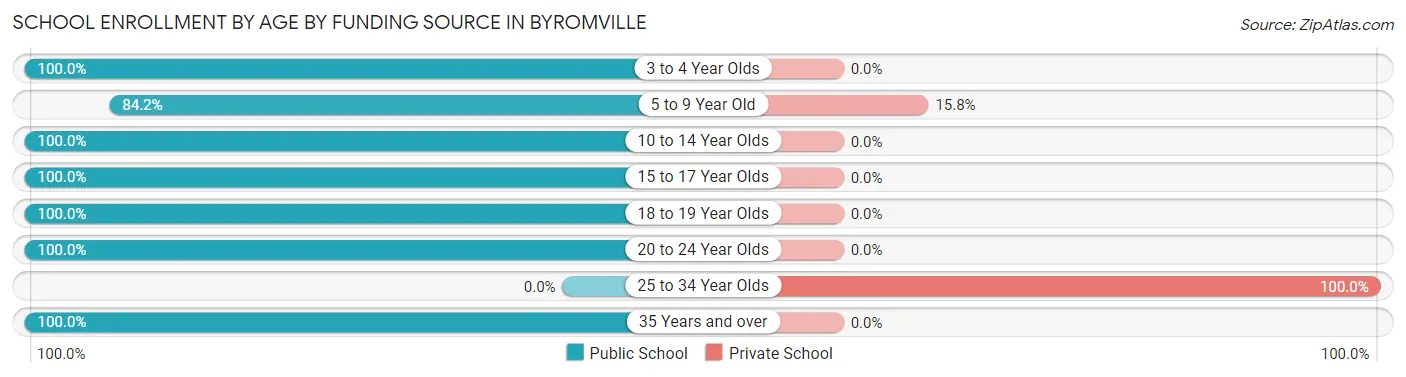
| Age Bracket | Public School | Private School |
| 3 to 4 Year Olds | 4 (100.0%) | 0 (0.0%) |
| 5 to 9 Year Old | 16 (84.2%) | 3 (15.8%) |
| 10 to 14 Year Olds | 51 (100.0%) | 0 (0.0%) |
| 15 to 17 Year Olds | 26 (100.0%) | 0 (0.0%) |
| 18 to 19 Year Olds | 7 (100.0%) | 0 (0.0%) |
| 20 to 24 Year Olds | 13 (100.0%) | 0 (0.0%) |
| 25 to 34 Year Olds | 0 (0.0%) | 1 (100.0%) |
| 35 Years and over | 2 (100.0%) | 0 (0.0%) |
| Total | 119 (96.7%) | 4 (3.3%) |
Educational Attainment by Field of Study in Byromville
Education (22 | 43.1%), computers & mathematics (11 | 21.6%), business (6 | 11.8%), arts & humanities (5 | 9.8%), and engineering (3 | 5.9%) are the most common fields of study among 51 individuals in Byromville who have obtained a bachelor's degree or higher.
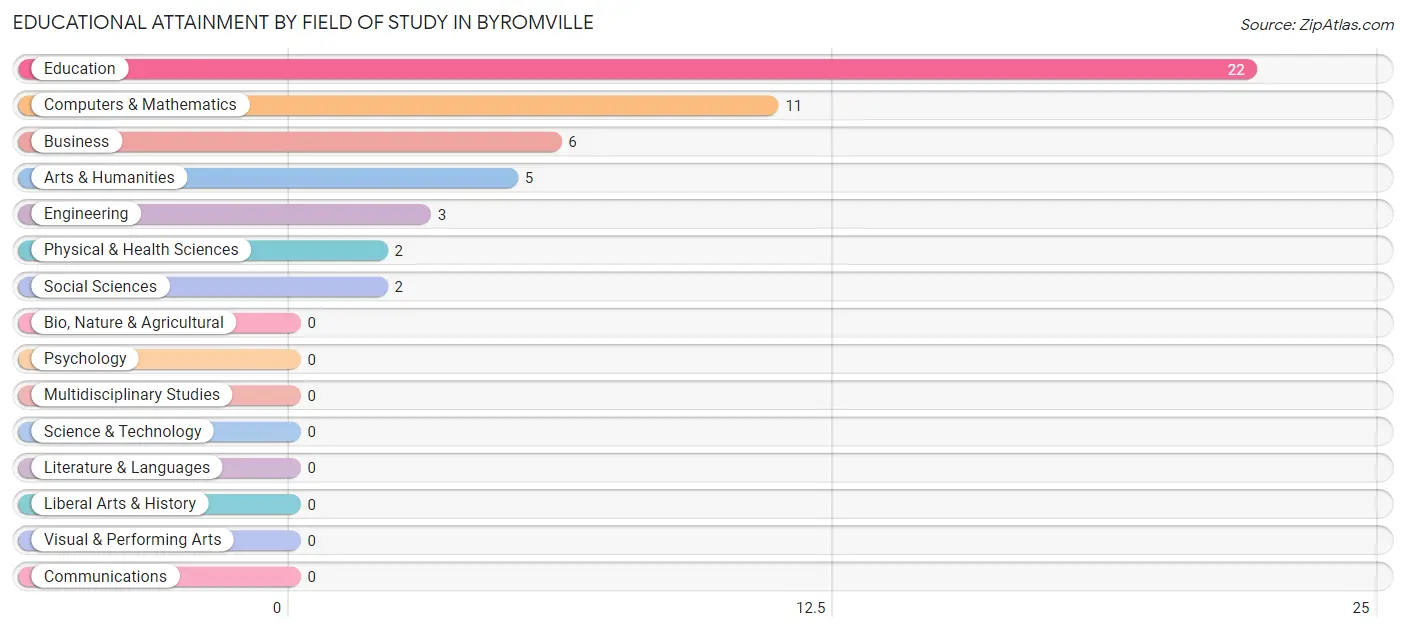
| Field of Study | # Graduates | % Graduates |
| Computers & Mathematics | 11 | 21.6% |
| Bio, Nature & Agricultural | 0 | 0.0% |
| Physical & Health Sciences | 2 | 3.9% |
| Psychology | 0 | 0.0% |
| Social Sciences | 2 | 3.9% |
| Engineering | 3 | 5.9% |
| Multidisciplinary Studies | 0 | 0.0% |
| Science & Technology | 0 | 0.0% |
| Business | 6 | 11.8% |
| Education | 22 | 43.1% |
| Literature & Languages | 0 | 0.0% |
| Liberal Arts & History | 0 | 0.0% |
| Visual & Performing Arts | 0 | 0.0% |
| Communications | 0 | 0.0% |
| Arts & Humanities | 5 | 9.8% |
| Total | 51 | 100.0% |
Transportation & Commute in Byromville
Vehicle Availability by Sex in Byromville
The most prevalent vehicle ownership categories in Byromville are males with 3 vehicles (40, accounting for 34.5%) and females with 3 vehicles (30, making up 36.7%).
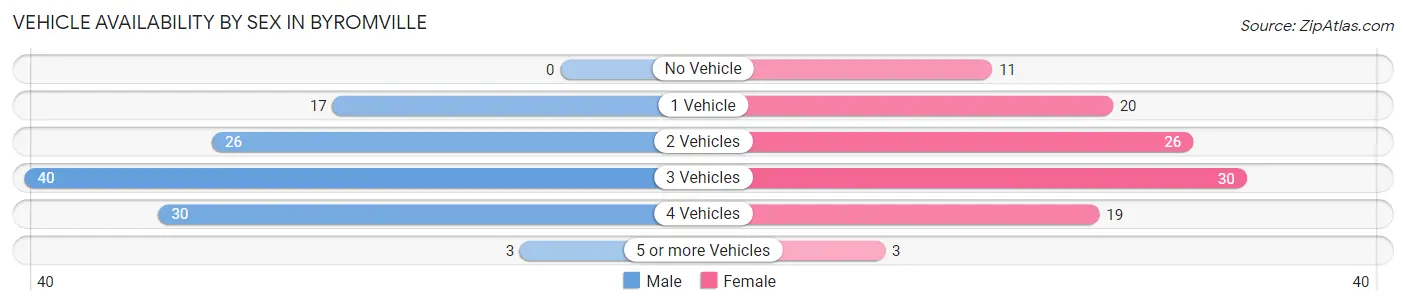
| Vehicles Available | Male | Female |
| No Vehicle | 0 (0.0%) | 11 (10.1%) |
| 1 Vehicle | 17 (14.7%) | 20 (18.3%) |
| 2 Vehicles | 26 (22.4%) | 26 (23.8%) |
| 3 Vehicles | 40 (34.5%) | 30 (27.5%) |
| 4 Vehicles | 30 (25.9%) | 19 (17.4%) |
| 5 or more Vehicles | 3 (2.6%) | 3 (2.8%) |
| Total | 116 (100.0%) | 109 (100.0%) |
Commute Time in Byromville
The most frequently occuring commute durations in Byromville are 30 to 34 minutes (61 commuters, 30.0%), 15 to 19 minutes (33 commuters, 16.3%), and 20 to 24 minutes (24 commuters, 11.8%).
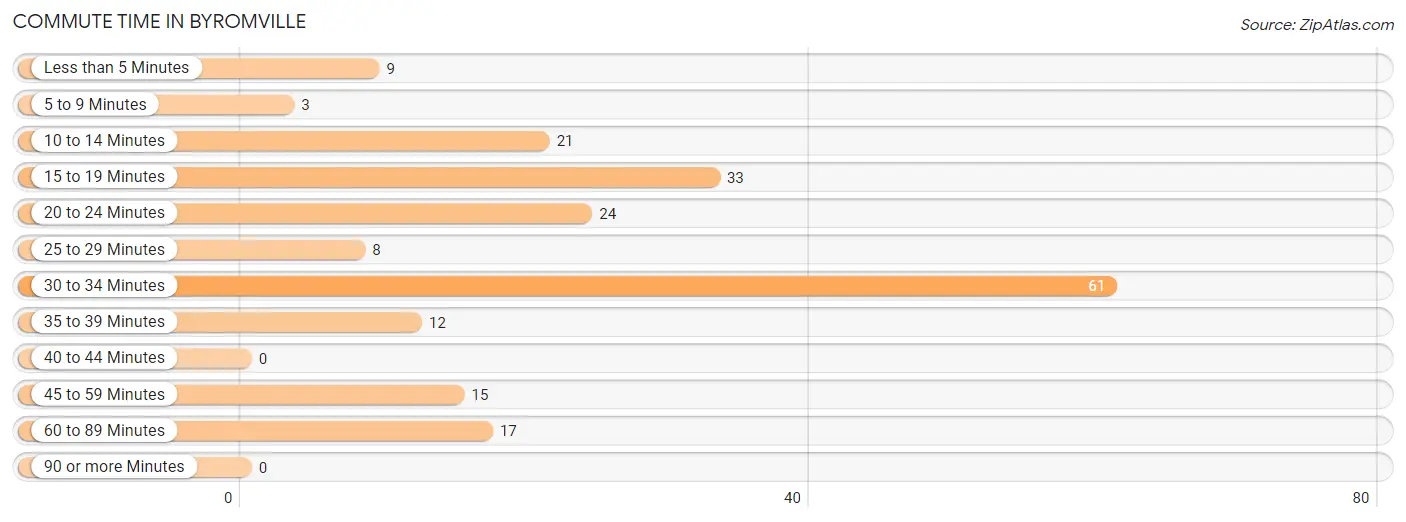
| Commute Time | # Commuters | % Commuters |
| Less than 5 Minutes | 9 | 4.4% |
| 5 to 9 Minutes | 3 | 1.5% |
| 10 to 14 Minutes | 21 | 10.3% |
| 15 to 19 Minutes | 33 | 16.3% |
| 20 to 24 Minutes | 24 | 11.8% |
| 25 to 29 Minutes | 8 | 3.9% |
| 30 to 34 Minutes | 61 | 30.0% |
| 35 to 39 Minutes | 12 | 5.9% |
| 40 to 44 Minutes | 0 | 0.0% |
| 45 to 59 Minutes | 15 | 7.4% |
| 60 to 89 Minutes | 17 | 8.4% |
| 90 or more Minutes | 0 | 0.0% |
Commute Time by Sex in Byromville
The most common commute times in Byromville are 30 to 34 minutes (26 commuters, 25.0%) for males and 30 to 34 minutes (35 commuters, 35.3%) for females.
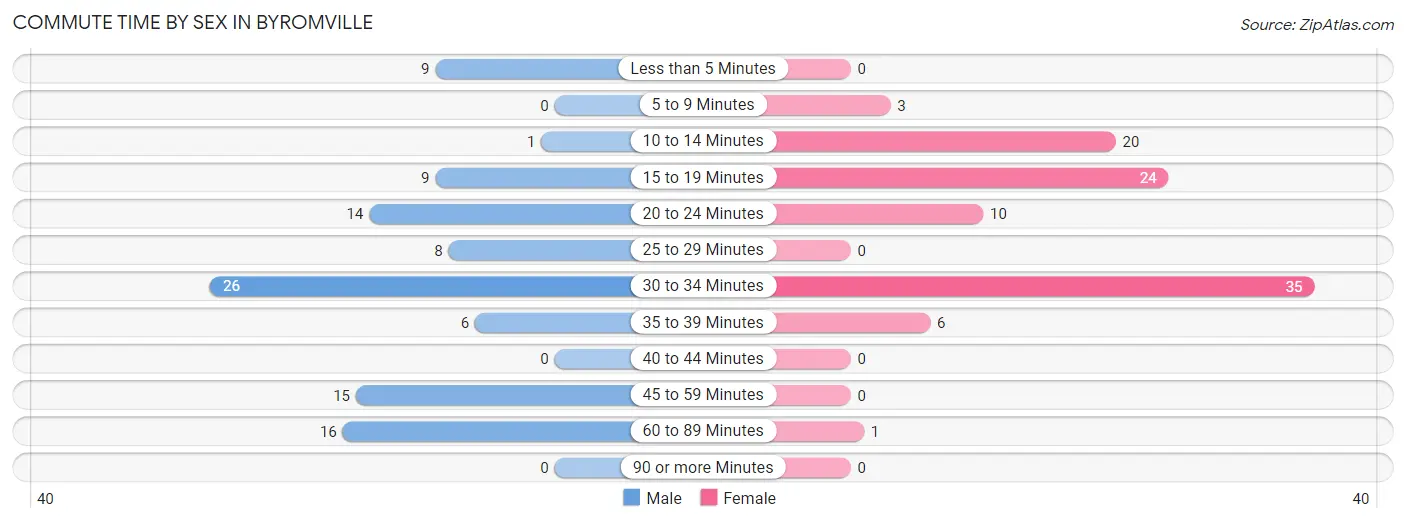
| Commute Time | Male | Female |
| Less than 5 Minutes | 9 (8.6%) | 0 (0.0%) |
| 5 to 9 Minutes | 0 (0.0%) | 3 (3.0%) |
| 10 to 14 Minutes | 1 (1.0%) | 20 (20.2%) |
| 15 to 19 Minutes | 9 (8.6%) | 24 (24.2%) |
| 20 to 24 Minutes | 14 (13.5%) | 10 (10.1%) |
| 25 to 29 Minutes | 8 (7.7%) | 0 (0.0%) |
| 30 to 34 Minutes | 26 (25.0%) | 35 (35.3%) |
| 35 to 39 Minutes | 6 (5.8%) | 6 (6.1%) |
| 40 to 44 Minutes | 0 (0.0%) | 0 (0.0%) |
| 45 to 59 Minutes | 15 (14.4%) | 0 (0.0%) |
| 60 to 89 Minutes | 16 (15.4%) | 1 (1.0%) |
| 90 or more Minutes | 0 (0.0%) | 0 (0.0%) |
Time of Departure to Work by Sex in Byromville
The most frequent times of departure to work in Byromville are 5:00 AM to 5:29 AM (30, 28.8%) for males and 7:30 AM to 7:59 AM (32, 32.3%) for females.
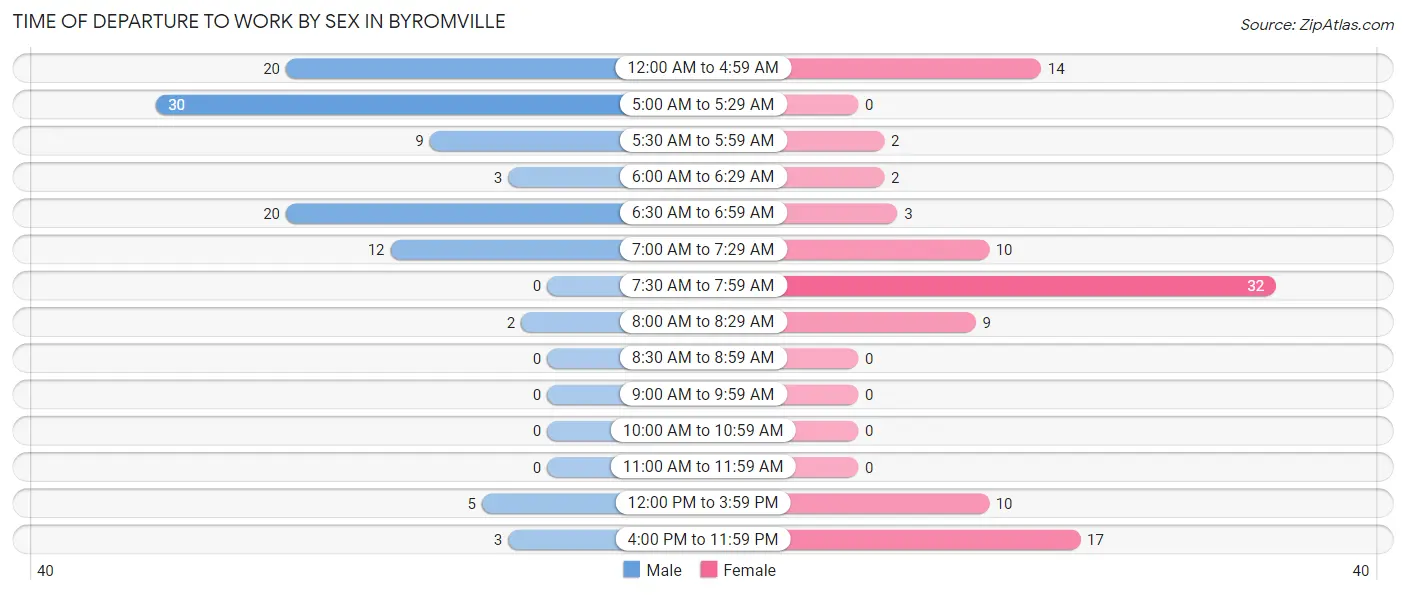
| Time of Departure | Male | Female |
| 12:00 AM to 4:59 AM | 20 (19.2%) | 14 (14.1%) |
| 5:00 AM to 5:29 AM | 30 (28.8%) | 0 (0.0%) |
| 5:30 AM to 5:59 AM | 9 (8.6%) | 2 (2.0%) |
| 6:00 AM to 6:29 AM | 3 (2.9%) | 2 (2.0%) |
| 6:30 AM to 6:59 AM | 20 (19.2%) | 3 (3.0%) |
| 7:00 AM to 7:29 AM | 12 (11.5%) | 10 (10.1%) |
| 7:30 AM to 7:59 AM | 0 (0.0%) | 32 (32.3%) |
| 8:00 AM to 8:29 AM | 2 (1.9%) | 9 (9.1%) |
| 8:30 AM to 8:59 AM | 0 (0.0%) | 0 (0.0%) |
| 9:00 AM to 9:59 AM | 0 (0.0%) | 0 (0.0%) |
| 10:00 AM to 10:59 AM | 0 (0.0%) | 0 (0.0%) |
| 11:00 AM to 11:59 AM | 0 (0.0%) | 0 (0.0%) |
| 12:00 PM to 3:59 PM | 5 (4.8%) | 10 (10.1%) |
| 4:00 PM to 11:59 PM | 3 (2.9%) | 17 (17.2%) |
| Total | 104 (100.0%) | 99 (100.0%) |
Housing Occupancy in Byromville
Occupancy by Ownership in Byromville
Of the total 175 dwellings in Byromville, owner-occupied units account for 128 (73.1%), while renter-occupied units make up 47 (26.9%).
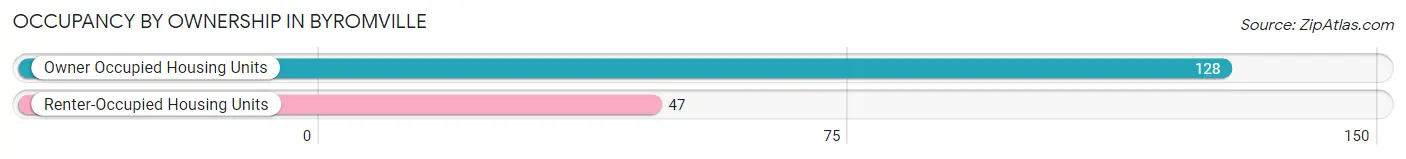
| Occupancy | # Housing Units | % Housing Units |
| Owner Occupied Housing Units | 128 | 73.1% |
| Renter-Occupied Housing Units | 47 | 26.9% |
| Total Occupied Housing Units | 175 | 100.0% |
Occupancy by Household Size in Byromville
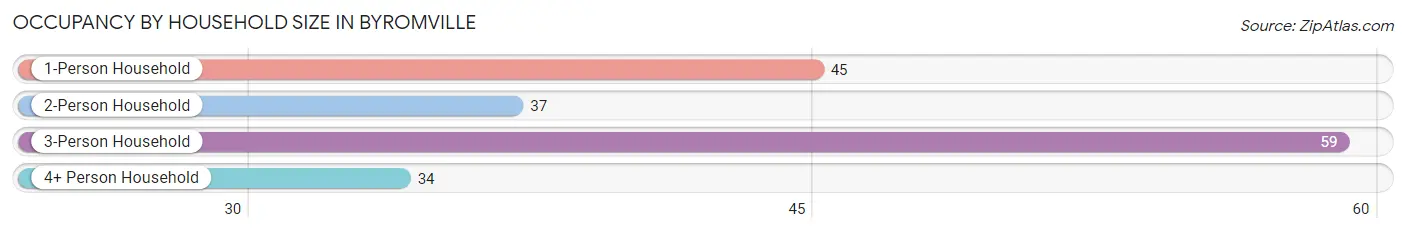
| Household Size | # Housing Units | % Housing Units |
| 1-Person Household | 45 | 25.7% |
| 2-Person Household | 37 | 21.1% |
| 3-Person Household | 59 | 33.7% |
| 4+ Person Household | 34 | 19.4% |
| Total Housing Units | 175 | 100.0% |
Occupancy by Ownership by Household Size in Byromville
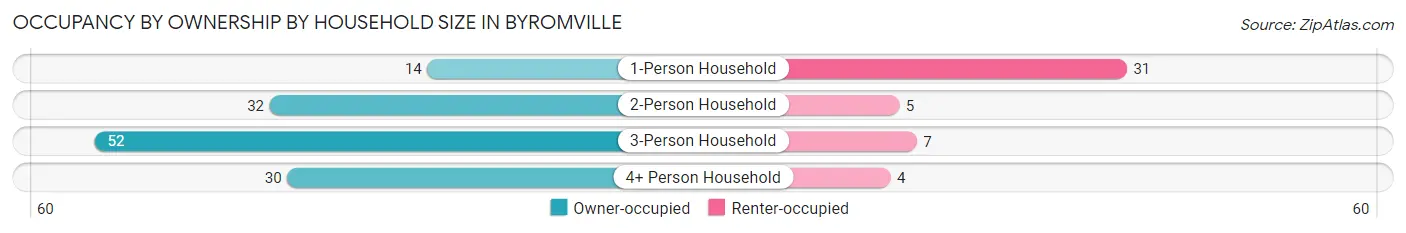
| Household Size | Owner-occupied | Renter-occupied |
| 1-Person Household | 14 (31.1%) | 31 (68.9%) |
| 2-Person Household | 32 (86.5%) | 5 (13.5%) |
| 3-Person Household | 52 (88.1%) | 7 (11.9%) |
| 4+ Person Household | 30 (88.2%) | 4 (11.8%) |
| Total Housing Units | 128 (73.1%) | 47 (26.9%) |
Occupancy by Educational Attainment in Byromville
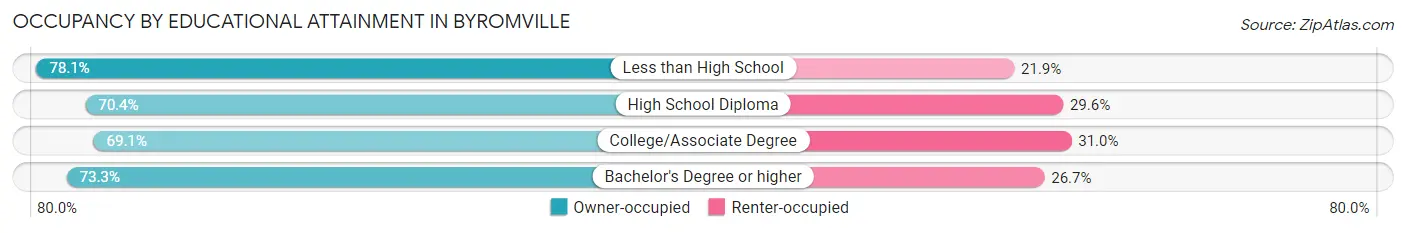
| Household Size | Owner-occupied | Renter-occupied |
| Less than High School | 50 (78.1%) | 14 (21.9%) |
| High School Diploma | 38 (70.4%) | 16 (29.6%) |
| College/Associate Degree | 29 (69.1%) | 13 (30.9%) |
| Bachelor's Degree or higher | 11 (73.3%) | 4 (26.7%) |
Occupancy by Age of Householder in Byromville
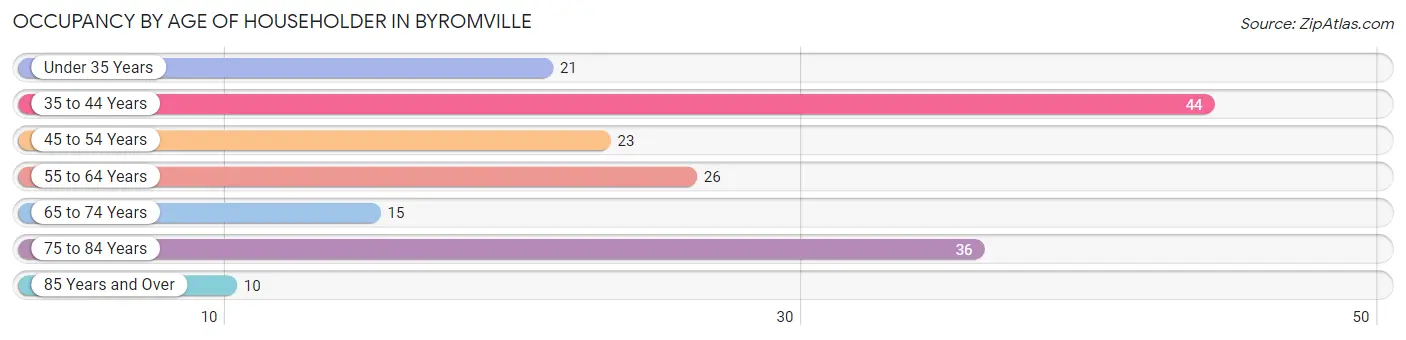
| Age Bracket | # Households | % Households |
| Under 35 Years | 21 | 12.0% |
| 35 to 44 Years | 44 | 25.1% |
| 45 to 54 Years | 23 | 13.1% |
| 55 to 64 Years | 26 | 14.9% |
| 65 to 74 Years | 15 | 8.6% |
| 75 to 84 Years | 36 | 20.6% |
| 85 Years and Over | 10 | 5.7% |
| Total | 175 | 100.0% |
Housing Finances in Byromville
Median Income by Occupancy in Byromville
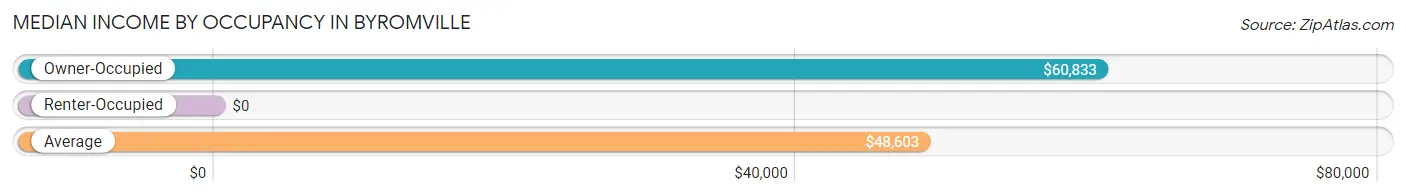
| Occupancy Type | # Households | Median Income |
| Owner-Occupied | 128 (73.1%) | $60,833 |
| Renter-Occupied | 47 (26.9%) | $0 |
| Average | 175 (100.0%) | $48,603 |
Occupancy by Householder Income Bracket in Byromville
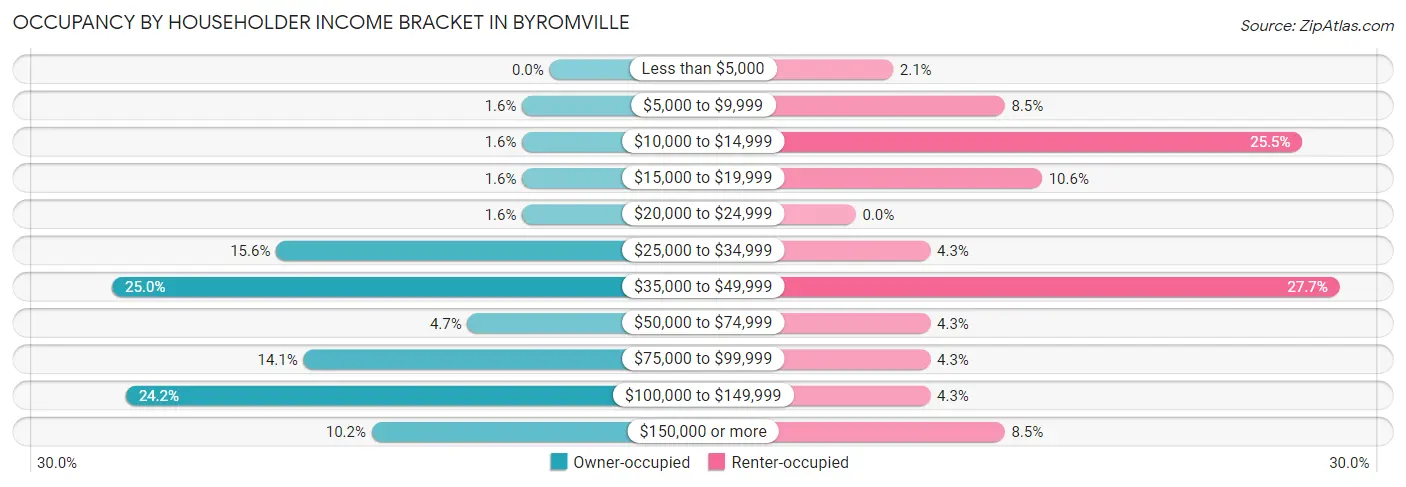
| Income Bracket | Owner-occupied | Renter-occupied |
| Less than $5,000 | 0 (0.0%) | 1 (2.1%) |
| $5,000 to $9,999 | 2 (1.6%) | 4 (8.5%) |
| $10,000 to $14,999 | 2 (1.6%) | 12 (25.5%) |
| $15,000 to $19,999 | 2 (1.6%) | 5 (10.6%) |
| $20,000 to $24,999 | 2 (1.6%) | 0 (0.0%) |
| $25,000 to $34,999 | 20 (15.6%) | 2 (4.3%) |
| $35,000 to $49,999 | 32 (25.0%) | 13 (27.7%) |
| $50,000 to $74,999 | 6 (4.7%) | 2 (4.3%) |
| $75,000 to $99,999 | 18 (14.1%) | 2 (4.3%) |
| $100,000 to $149,999 | 31 (24.2%) | 2 (4.3%) |
| $150,000 or more | 13 (10.2%) | 4 (8.5%) |
| Total | 128 (100.0%) | 47 (100.0%) |
Monthly Housing Cost Tiers in Byromville
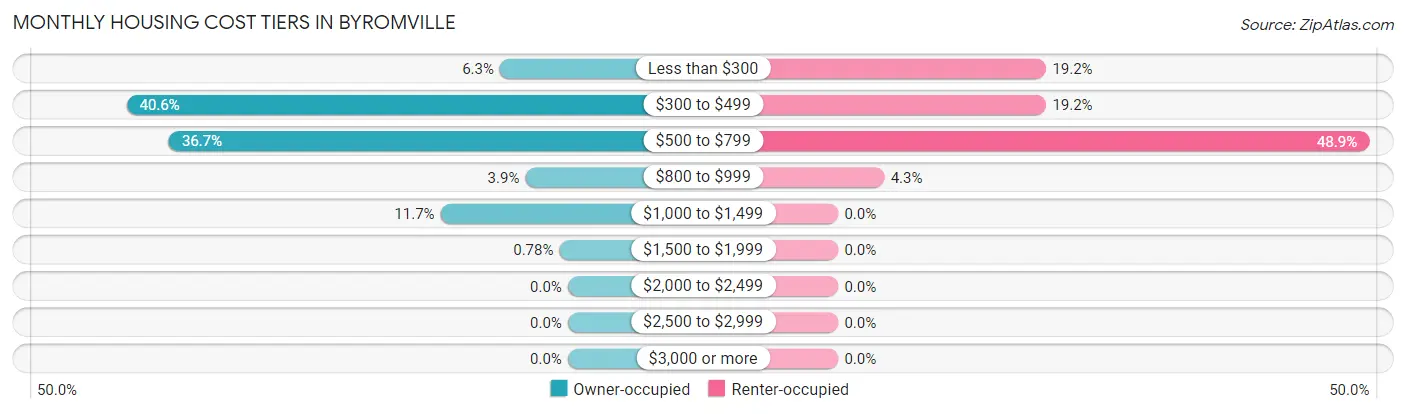
| Monthly Cost | Owner-occupied | Renter-occupied |
| Less than $300 | 8 (6.2%) | 9 (19.2%) |
| $300 to $499 | 52 (40.6%) | 9 (19.2%) |
| $500 to $799 | 47 (36.7%) | 23 (48.9%) |
| $800 to $999 | 5 (3.9%) | 2 (4.3%) |
| $1,000 to $1,499 | 15 (11.7%) | 0 (0.0%) |
| $1,500 to $1,999 | 1 (0.8%) | 0 (0.0%) |
| $2,000 to $2,499 | 0 (0.0%) | 0 (0.0%) |
| $2,500 to $2,999 | 0 (0.0%) | 0 (0.0%) |
| $3,000 or more | 0 (0.0%) | 0 (0.0%) |
| Total | 128 (100.0%) | 47 (100.0%) |
Physical Housing Characteristics in Byromville
Housing Structures in Byromville
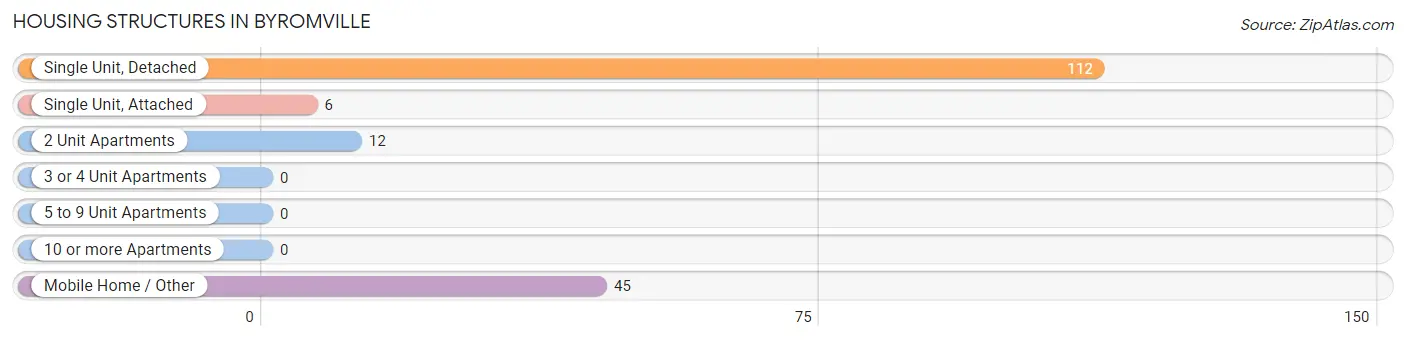
| Structure Type | # Housing Units | % Housing Units |
| Single Unit, Detached | 112 | 64.0% |
| Single Unit, Attached | 6 | 3.4% |
| 2 Unit Apartments | 12 | 6.9% |
| 3 or 4 Unit Apartments | 0 | 0.0% |
| 5 to 9 Unit Apartments | 0 | 0.0% |
| 10 or more Apartments | 0 | 0.0% |
| Mobile Home / Other | 45 | 25.7% |
| Total | 175 | 100.0% |
Housing Structures by Occupancy in Byromville
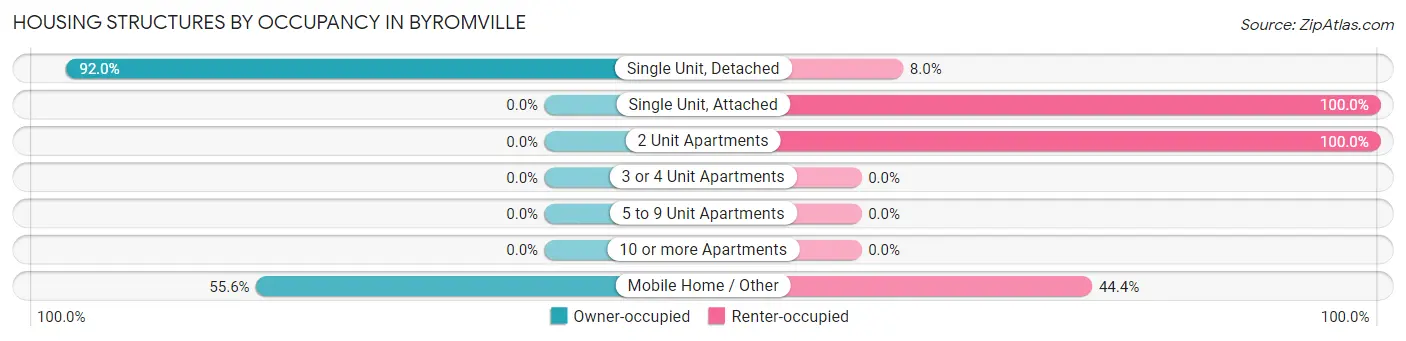
| Structure Type | Owner-occupied | Renter-occupied |
| Single Unit, Detached | 103 (92.0%) | 9 (8.0%) |
| Single Unit, Attached | 0 (0.0%) | 6 (100.0%) |
| 2 Unit Apartments | 0 (0.0%) | 12 (100.0%) |
| 3 or 4 Unit Apartments | 0 (0.0%) | 0 (0.0%) |
| 5 to 9 Unit Apartments | 0 (0.0%) | 0 (0.0%) |
| 10 or more Apartments | 0 (0.0%) | 0 (0.0%) |
| Mobile Home / Other | 25 (55.6%) | 20 (44.4%) |
| Total | 128 (73.1%) | 47 (26.9%) |
Housing Structures by Number of Rooms in Byromville
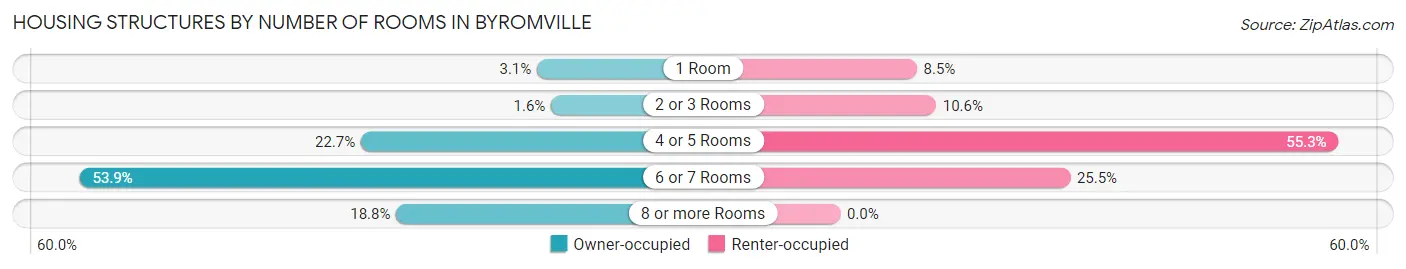
| Number of Rooms | Owner-occupied | Renter-occupied |
| 1 Room | 4 (3.1%) | 4 (8.5%) |
| 2 or 3 Rooms | 2 (1.6%) | 5 (10.6%) |
| 4 or 5 Rooms | 29 (22.7%) | 26 (55.3%) |
| 6 or 7 Rooms | 69 (53.9%) | 12 (25.5%) |
| 8 or more Rooms | 24 (18.8%) | 0 (0.0%) |
| Total | 128 (100.0%) | 47 (100.0%) |
Housing Structure by Heating Type in Byromville
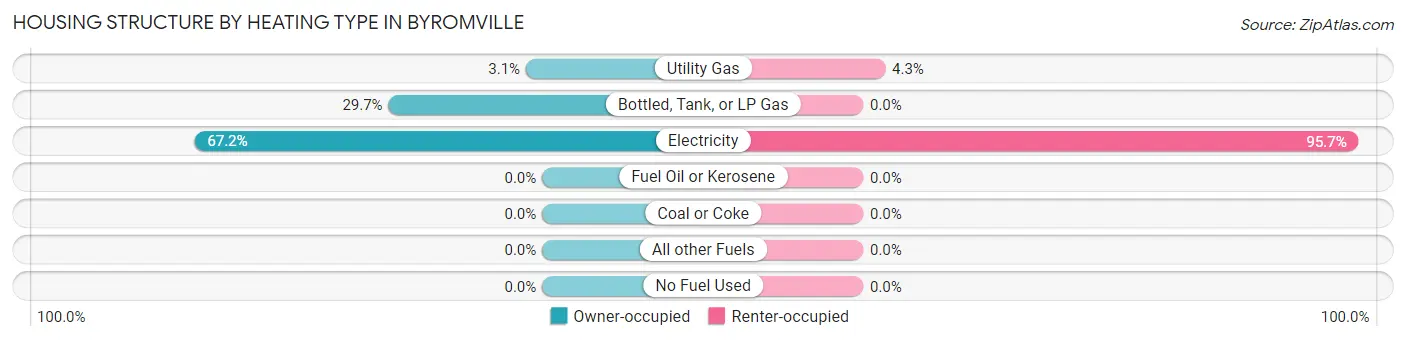
| Heating Type | Owner-occupied | Renter-occupied |
| Utility Gas | 4 (3.1%) | 2 (4.3%) |
| Bottled, Tank, or LP Gas | 38 (29.7%) | 0 (0.0%) |
| Electricity | 86 (67.2%) | 45 (95.7%) |
| Fuel Oil or Kerosene | 0 (0.0%) | 0 (0.0%) |
| Coal or Coke | 0 (0.0%) | 0 (0.0%) |
| All other Fuels | 0 (0.0%) | 0 (0.0%) |
| No Fuel Used | 0 (0.0%) | 0 (0.0%) |
| Total | 128 (100.0%) | 47 (100.0%) |
Household Vehicle Usage in Byromville
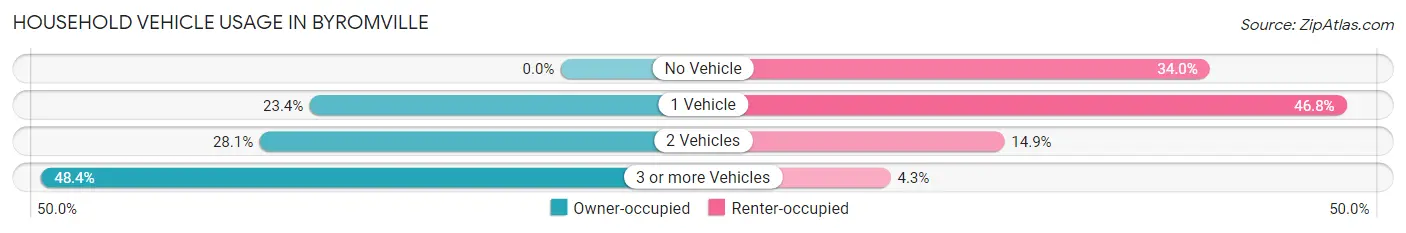
| Vehicles per Household | Owner-occupied | Renter-occupied |
| No Vehicle | 0 (0.0%) | 16 (34.0%) |
| 1 Vehicle | 30 (23.4%) | 22 (46.8%) |
| 2 Vehicles | 36 (28.1%) | 7 (14.9%) |
| 3 or more Vehicles | 62 (48.4%) | 2 (4.3%) |
| Total | 128 (100.0%) | 47 (100.0%) |
Real Estate & Mortgages in Byromville
Real Estate and Mortgage Overview in Byromville
| Characteristic | Without Mortgage | With Mortgage |
| Housing Units | 105 | 23 |
| Median Property Value | $55,300 | $132,500 |
| Median Household Income | $49,327 | $2 |
| Monthly Housing Costs | $481 | $0 |
| Real Estate Taxes | $861 | $5 |
Property Value by Mortgage Status in Byromville
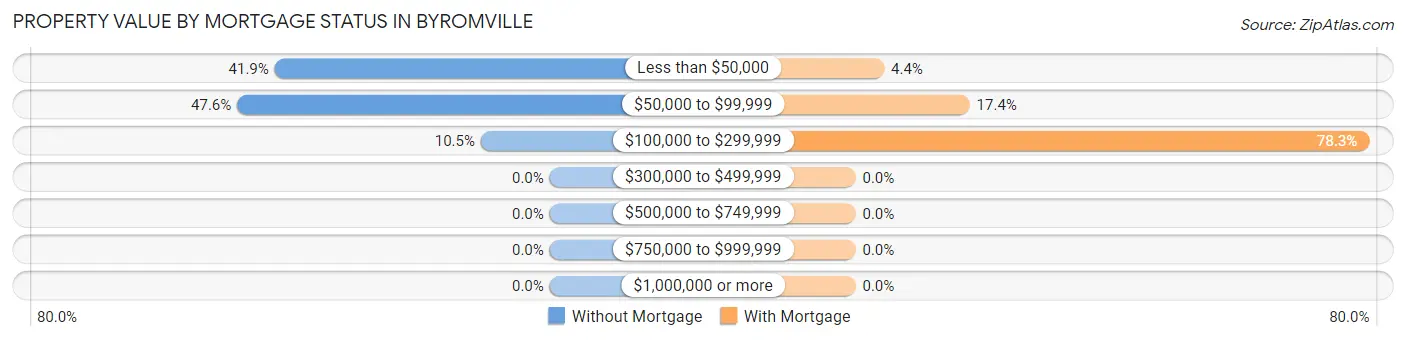
| Property Value | Without Mortgage | With Mortgage |
| Less than $50,000 | 44 (41.9%) | 1 (4.3%) |
| $50,000 to $99,999 | 50 (47.6%) | 4 (17.4%) |
| $100,000 to $299,999 | 11 (10.5%) | 18 (78.3%) |
| $300,000 to $499,999 | 0 (0.0%) | 0 (0.0%) |
| $500,000 to $749,999 | 0 (0.0%) | 0 (0.0%) |
| $750,000 to $999,999 | 0 (0.0%) | 0 (0.0%) |
| $1,000,000 or more | 0 (0.0%) | 0 (0.0%) |
| Total | 105 (100.0%) | 23 (100.0%) |
Household Income by Mortgage Status in Byromville
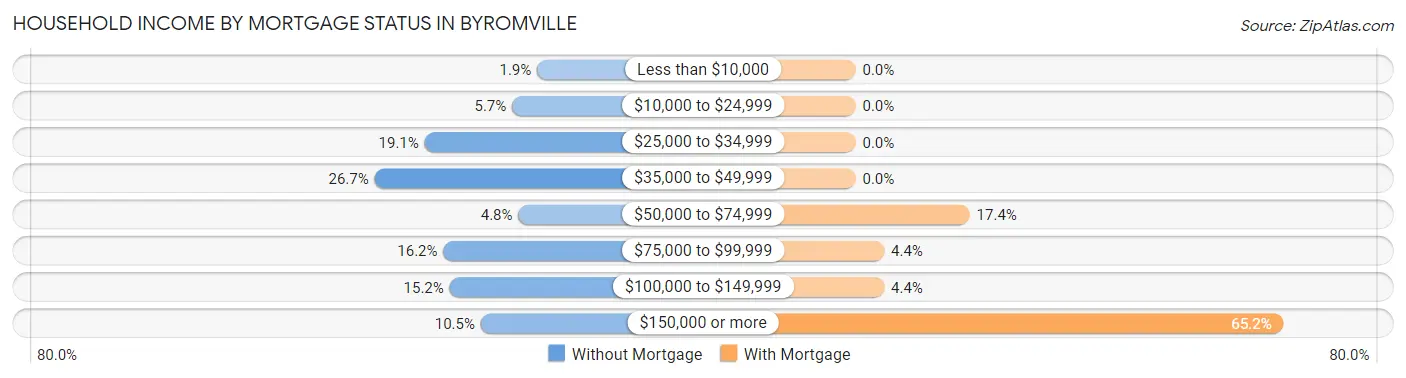
| Household Income | Without Mortgage | With Mortgage |
| Less than $10,000 | 2 (1.9%) | 0 (0.0%) |
| $10,000 to $24,999 | 6 (5.7%) | 0 (0.0%) |
| $25,000 to $34,999 | 20 (19.1%) | 0 (0.0%) |
| $35,000 to $49,999 | 28 (26.7%) | 0 (0.0%) |
| $50,000 to $74,999 | 5 (4.8%) | 4 (17.4%) |
| $75,000 to $99,999 | 17 (16.2%) | 1 (4.3%) |
| $100,000 to $149,999 | 16 (15.2%) | 1 (4.3%) |
| $150,000 or more | 11 (10.5%) | 15 (65.2%) |
| Total | 105 (100.0%) | 23 (100.0%) |
Property Value to Household Income Ratio in Byromville
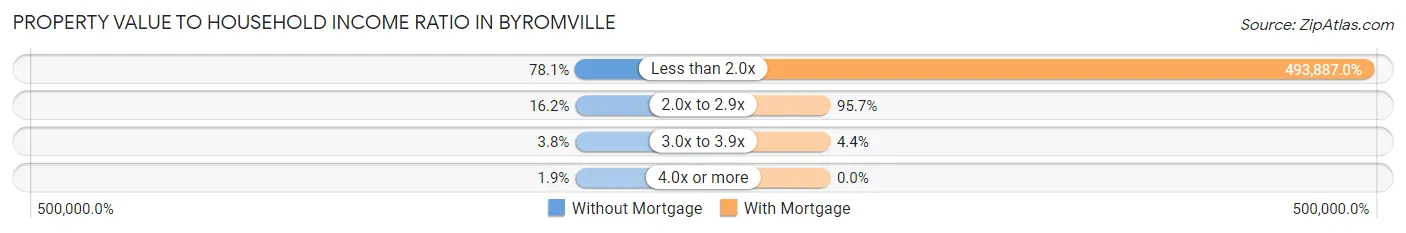
| Value-to-Income Ratio | Without Mortgage | With Mortgage |
| Less than 2.0x | 82 (78.1%) | 113,594 (493,887.0%) |
| 2.0x to 2.9x | 17 (16.2%) | 22 (95.7%) |
| 3.0x to 3.9x | 4 (3.8%) | 1 (4.3%) |
| 4.0x or more | 2 (1.9%) | 0 (0.0%) |
| Total | 105 (100.0%) | 23 (100.0%) |
Real Estate Taxes by Mortgage Status in Byromville
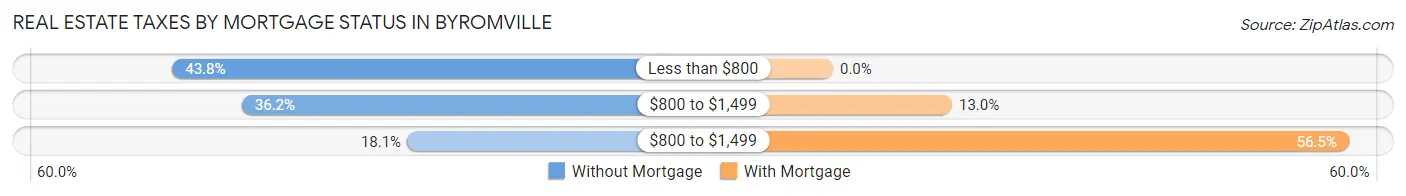
| Property Taxes | Without Mortgage | With Mortgage |
| Less than $800 | 46 (43.8%) | 0 (0.0%) |
| $800 to $1,499 | 38 (36.2%) | 3 (13.0%) |
| $800 to $1,499 | 19 (18.1%) | 13 (56.5%) |
| Total | 105 (100.0%) | 23 (100.0%) |
Health & Disability in Byromville
Health Insurance Coverage by Age in Byromville
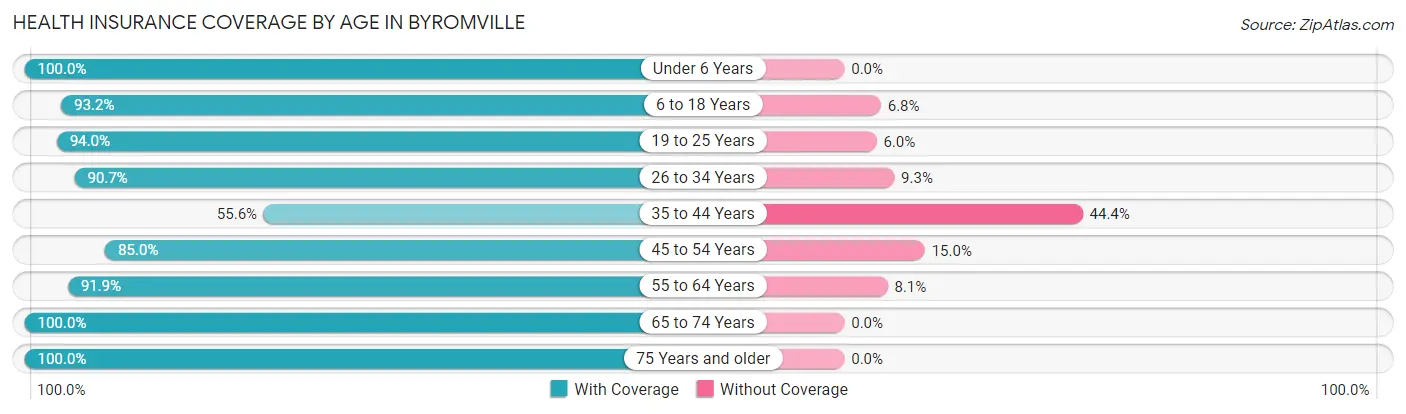
| Age Bracket | With Coverage | Without Coverage |
| Under 6 Years | 38 (100.0%) | 0 (0.0%) |
| 6 to 18 Years | 96 (93.2%) | 7 (6.8%) |
| 19 to 25 Years | 47 (94.0%) | 3 (6.0%) |
| 26 to 34 Years | 39 (90.7%) | 4 (9.3%) |
| 35 to 44 Years | 45 (55.6%) | 36 (44.4%) |
| 45 to 54 Years | 34 (85.0%) | 6 (15.0%) |
| 55 to 64 Years | 57 (91.9%) | 5 (8.1%) |
| 65 to 74 Years | 35 (100.0%) | 0 (0.0%) |
| 75 Years and older | 55 (100.0%) | 0 (0.0%) |
| Total | 446 (88.0%) | 61 (12.0%) |
Health Insurance Coverage by Citizenship Status in Byromville
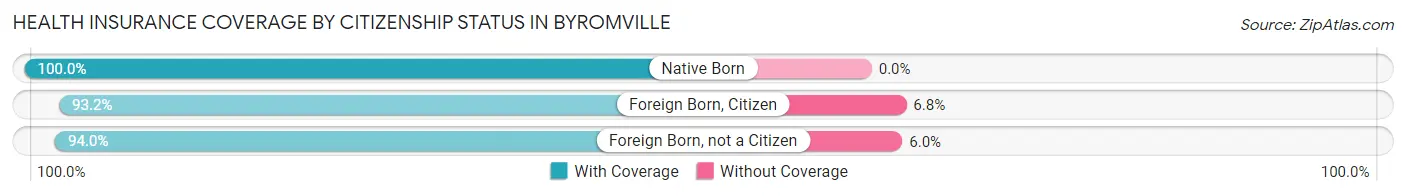
| Citizenship Status | With Coverage | Without Coverage |
| Native Born | 38 (100.0%) | 0 (0.0%) |
| Foreign Born, Citizen | 96 (93.2%) | 7 (6.8%) |
| Foreign Born, not a Citizen | 47 (94.0%) | 3 (6.0%) |
Health Insurance Coverage by Household Income in Byromville
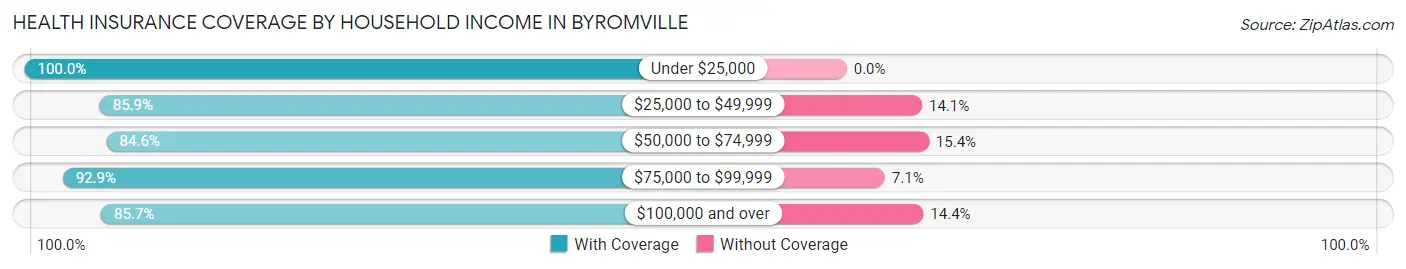
| Household Income | With Coverage | Without Coverage |
| Under $25,000 | 46 (100.0%) | 0 (0.0%) |
| $25,000 to $49,999 | 134 (85.9%) | 22 (14.1%) |
| $50,000 to $74,999 | 22 (84.6%) | 4 (15.4%) |
| $75,000 to $99,999 | 65 (92.9%) | 5 (7.1%) |
| $100,000 and over | 179 (85.7%) | 30 (14.3%) |
Public vs Private Health Insurance Coverage by Age in Byromville
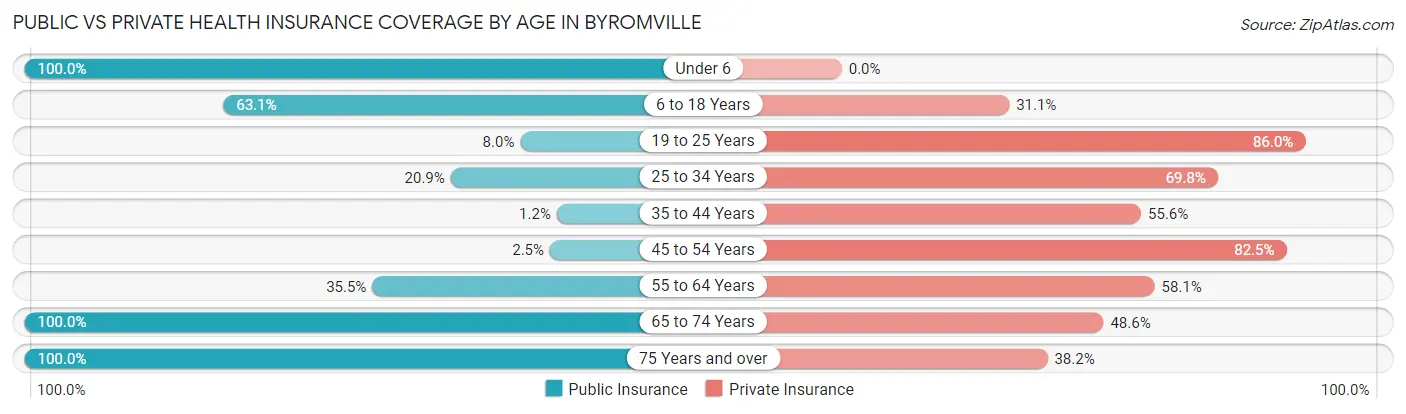
| Age Bracket | Public Insurance | Private Insurance |
| Under 6 | 38 (100.0%) | 0 (0.0%) |
| 6 to 18 Years | 65 (63.1%) | 32 (31.1%) |
| 19 to 25 Years | 4 (8.0%) | 43 (86.0%) |
| 25 to 34 Years | 9 (20.9%) | 30 (69.8%) |
| 35 to 44 Years | 1 (1.2%) | 45 (55.6%) |
| 45 to 54 Years | 1 (2.5%) | 33 (82.5%) |
| 55 to 64 Years | 22 (35.5%) | 36 (58.1%) |
| 65 to 74 Years | 35 (100.0%) | 17 (48.6%) |
| 75 Years and over | 55 (100.0%) | 21 (38.2%) |
| Total | 230 (45.4%) | 257 (50.7%) |
Disability Status by Sex by Age in Byromville
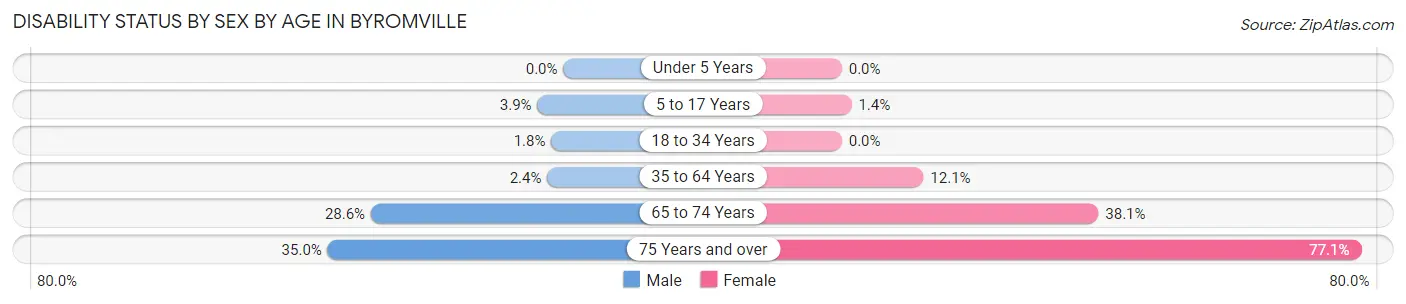
| Age Bracket | Male | Female |
| Under 5 Years | 0 (0.0%) | 0 (0.0%) |
| 5 to 17 Years | 1 (3.8%) | 1 (1.4%) |
| 18 to 34 Years | 1 (1.8%) | 0 (0.0%) |
| 35 to 64 Years | 2 (2.4%) | 12 (12.1%) |
| 65 to 74 Years | 4 (28.6%) | 8 (38.1%) |
| 75 Years and over | 7 (35.0%) | 27 (77.1%) |
Disability Class by Sex by Age in Byromville
Disability Class: Hearing Difficulty
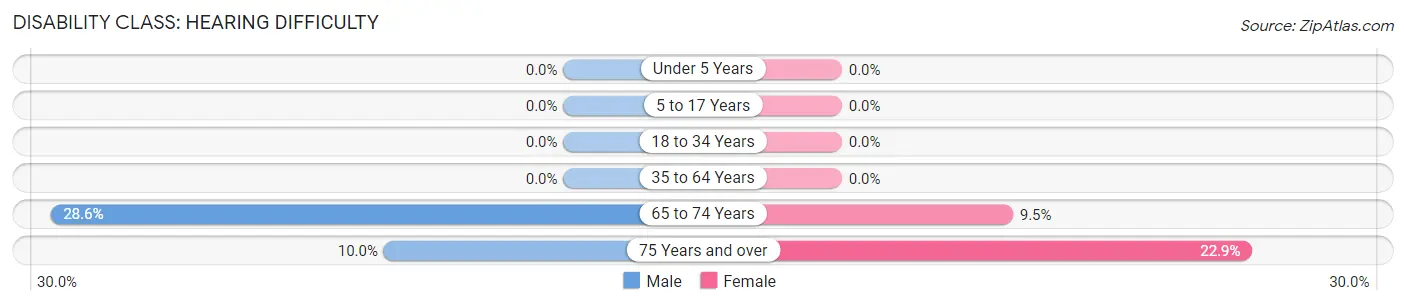
| Age Bracket | Male | Female |
| Under 5 Years | 0 (0.0%) | 0 (0.0%) |
| 5 to 17 Years | 0 (0.0%) | 0 (0.0%) |
| 18 to 34 Years | 0 (0.0%) | 0 (0.0%) |
| 35 to 64 Years | 0 (0.0%) | 0 (0.0%) |
| 65 to 74 Years | 4 (28.6%) | 2 (9.5%) |
| 75 Years and over | 2 (10.0%) | 8 (22.9%) |
Disability Class: Vision Difficulty
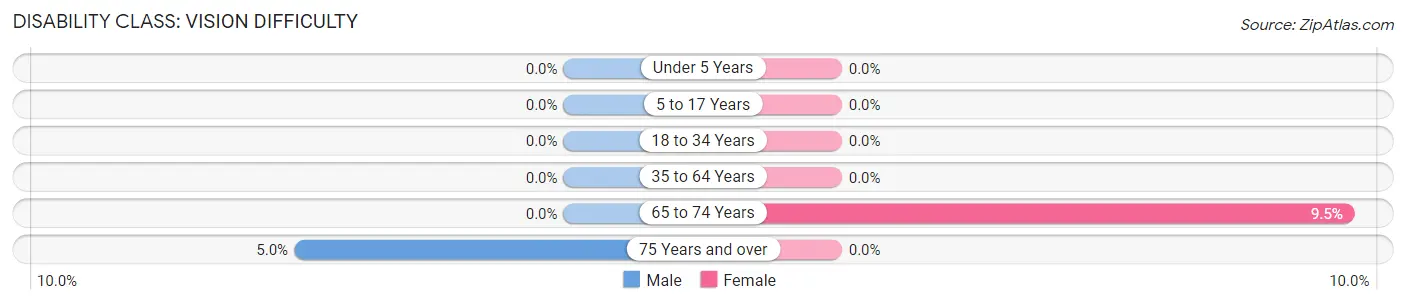
| Age Bracket | Male | Female |
| Under 5 Years | 0 (0.0%) | 0 (0.0%) |
| 5 to 17 Years | 0 (0.0%) | 0 (0.0%) |
| 18 to 34 Years | 0 (0.0%) | 0 (0.0%) |
| 35 to 64 Years | 0 (0.0%) | 0 (0.0%) |
| 65 to 74 Years | 0 (0.0%) | 2 (9.5%) |
| 75 Years and over | 1 (5.0%) | 0 (0.0%) |
Disability Class: Cognitive Difficulty
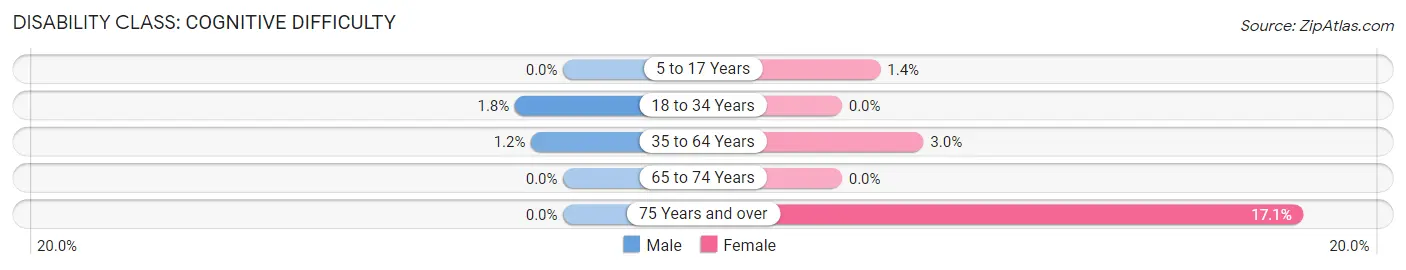
| Age Bracket | Male | Female |
| 5 to 17 Years | 0 (0.0%) | 1 (1.4%) |
| 18 to 34 Years | 1 (1.8%) | 0 (0.0%) |
| 35 to 64 Years | 1 (1.2%) | 3 (3.0%) |
| 65 to 74 Years | 0 (0.0%) | 0 (0.0%) |
| 75 Years and over | 0 (0.0%) | 6 (17.1%) |
Disability Class: Ambulatory Difficulty
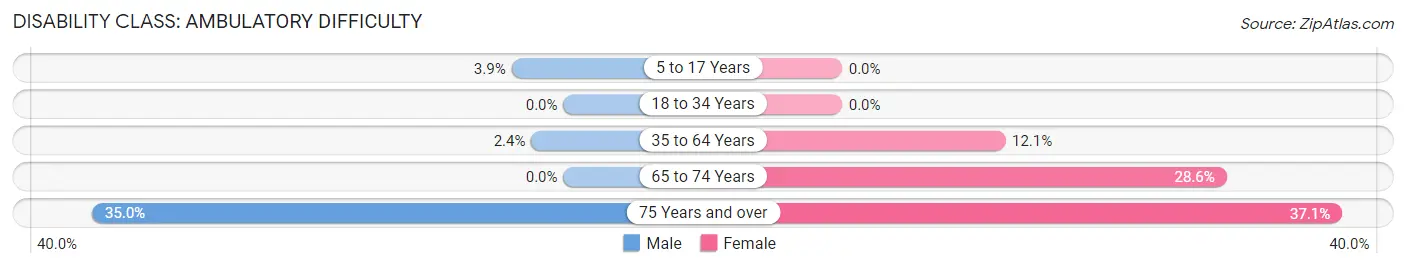
| Age Bracket | Male | Female |
| 5 to 17 Years | 1 (3.8%) | 0 (0.0%) |
| 18 to 34 Years | 0 (0.0%) | 0 (0.0%) |
| 35 to 64 Years | 2 (2.4%) | 12 (12.1%) |
| 65 to 74 Years | 0 (0.0%) | 6 (28.6%) |
| 75 Years and over | 7 (35.0%) | 13 (37.1%) |
Disability Class: Self-Care Difficulty
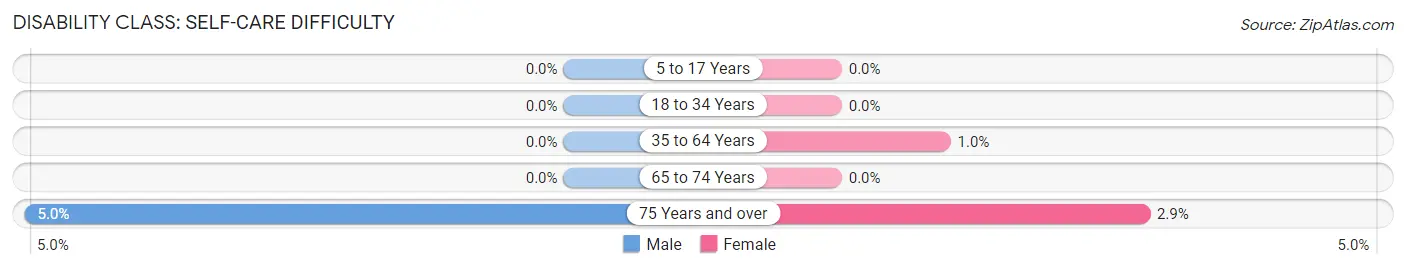
| Age Bracket | Male | Female |
| 5 to 17 Years | 0 (0.0%) | 0 (0.0%) |
| 18 to 34 Years | 0 (0.0%) | 0 (0.0%) |
| 35 to 64 Years | 0 (0.0%) | 1 (1.0%) |
| 65 to 74 Years | 0 (0.0%) | 0 (0.0%) |
| 75 Years and over | 1 (5.0%) | 1 (2.9%) |
Technology Access in Byromville
Computing Device Access in Byromville
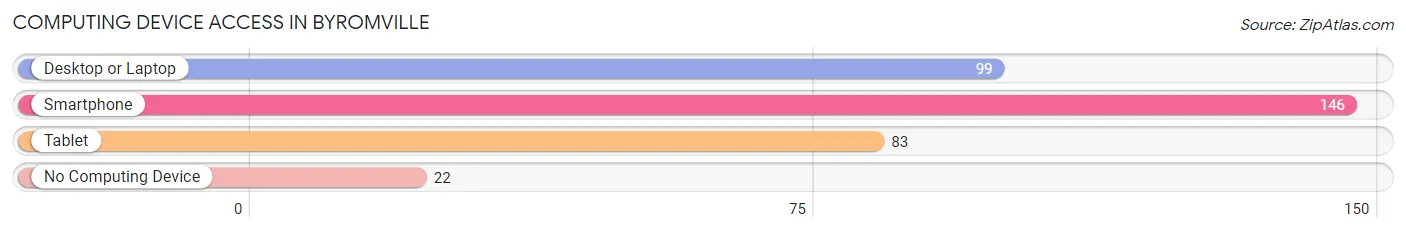
| Device Type | # Households | % Households |
| Desktop or Laptop | 99 | 56.6% |
| Smartphone | 146 | 83.4% |
| Tablet | 83 | 47.4% |
| No Computing Device | 22 | 12.6% |
| Total | 175 | 100.0% |
Internet Access in Byromville
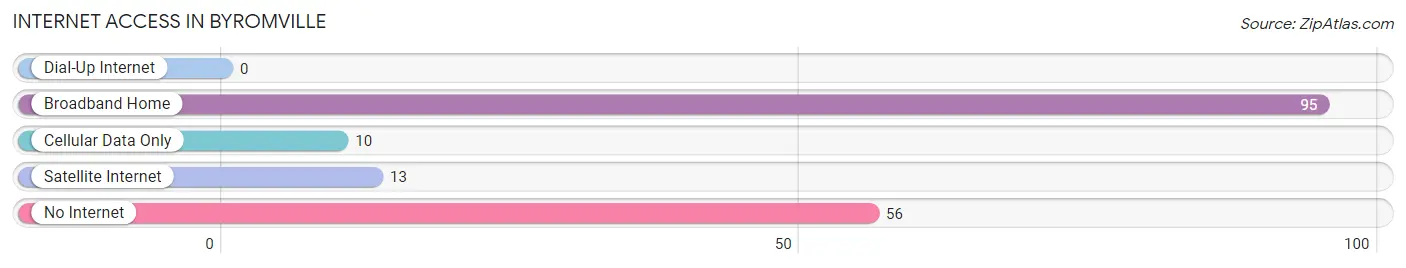
| Internet Type | # Households | % Households |
| Dial-Up Internet | 0 | 0.0% |
| Broadband Home | 95 | 54.3% |
| Cellular Data Only | 10 | 5.7% |
| Satellite Internet | 13 | 7.4% |
| No Internet | 56 | 32.0% |
| Total | 175 | 100.0% |
Byromville Summary
Byromville, Georgia is a small town located in Dooly County, Georgia. It is situated about halfway between Macon and Albany, and is approximately 30 miles from both cities. The town was founded in 1854 and named after the Byrom family, who were early settlers in the area. The population of Byromville was estimated to be 545 in 2019.
Geography
Byromville is located in the southeastern part of Dooly County, Georgia. It is situated on the banks of the Flint River, which is a major tributary of the Chattahoochee River. The town is surrounded by rolling hills and farmland, and is located in the Piedmont region of the state. The climate in Byromville is humid subtropical, with hot summers and mild winters.
Economy
The economy of Byromville is largely based on agriculture. The town is home to several farms, which produce a variety of crops, including cotton, corn, soybeans, and peanuts. The town also has a few small businesses, including a grocery store, a hardware store, and a few restaurants.
Demographics
As of the 2010 census, the population of Byromville was 545, with a racial makeup of 79.3% White, 18.2% African American, 0.7% Native American, 0.2% Asian, and 1.6% from other races. The median household income was $30,938, and the median age was 37.7 years.
History
Byromville was founded in 1854 by the Byrom family, who were early settlers in the area. The town was named after the family, and was originally known as Byrom’s Crossroads. The town was incorporated in 1872, and the first post office was established in 1873.
In the late 19th century, Byromville was a thriving agricultural center, with several cotton gins and a sawmill. The town also had a hotel, a bank, and several stores. In the early 20th century, the town began to decline, as the railroad bypassed it and the population began to move away.
Today, Byromville is a small, rural town with a population of just over 500. The town is still largely agricultural, and is home to several farms. The town also has a few small businesses, including a grocery store, a hardware store, and a few restaurants.
Byromville is a small, rural town with a rich history and a strong sense of community. The town is home to a variety of businesses and farms, and is a great place to live and work. The town is also home to a variety of recreational activities, including fishing, hunting, and camping. Byromville is a great place to visit, and is a great place to call home.
Common Questions
What is Per Capita Income in Byromville?
Per Capita income in Byromville is $25,300.
What is the Median Family Income in Byromville?
Median Family Income in Byromville is $62,250.
What is the Median Household income in Byromville?
Median Household Income in Byromville is $48,603.
What is Income or Wage Gap in Byromville?
Income or Wage Gap in Byromville is 3.9%.
Women in Byromville earn 96.1 cents for every dollar earned by a man.
What is Family Income Deficit in Byromville?
Family Income Deficit in Byromville is $5,580.
Families that are below poverty line in Byromville earn $5,580 less on average than the poverty threshold level.
What is Inequality or Gini Index in Byromville?
Inequality or Gini Index in Byromville is 0.48.
What is the Total Population of Byromville?
Total Population of Byromville is 583.
What is the Total Male Population of Byromville?
Total Male Population of Byromville is 268.
What is the Total Female Population of Byromville?
Total Female Population of Byromville is 315.
What is the Ratio of Males per 100 Females in Byromville?
There are 85.08 Males per 100 Females in Byromville.
What is the Ratio of Females per 100 Males in Byromville?
There are 117.54 Females per 100 Males in Byromville.
What is the Median Population Age in Byromville?
Median Population Age in Byromville is 42.3 Years.
What is the Average Family Size in Byromville
Average Family Size in Byromville is 3.5 People.
What is the Average Household Size in Byromville
Average Household Size in Byromville is 2.9 People.
How Large is the Labor Force in Byromville?
There are 230 People in the Labor Forcein in Byromville.
What is the Percentage of People in the Labor Force in Byromville?
48.7% of People are in the Labor Force in Byromville.
What is the Unemployment Rate in Byromville?
Unemployment Rate in Byromville is 0.4%.