Meansville, GA Map & Demographics
Meansville Map
Meansville Overview
$30,939
PER CAPITA INCOME
$51,250
AVG FAMILY INCOME
$43,750
AVG HOUSEHOLD INCOME
29.7%
WAGE / INCOME GAP [ % ]
70.3¢/ $1
WAGE / INCOME GAP [ $ ]
0.41
INEQUALITY / GINI INDEX
239
TOTAL POPULATION
107
MALE POPULATION
132
FEMALE POPULATION
81.06
MALES / 100 FEMALES
123.36
FEMALES / 100 MALES
44.4
MEDIAN AGE
2.7
AVG FAMILY SIZE
2.4
AVG HOUSEHOLD SIZE
107
LABOR FORCE [ PEOPLE ]
52.2%
PERCENT IN LABOR FORCE
20.6%
UNEMPLOYMENT RATE
Meansville Zip Codes
Income in Meansville
Income Overview in Meansville
Per Capita Income in Meansville is $30,939, while median incomes of families and households are $51,250 and $43,750 respectively.
| Characteristic | Number | Measure |
| Per Capita Income | 239 | $30,939 |
| Median Family Income | 80 | $51,250 |
| Mean Family Income | 80 | $81,370 |
| Median Household Income | 100 | $43,750 |
| Mean Household Income | 100 | $75,095 |
| Income Deficit | 80 | $0 |
| Wage / Income Gap (%) | 239 | 29.67% |
| Wage / Income Gap ($) | 239 | 70.33¢ per $1 |
| Gini / Inequality Index | 239 | 0.41 |
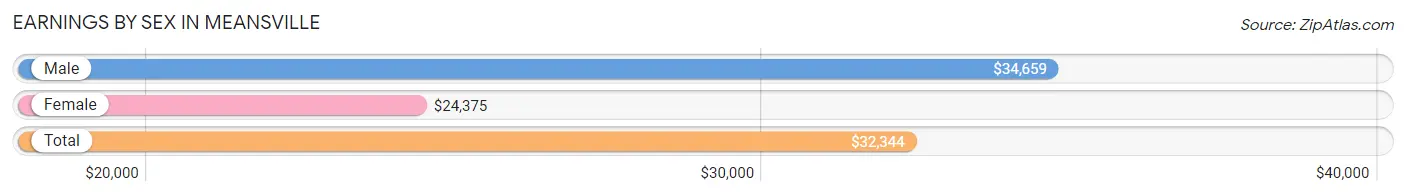
Earnings by Sex in Meansville
Average Earnings in Meansville are $32,344, $34,659 for men and $24,375 for women, a difference of 29.7%.
| Sex | Number | Average Earnings |
| Male | 53 (46.5%) | $34,659 |
| Female | 61 (53.5%) | $24,375 |
| Total | 114 (100.0%) | $32,344 |
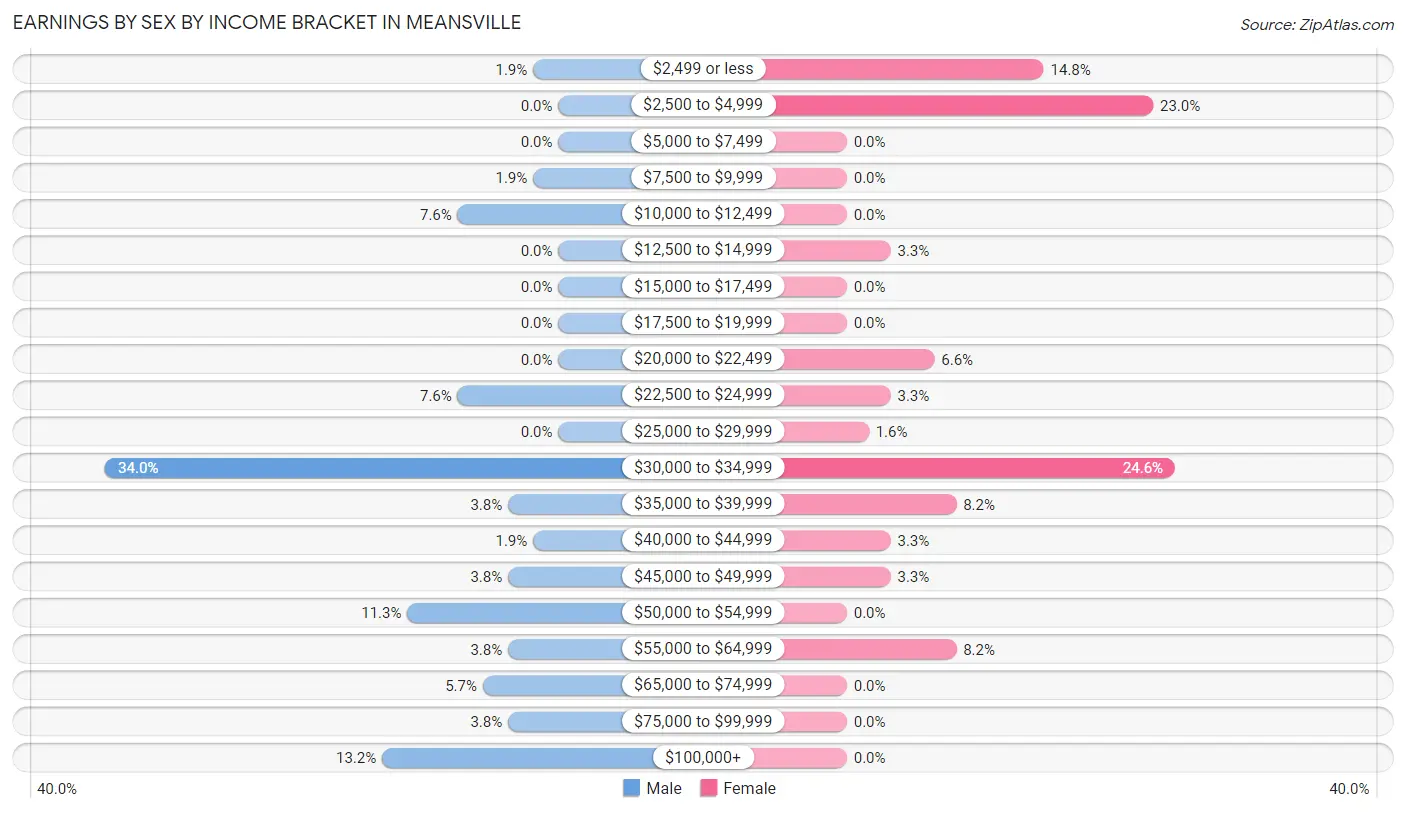
Earnings by Sex by Income Bracket in Meansville
The most common earnings brackets in Meansville are $30,000 to $34,999 for men (18 | 34.0%) and $30,000 to $34,999 for women (15 | 24.6%).
| Income | Male | Female |
| $2,499 or less | 1 (1.9%) | 9 (14.7%) |
| $2,500 to $4,999 | 0 (0.0%) | 14 (23.0%) |
| $5,000 to $7,499 | 0 (0.0%) | 0 (0.0%) |
| $7,500 to $9,999 | 1 (1.9%) | 0 (0.0%) |
| $10,000 to $12,499 | 4 (7.5%) | 0 (0.0%) |
| $12,500 to $14,999 | 0 (0.0%) | 2 (3.3%) |
| $15,000 to $17,499 | 0 (0.0%) | 0 (0.0%) |
| $17,500 to $19,999 | 0 (0.0%) | 0 (0.0%) |
| $20,000 to $22,499 | 0 (0.0%) | 4 (6.6%) |
| $22,500 to $24,999 | 4 (7.5%) | 2 (3.3%) |
| $25,000 to $29,999 | 0 (0.0%) | 1 (1.6%) |
| $30,000 to $34,999 | 18 (34.0%) | 15 (24.6%) |
| $35,000 to $39,999 | 2 (3.8%) | 5 (8.2%) |
| $40,000 to $44,999 | 1 (1.9%) | 2 (3.3%) |
| $45,000 to $49,999 | 2 (3.8%) | 2 (3.3%) |
| $50,000 to $54,999 | 6 (11.3%) | 0 (0.0%) |
| $55,000 to $64,999 | 2 (3.8%) | 5 (8.2%) |
| $65,000 to $74,999 | 3 (5.7%) | 0 (0.0%) |
| $75,000 to $99,999 | 2 (3.8%) | 0 (0.0%) |
| $100,000+ | 7 (13.2%) | 0 (0.0%) |
| Total | 53 (100.0%) | 61 (100.0%) |
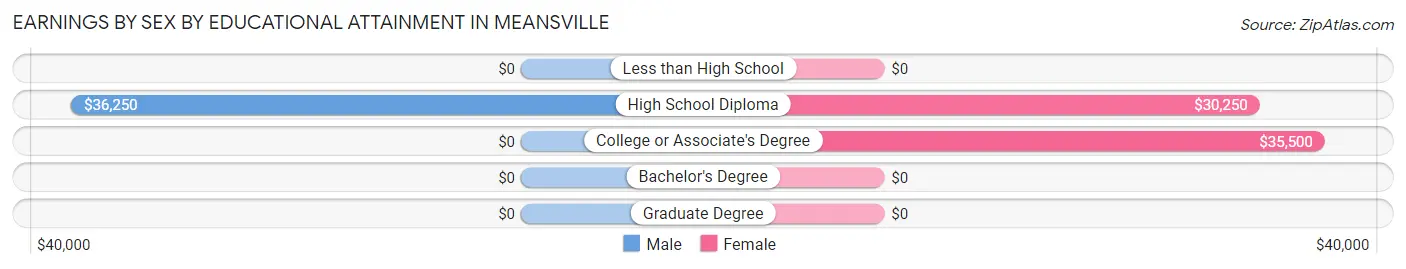
Earnings by Sex by Educational Attainment in Meansville
Average earnings in Meansville are $38,750 for men and $30,417 for women, a difference of 21.5%. Men with an educational attainment of high school diploma enjoy the highest average annual earnings of $36,250, while those with high school diploma education earn the least with $36,250. Women with an educational attainment of college or associate's degree earn the most with the average annual earnings of $35,500, while those with high school diploma education have the smallest earnings of $30,250.
| Educational Attainment | Male Income | Female Income |
| Less than High School | - | - |
| High School Diploma | $36,250 | $30,250 |
| College or Associate's Degree | - | - |
| Bachelor's Degree | - | - |
| Graduate Degree | - | - |
| Total | $38,750 | $30,417 |
Family Income in Meansville
Family Income Brackets in Meansville
According to the Meansville family income data, there are 22 families falling into the $35,000 to $49,999 income range, which is the most common income bracket and makes up 27.5% of all families.
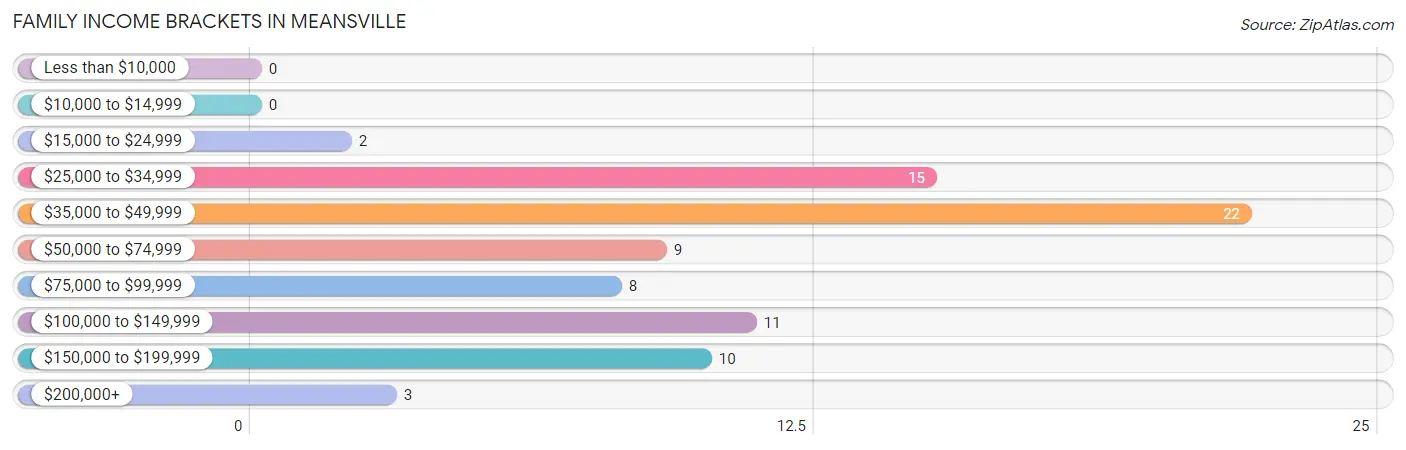
| Income Bracket | # Families | % Families |
| Less than $10,000 | 0 | 0.0% |
| $10,000 to $14,999 | 0 | 0.0% |
| $15,000 to $24,999 | 2 | 2.5% |
| $25,000 to $34,999 | 15 | 18.8% |
| $35,000 to $49,999 | 22 | 27.5% |
| $50,000 to $74,999 | 9 | 11.3% |
| $75,000 to $99,999 | 8 | 10.0% |
| $100,000 to $149,999 | 11 | 13.8% |
| $150,000 to $199,999 | 10 | 12.5% |
| $200,000+ | 3 | 3.8% |
Family Income by Famaliy Size in Meansville
3-person families (17 | 21.2%) account for the highest median family income in Meansville with $105,250 per family, while 3-person families (17 | 21.2%) have the highest median income of $35,083 per family member.
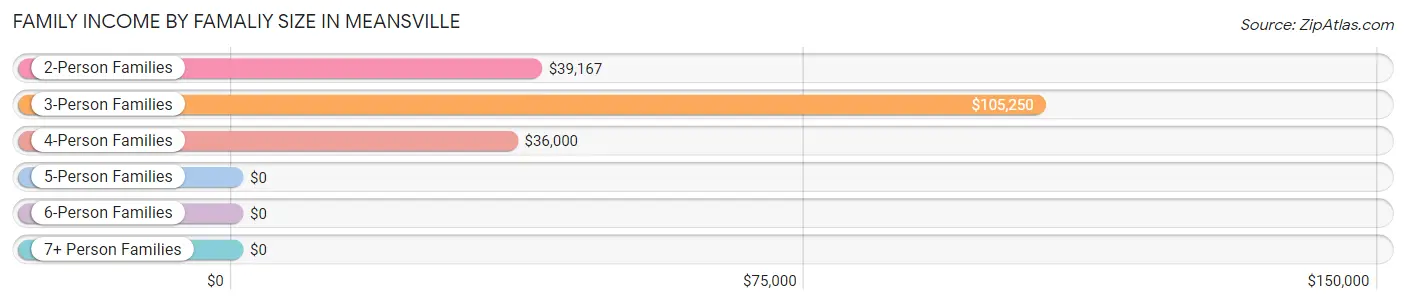
| Income Bracket | # Families | Median Income |
| 2-Person Families | 52 (65.0%) | $39,167 |
| 3-Person Families | 17 (21.2%) | $105,250 |
| 4-Person Families | 8 (10.0%) | $36,000 |
| 5-Person Families | 1 (1.3%) | $0 |
| 6-Person Families | 0 (0.0%) | $0 |
| 7+ Person Families | 2 (2.5%) | $0 |
| Total | 80 (100.0%) | $51,250 |
Family Income by Number of Earners in Meansville
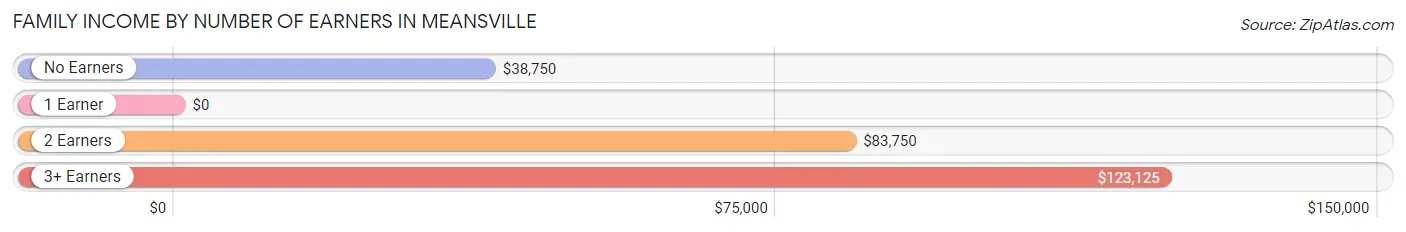
| Number of Earners | # Families | Median Income |
| No Earners | 19 (23.7%) | $38,750 |
| 1 Earner | 30 (37.5%) | $0 |
| 2 Earners | 22 (27.5%) | $83,750 |
| 3+ Earners | 9 (11.3%) | $123,125 |
| Total | 80 (100.0%) | $51,250 |
Household Income in Meansville
Household Income Brackets in Meansville
With 22 households falling in the category, the $35,000 to $49,999 income range is the most frequent in Meansville, accounting for 22.0% of all households.
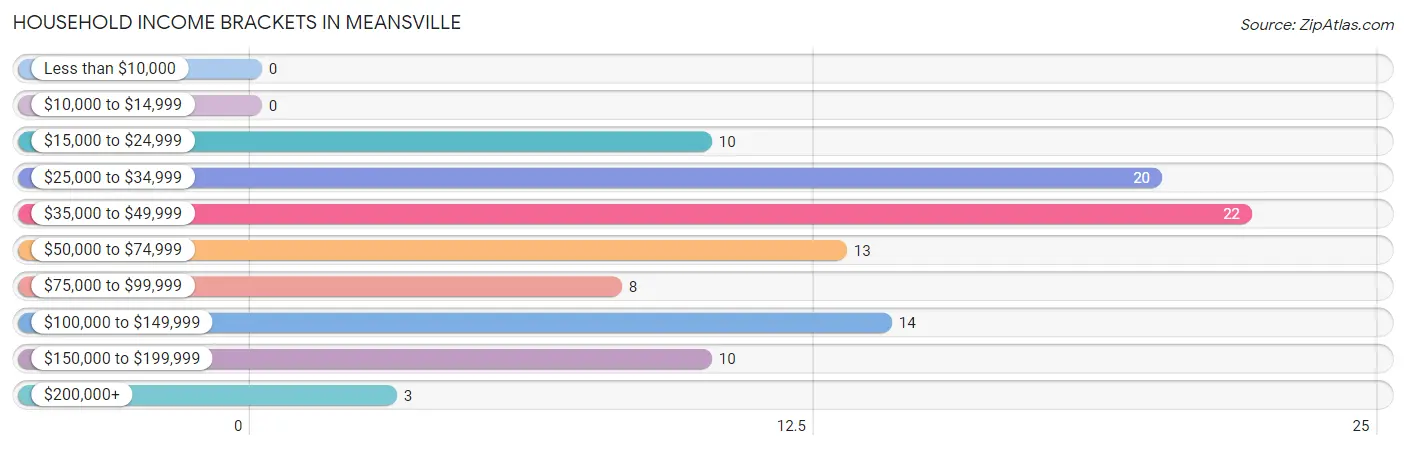
| Income Bracket | # Households | % Households |
| Less than $10,000 | 0 | 0.0% |
| $10,000 to $14,999 | 0 | 0.0% |
| $15,000 to $24,999 | 10 | 10.0% |
| $25,000 to $34,999 | 20 | 20.0% |
| $35,000 to $49,999 | 22 | 22.0% |
| $50,000 to $74,999 | 13 | 13.0% |
| $75,000 to $99,999 | 8 | 8.0% |
| $100,000 to $149,999 | 14 | 14.0% |
| $150,000 to $199,999 | 10 | 10.0% |
| $200,000+ | 3 | 3.0% |
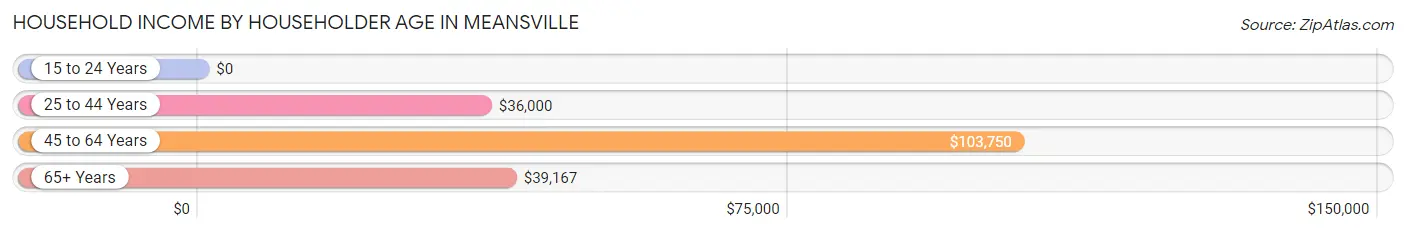
Household Income by Householder Age in Meansville
The median household income in Meansville is $43,750, with the highest median household income of $103,750 found in the 45 to 64 years age bracket for the primary householder. A total of 14 households (14.0%) fall into this category.
| Income Bracket | # Households | Median Income |
| 15 to 24 Years | 0 (0.0%) | $0 |
| 25 to 44 Years | 38 (38.0%) | $36,000 |
| 45 to 64 Years | 14 (14.0%) | $103,750 |
| 65+ Years | 48 (48.0%) | $39,167 |
| Total | 100 (100.0%) | $43,750 |
Poverty in Meansville
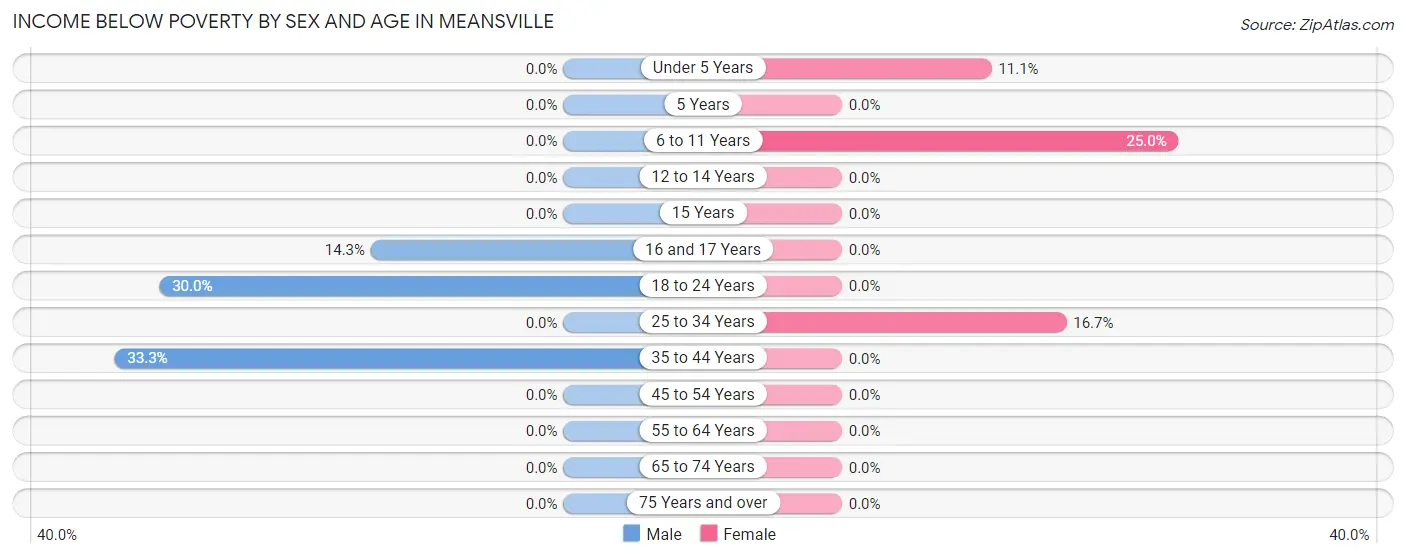
Income Below Poverty by Sex and Age in Meansville
With 6.5% poverty level for males and 3.8% for females among the residents of Meansville, 35 to 44 year old males and 6 to 11 year old females are the most vulnerable to poverty, with 3 males (33.3%) and 2 females (25.0%) in their respective age groups living below the poverty level.
| Age Bracket | Male | Female |
| Under 5 Years | 0 (0.0%) | 1 (11.1%) |
| 5 Years | 0 (0.0%) | 0 (0.0%) |
| 6 to 11 Years | 0 (0.0%) | 2 (25.0%) |
| 12 to 14 Years | 0 (0.0%) | 0 (0.0%) |
| 15 Years | 0 (0.0%) | 0 (0.0%) |
| 16 and 17 Years | 1 (14.3%) | 0 (0.0%) |
| 18 to 24 Years | 3 (30.0%) | 0 (0.0%) |
| 25 to 34 Years | 0 (0.0%) | 2 (16.7%) |
| 35 to 44 Years | 3 (33.3%) | 0 (0.0%) |
| 45 to 54 Years | 0 (0.0%) | 0 (0.0%) |
| 55 to 64 Years | 0 (0.0%) | 0 (0.0%) |
| 65 to 74 Years | 0 (0.0%) | 0 (0.0%) |
| 75 Years and over | 0 (0.0%) | 0 (0.0%) |
| Total | 7 (6.5%) | 5 (3.8%) |
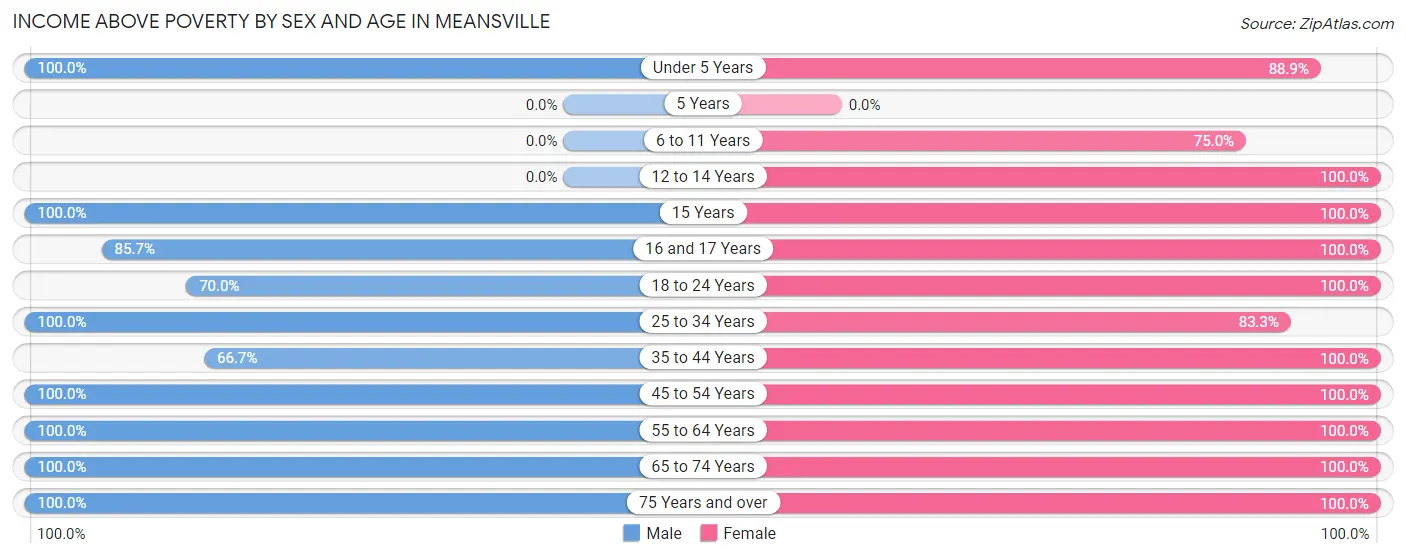
Income Above Poverty by Sex and Age in Meansville
According to the poverty statistics in Meansville, males aged under 5 years and females aged 12 to 14 years are the age groups that are most secure financially, with 100.0% of males and 100.0% of females in these age groups living above the poverty line.
| Age Bracket | Male | Female |
| Under 5 Years | 6 (100.0%) | 8 (88.9%) |
| 5 Years | 0 (0.0%) | 0 (0.0%) |
| 6 to 11 Years | 0 (0.0%) | 6 (75.0%) |
| 12 to 14 Years | 0 (0.0%) | 2 (100.0%) |
| 15 Years | 5 (100.0%) | 4 (100.0%) |
| 16 and 17 Years | 6 (85.7%) | 4 (100.0%) |
| 18 to 24 Years | 7 (70.0%) | 16 (100.0%) |
| 25 to 34 Years | 19 (100.0%) | 10 (83.3%) |
| 35 to 44 Years | 6 (66.7%) | 13 (100.0%) |
| 45 to 54 Years | 7 (100.0%) | 12 (100.0%) |
| 55 to 64 Years | 8 (100.0%) | 6 (100.0%) |
| 65 to 74 Years | 12 (100.0%) | 18 (100.0%) |
| 75 Years and over | 24 (100.0%) | 28 (100.0%) |
| Total | 100 (93.5%) | 127 (96.2%) |
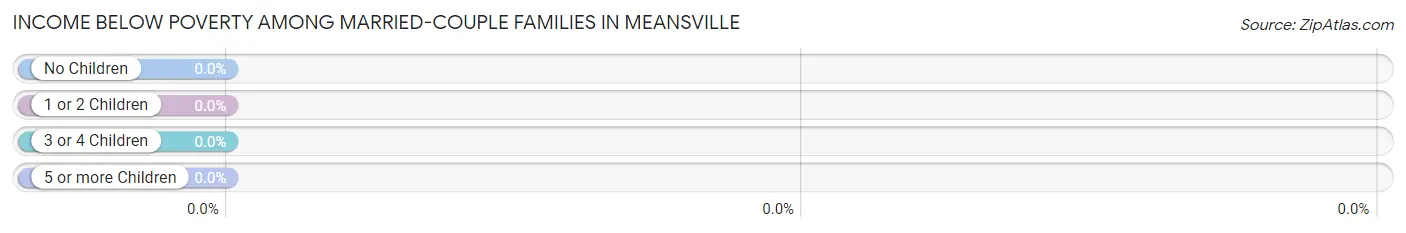
Income Below Poverty Among Married-Couple Families in Meansville
| Children | Above Poverty | Below Poverty |
| No Children | 40 (100.0%) | 0 (0.0%) |
| 1 or 2 Children | 9 (100.0%) | 0 (0.0%) |
| 3 or 4 Children | 2 (100.0%) | 0 (0.0%) |
| 5 or more Children | 0 (0.0%) | 0 (0.0%) |
| Total | 51 (100.0%) | 0 (0.0%) |
Income Below Poverty Among Single-Parent Households in Meansville
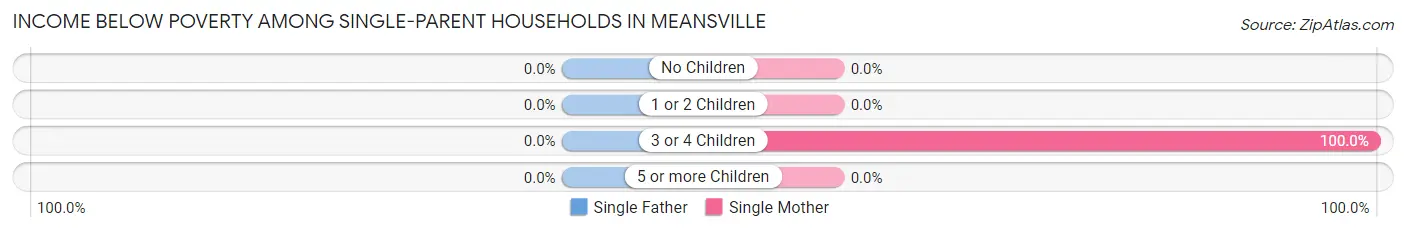
| Children | Single Father | Single Mother |
| No Children | 0 (0.0%) | 0 (0.0%) |
| 1 or 2 Children | 0 (0.0%) | 0 (0.0%) |
| 3 or 4 Children | 0 (0.0%) | 2 (100.0%) |
| 5 or more Children | 0 (0.0%) | 0 (0.0%) |
| Total | 0 (0.0%) | 2 (20.0%) |
Income Below Poverty Among Married-Couple vs Single-Parent Households in Meansville
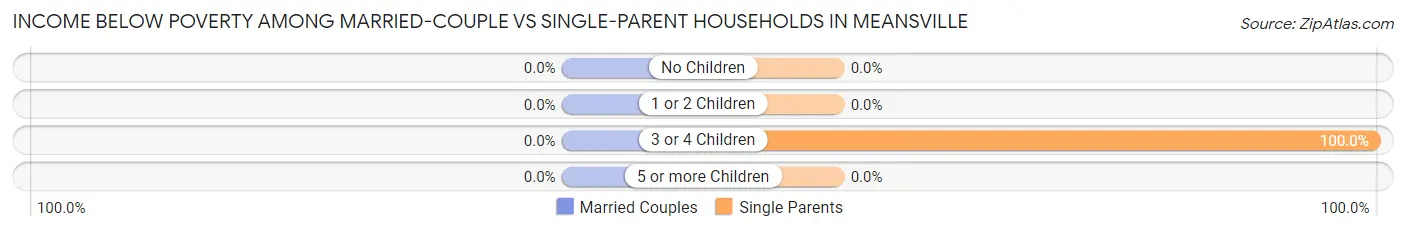
| Children | Married-Couple Families | Single-Parent Households |
| No Children | 0 (0.0%) | 0 (0.0%) |
| 1 or 2 Children | 0 (0.0%) | 0 (0.0%) |
| 3 or 4 Children | 0 (0.0%) | 2 (100.0%) |
| 5 or more Children | 0 (0.0%) | 0 (0.0%) |
| Total | 0 (0.0%) | 2 (6.9%) |
Race in Meansville
The most populous races in Meansville are White / Caucasian (231 | 96.7%), and Black / African American (8 | 3.4%).
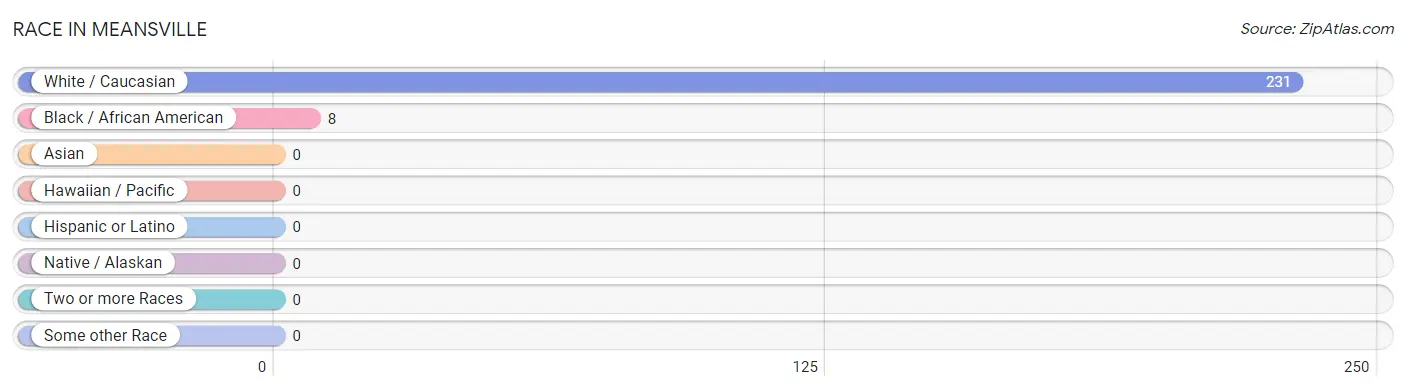
| Race | # Population | % Population |
| Asian | 0 | 0.0% |
| Black / African American | 8 | 3.4% |
| Hawaiian / Pacific | 0 | 0.0% |
| Hispanic or Latino | 0 | 0.0% |
| Native / Alaskan | 0 | 0.0% |
| White / Caucasian | 231 | 96.7% |
| Two or more Races | 0 | 0.0% |
| Some other Race | 0 | 0.0% |
| Total | 239 | 100.0% |
Ancestry in Meansville
The most populous ancestries reported in Meansville are English (55 | 23.0%), American (39 | 16.3%), Irish (36 | 15.1%), German (24 | 10.0%), and Italian (10 | 4.2%), together accounting for 68.6% of all Meansville residents.
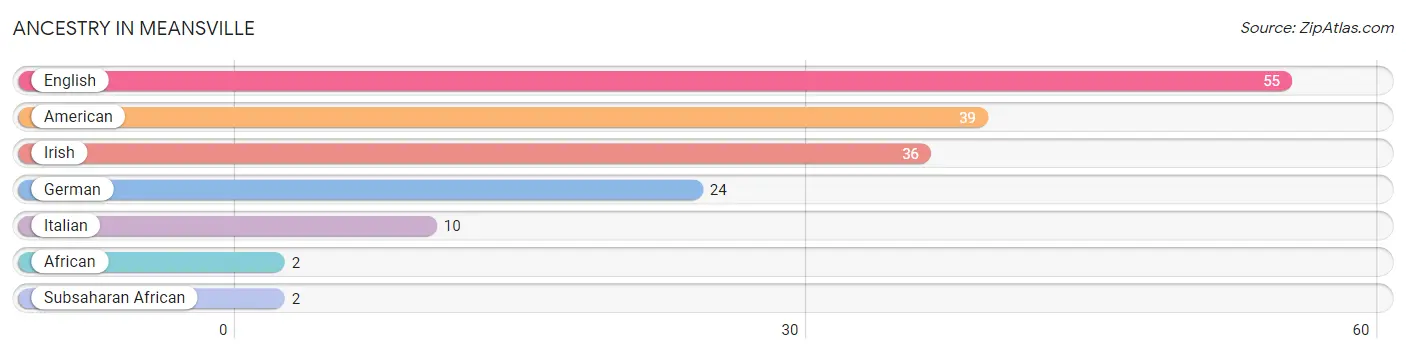
| Ancestry | # Population | % Population |
| African | 2 | 0.8% |
| American | 39 | 16.3% |
| English | 55 | 23.0% |
| German | 24 | 10.0% |
| Irish | 36 | 15.1% |
| Italian | 10 | 4.2% |
| Subsaharan African | 2 | 0.8% | View All 7 Rows |
Immigrants in Meansville

| Immigration Origin | # Population | % Population | View All 0 Rows |
Sex and Age in Meansville
Sex and Age in Meansville
The most populous age groups in Meansville are 30 to 34 Years (19 | 17.8%) for men and 85 Years and over (17 | 12.9%) for women.
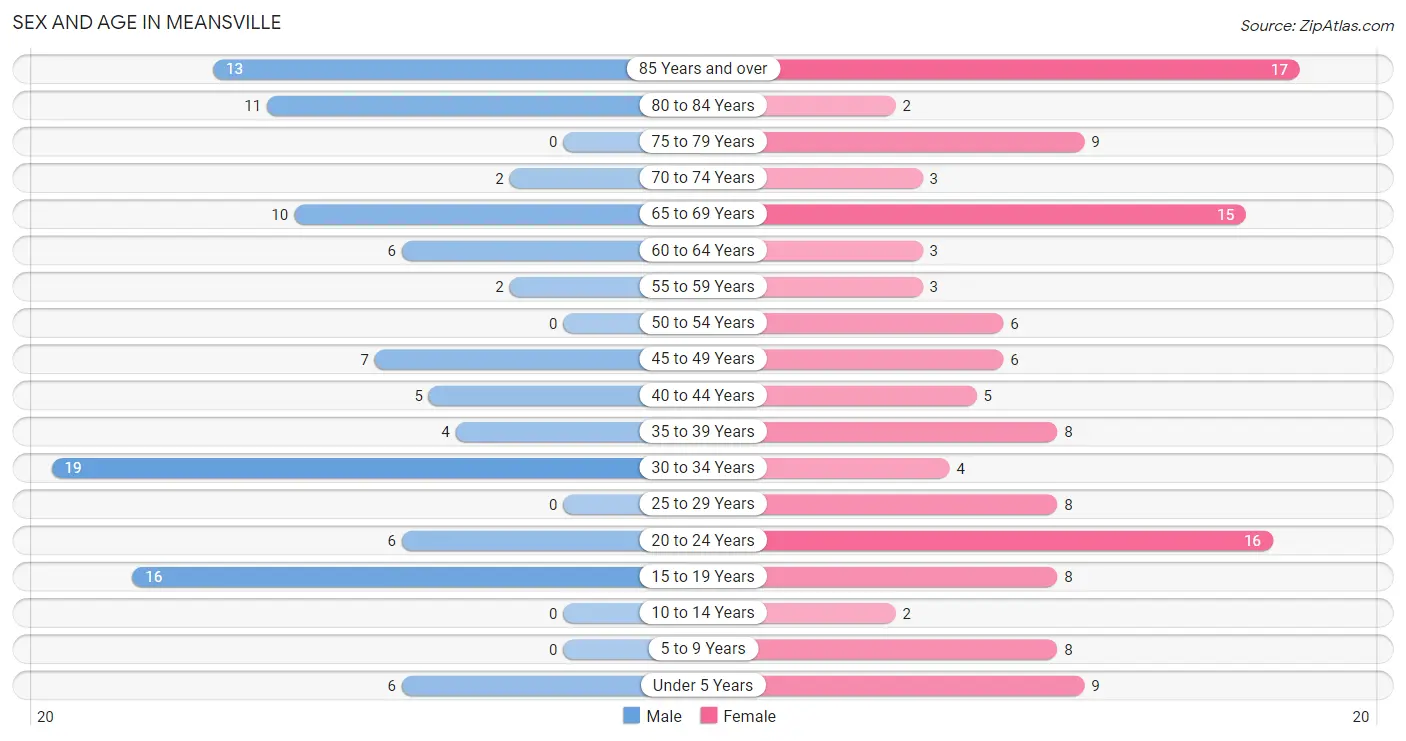
| Age Bracket | Male | Female |
| Under 5 Years | 6 (5.6%) | 9 (6.8%) |
| 5 to 9 Years | 0 (0.0%) | 8 (6.1%) |
| 10 to 14 Years | 0 (0.0%) | 2 (1.5%) |
| 15 to 19 Years | 16 (14.9%) | 8 (6.1%) |
| 20 to 24 Years | 6 (5.6%) | 16 (12.1%) |
| 25 to 29 Years | 0 (0.0%) | 8 (6.1%) |
| 30 to 34 Years | 19 (17.8%) | 4 (3.0%) |
| 35 to 39 Years | 4 (3.7%) | 8 (6.1%) |
| 40 to 44 Years | 5 (4.7%) | 5 (3.8%) |
| 45 to 49 Years | 7 (6.5%) | 6 (4.5%) |
| 50 to 54 Years | 0 (0.0%) | 6 (4.5%) |
| 55 to 59 Years | 2 (1.9%) | 3 (2.3%) |
| 60 to 64 Years | 6 (5.6%) | 3 (2.3%) |
| 65 to 69 Years | 10 (9.3%) | 15 (11.4%) |
| 70 to 74 Years | 2 (1.9%) | 3 (2.3%) |
| 75 to 79 Years | 0 (0.0%) | 9 (6.8%) |
| 80 to 84 Years | 11 (10.3%) | 2 (1.5%) |
| 85 Years and over | 13 (12.1%) | 17 (12.9%) |
| Total | 107 (100.0%) | 132 (100.0%) |
Families and Households in Meansville
Median Family Size in Meansville
The median family size in Meansville is 2.66 persons per family, with single female/mother families (10 | 12.5%) accounting for the largest median family size of 4.4 persons per family. On the other hand, single male/father families (19 | 23.7%) represent the smallest median family size with 1.74 persons per family.
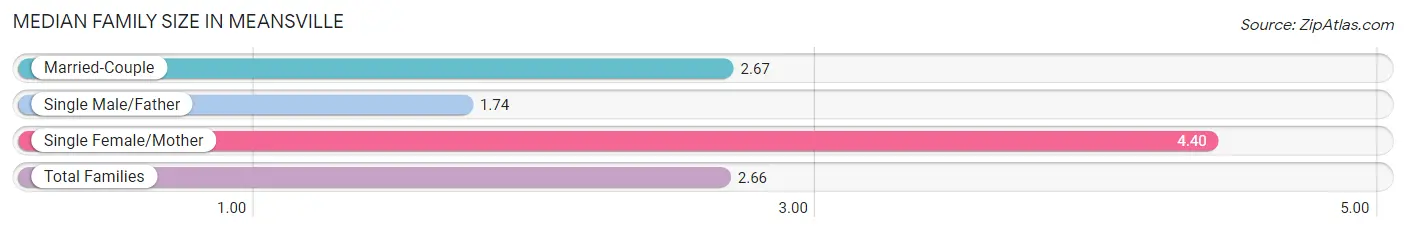
| Family Type | # Families | Family Size |
| Married-Couple | 51 (63.7%) | 2.67 |
| Single Male/Father | 19 (23.7%) | 1.74 |
| Single Female/Mother | 10 (12.5%) | 4.40 |
| Total Families | 80 (100.0%) | 2.66 |
Median Household Size in Meansville
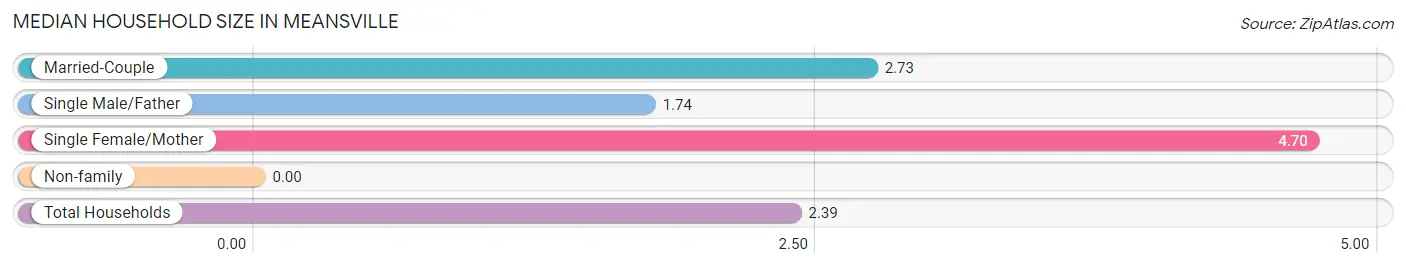
| Household Type | # Households | Household Size |
| Married-Couple | 51 (51.0%) | 2.73 |
| Single Male/Father | 19 (19.0%) | 1.74 |
| Single Female/Mother | 10 (10.0%) | 4.70 |
| Non-family | 20 (20.0%) | - |
| Total Households | 100 (100.0%) | 2.39 |
Household Size by Marriage Status in Meansville
Out of a total of 100 households in Meansville, 80 (80.0%) are family households, while 20 (20.0%) are nonfamily households. The most numerous type of family households are 2-person households, comprising 52, and the most common type of nonfamily households are 1-person households, comprising 20.
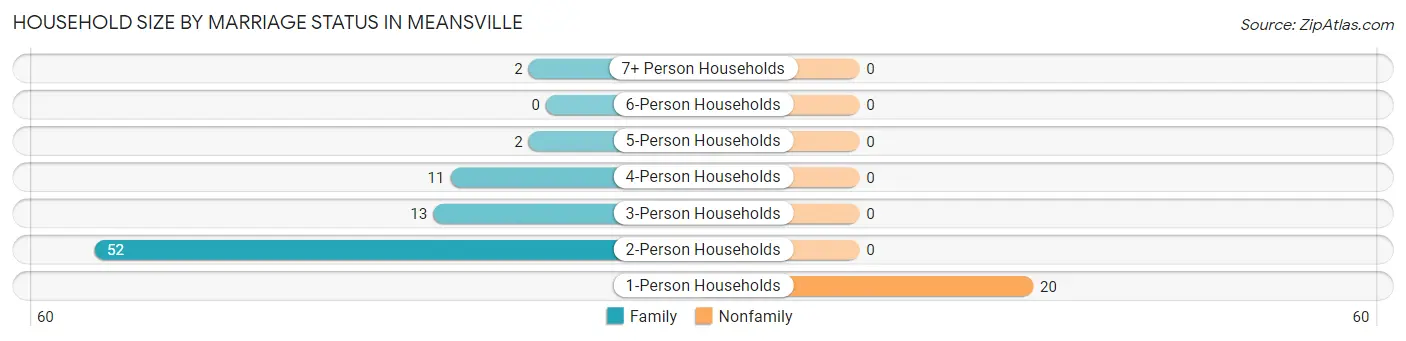
| Household Size | Family Households | Nonfamily Households |
| 1-Person Households | - | 20 (20.0%) |
| 2-Person Households | 52 (52.0%) | 0 (0.0%) |
| 3-Person Households | 13 (13.0%) | 0 (0.0%) |
| 4-Person Households | 11 (11.0%) | 0 (0.0%) |
| 5-Person Households | 2 (2.0%) | 0 (0.0%) |
| 6-Person Households | 0 (0.0%) | 0 (0.0%) |
| 7+ Person Households | 2 (2.0%) | 0 (0.0%) |
| Total | 80 (80.0%) | 20 (20.0%) |
Female Fertility in Meansville
Fertility by Age in Meansville
Average fertility rate in Meansville is 36.0 births per 1,000 women. Women in the age bracket of 20 to 34 years have the highest fertility rate with 71.0 births per 1,000 women. Women in the age bracket of 20 to 34 years acount for 100.0% of all women with births.
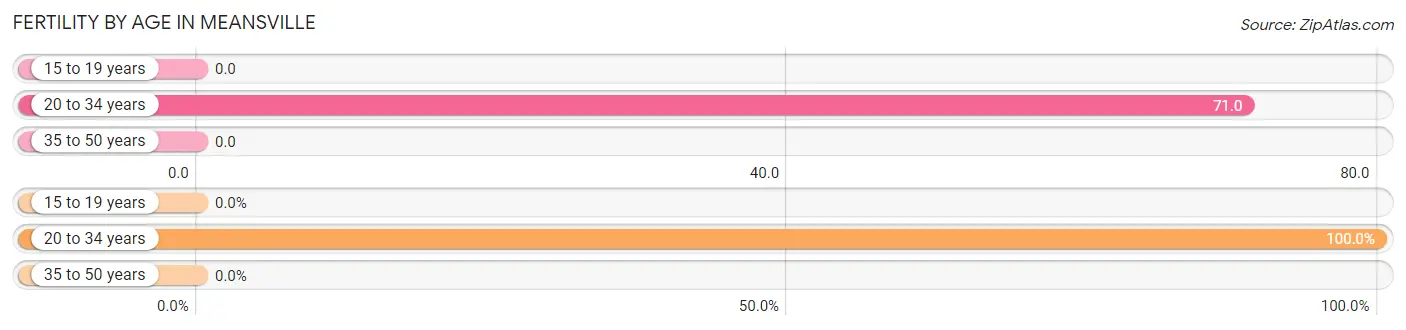
| Age Bracket | Women with Births | Births / 1,000 Women |
| 15 to 19 years | 0 (0.0%) | 0.0 |
| 20 to 34 years | 2 (100.0%) | 71.0 |
| 35 to 50 years | 0 (0.0%) | 0.0 |
| Total | 2 (100.0%) | 36.0 |
Fertility by Age by Marriage Status in Meansville
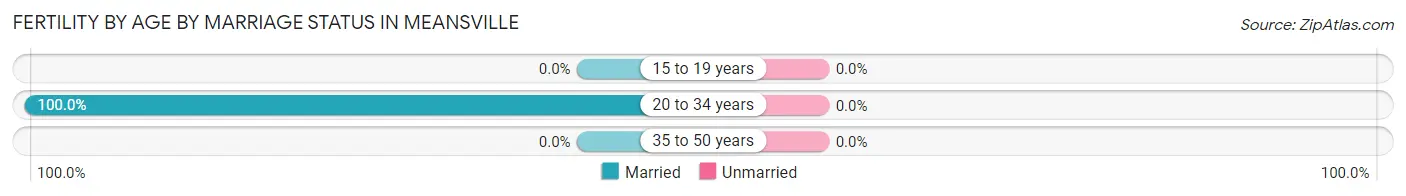
| Age Bracket | Married | Unmarried |
| 15 to 19 years | 0 (0.0%) | 0 (0.0%) |
| 20 to 34 years | 2 (100.0%) | 0 (0.0%) |
| 35 to 50 years | 0 (0.0%) | 0 (0.0%) |
| Total | 2 (100.0%) | 0 (0.0%) |
Fertility by Education in Meansville
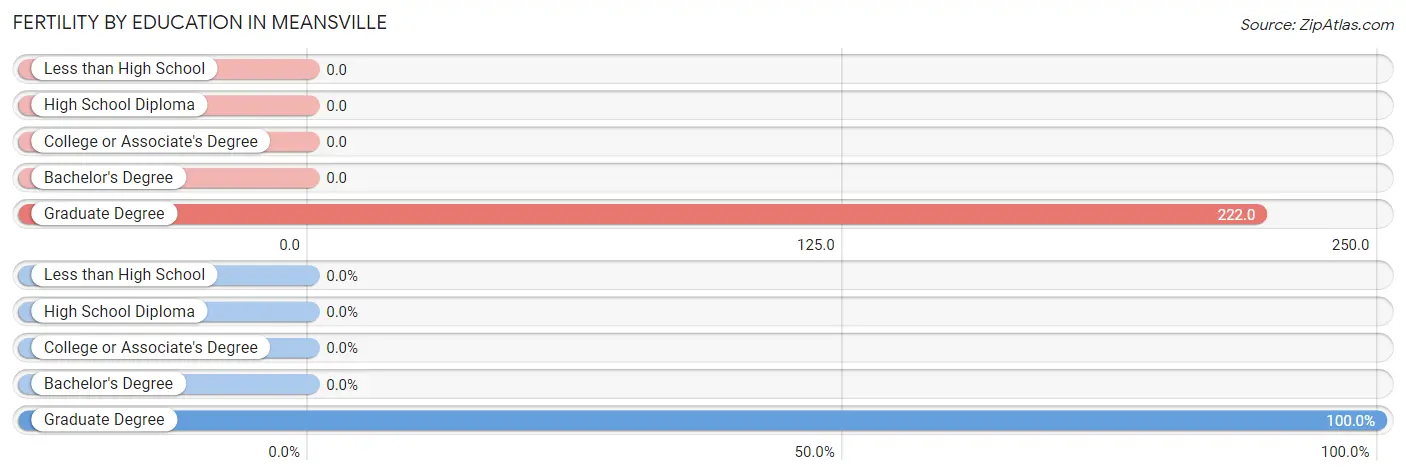
| Educational Attainment | Women with Births | Births / 1,000 Women |
| Less than High School | 0 (0.0%) | 0.0 |
| High School Diploma | 0 (0.0%) | 0.0 |
| College or Associate's Degree | 0 (0.0%) | 0.0 |
| Bachelor's Degree | 0 (0.0%) | 0.0 |
| Graduate Degree | 2 (100.0%) | 222.0 |
| Total | 2 (100.0%) | 36.0 |
Fertility by Education by Marriage Status in Meansville
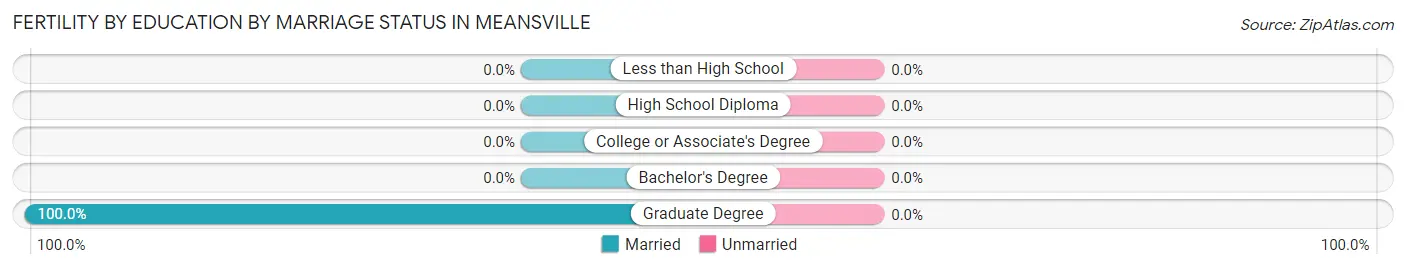
| Educational Attainment | Married | Unmarried |
| Less than High School | 0 (0.0%) | 0 (0.0%) |
| High School Diploma | 0 (0.0%) | 0 (0.0%) |
| College or Associate's Degree | 0 (0.0%) | 0 (0.0%) |
| Bachelor's Degree | 0 (0.0%) | 0 (0.0%) |
| Graduate Degree | 2 (100.0%) | 0 (0.0%) |
| Total | 2 (100.0%) | 0 (0.0%) |
Employment Characteristics in Meansville
Employment by Class of Employer in Meansville
Among the 82 employed individuals in Meansville, private company employees (45 | 54.9%), not-for-profit organizations (14 | 17.1%), and local government employees (13 | 15.9%) make up the most common classes of employment.
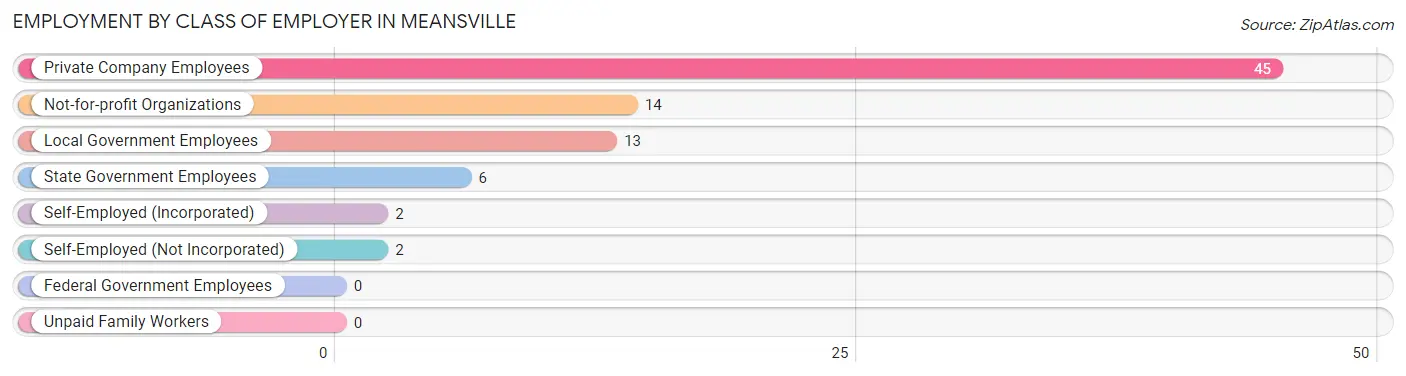
| Employer Class | # Employees | % Employees |
| Private Company Employees | 45 | 54.9% |
| Self-Employed (Incorporated) | 2 | 2.4% |
| Self-Employed (Not Incorporated) | 2 | 2.4% |
| Not-for-profit Organizations | 14 | 17.1% |
| Local Government Employees | 13 | 15.9% |
| State Government Employees | 6 | 7.3% |
| Federal Government Employees | 0 | 0.0% |
| Unpaid Family Workers | 0 | 0.0% |
| Total | 82 | 100.0% |
Employment Status by Age in Meansville
According to the labor force statistics for Meansville, out of the total population over 16 years of age (205), 52.2% or 107 individuals are in the labor force, with 20.6% or 22 of them unemployed. The age group with the highest labor force participation rate is 25 to 29 years, with 100.0% or 8 individuals in the labor force. Within the labor force, the 20 to 24 years age range has the highest percentage of unemployed individuals, with 55.0% or 11 of them being unemployed.
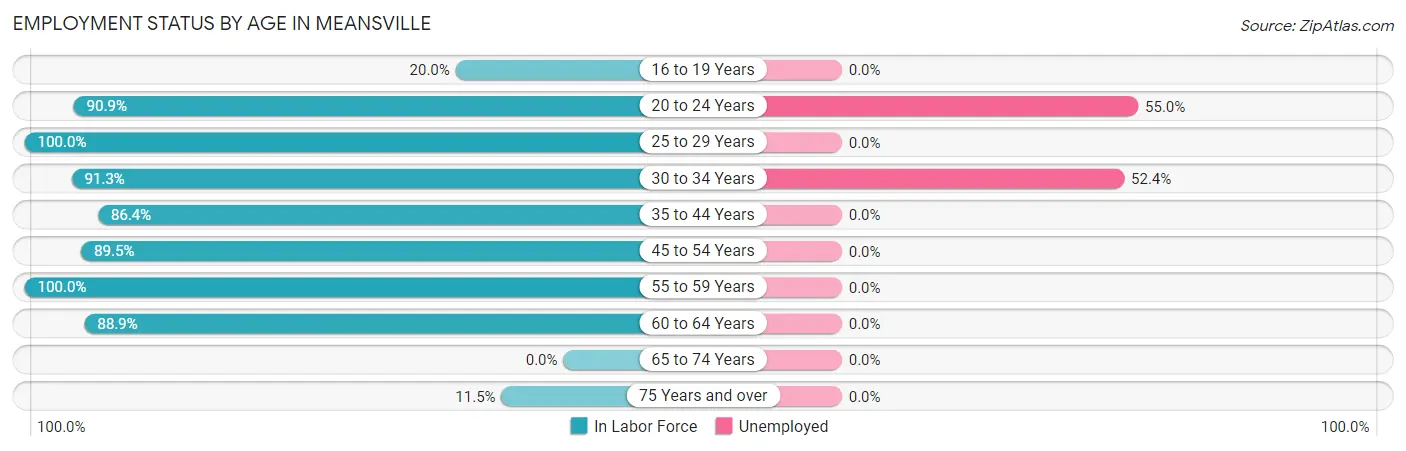
| Age Bracket | In Labor Force | Unemployed |
| 16 to 19 Years | 3 (20.0%) | 0 (0.0%) |
| 20 to 24 Years | 20 (90.9%) | 11 (55.0%) |
| 25 to 29 Years | 8 (100.0%) | 0 (0.0%) |
| 30 to 34 Years | 21 (91.3%) | 11 (52.4%) |
| 35 to 44 Years | 19 (86.4%) | 0 (0.0%) |
| 45 to 54 Years | 17 (89.5%) | 0 (0.0%) |
| 55 to 59 Years | 5 (100.0%) | 0 (0.0%) |
| 60 to 64 Years | 8 (88.9%) | 0 (0.0%) |
| 65 to 74 Years | 0 (0.0%) | 0 (0.0%) |
| 75 Years and over | 6 (11.5%) | 0 (0.0%) |
| Total | 107 (52.2%) | 22 (20.6%) |
Employment Status by Educational Attainment in Meansville
According to labor force statistics for Meansville, 90.7% of individuals (78) out of the total population between 25 and 64 years of age (86) are in the labor force, with 14.1% or 11 of them being unemployed. The group with the highest labor force participation rate are those with the educational attainment of less than high school, with 100.0% or 5 individuals in the labor force. Within the labor force, individuals with college / associate degree education have the highest percentage of unemployment, with 47.8% or 11 of them being unemployed.
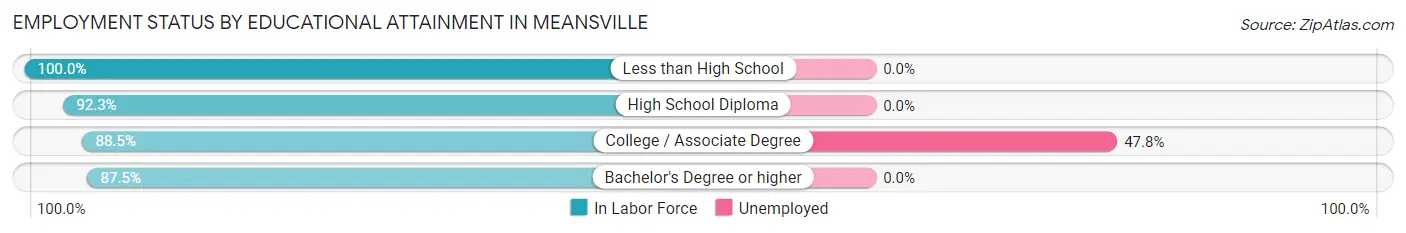
| Educational Attainment | In Labor Force | Unemployed |
| Less than High School | 5 (100.0%) | 0 (0.0%) |
| High School Diploma | 36 (92.3%) | 0 (0.0%) |
| College / Associate Degree | 23 (88.5%) | 12 (47.8%) |
| Bachelor's Degree or higher | 14 (87.5%) | 0 (0.0%) |
| Total | 78 (90.7%) | 12 (14.1%) |
Employment Occupations by Sex in Meansville
Management, Business, Science and Arts Occupations
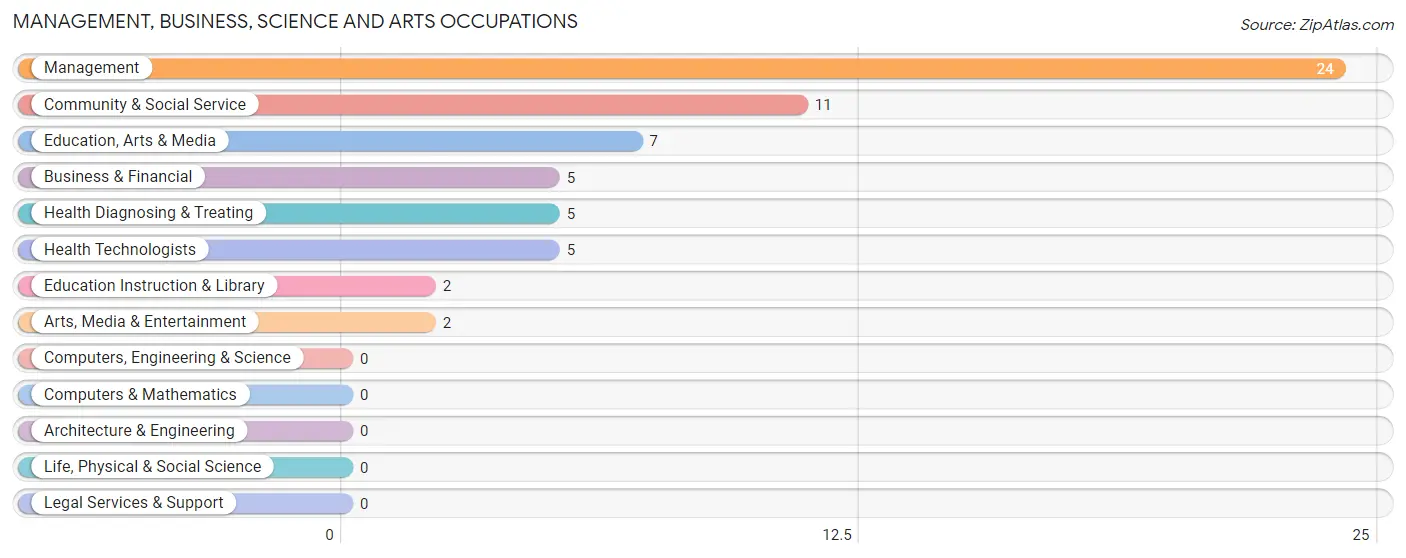
The most common Management, Business, Science and Arts occupations in Meansville are Management (24 | 28.2%), Community & Social Service (11 | 12.9%), Education, Arts & Media (7 | 8.2%), Business & Financial (5 | 5.9%), and Health Diagnosing & Treating (5 | 5.9%).
Management, Business, Science and Arts Occupations by Sex
Within the Management, Business, Science and Arts occupations in Meansville, the most male-oriented occupations are Education, Arts & Media (28.6%), Management (25.0%), and Business & Financial (20.0%), while the most female-oriented occupations are Education Instruction & Library (100.0%), Arts, Media & Entertainment (100.0%), and Health Diagnosing & Treating (100.0%).
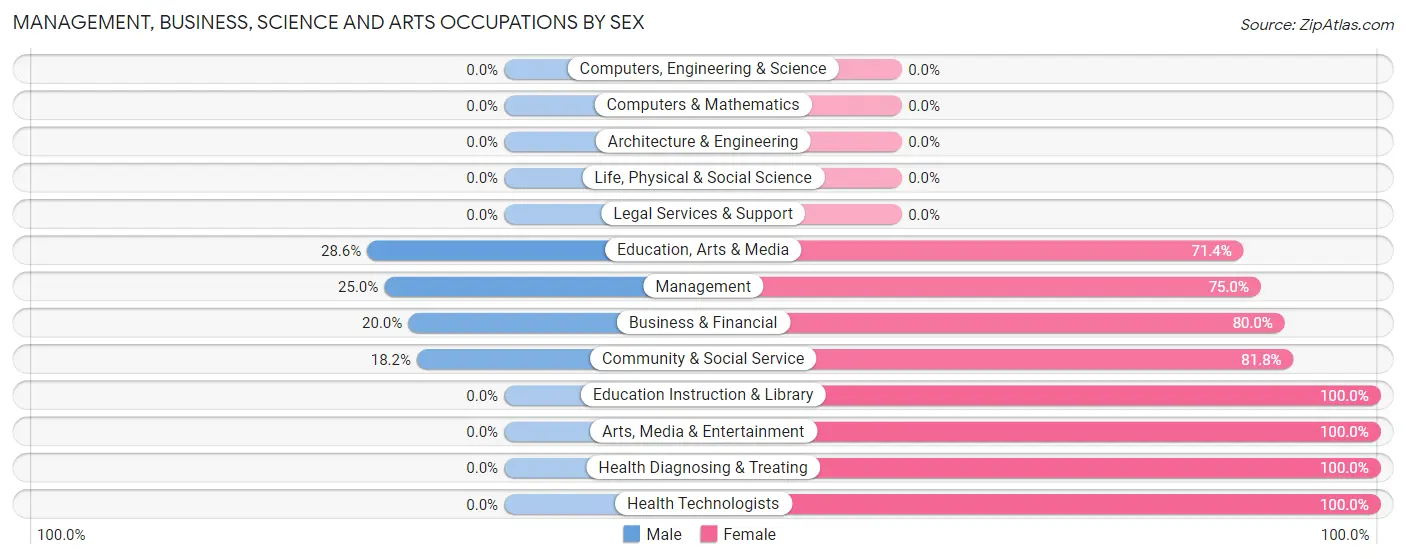
| Occupation | Male | Female |
| Management | 6 (25.0%) | 18 (75.0%) |
| Business & Financial | 1 (20.0%) | 4 (80.0%) |
| Computers, Engineering & Science | 0 (0.0%) | 0 (0.0%) |
| Computers & Mathematics | 0 (0.0%) | 0 (0.0%) |
| Architecture & Engineering | 0 (0.0%) | 0 (0.0%) |
| Life, Physical & Social Science | 0 (0.0%) | 0 (0.0%) |
| Community & Social Service | 2 (18.2%) | 9 (81.8%) |
| Education, Arts & Media | 2 (28.6%) | 5 (71.4%) |
| Legal Services & Support | 0 (0.0%) | 0 (0.0%) |
| Education Instruction & Library | 0 (0.0%) | 2 (100.0%) |
| Arts, Media & Entertainment | 0 (0.0%) | 2 (100.0%) |
| Health Diagnosing & Treating | 0 (0.0%) | 5 (100.0%) |
| Health Technologists | 0 (0.0%) | 5 (100.0%) |
| Total (Category) | 9 (20.0%) | 36 (80.0%) |
| Total (Overall) | 36 (42.3%) | 49 (57.7%) |
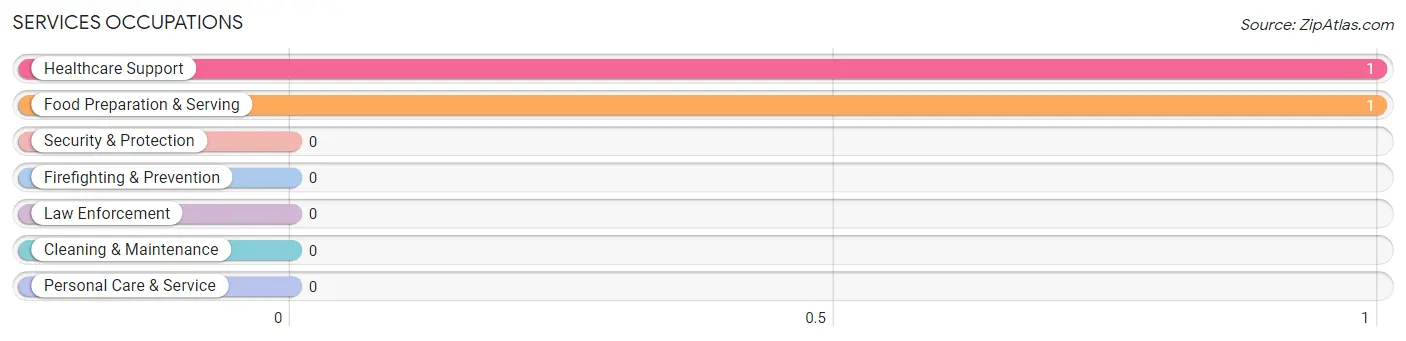
Services Occupations
The most common Services occupations in Meansville are Healthcare Support (1 | 1.2%), and Food Preparation & Serving (1 | 1.2%).
Services Occupations by Sex
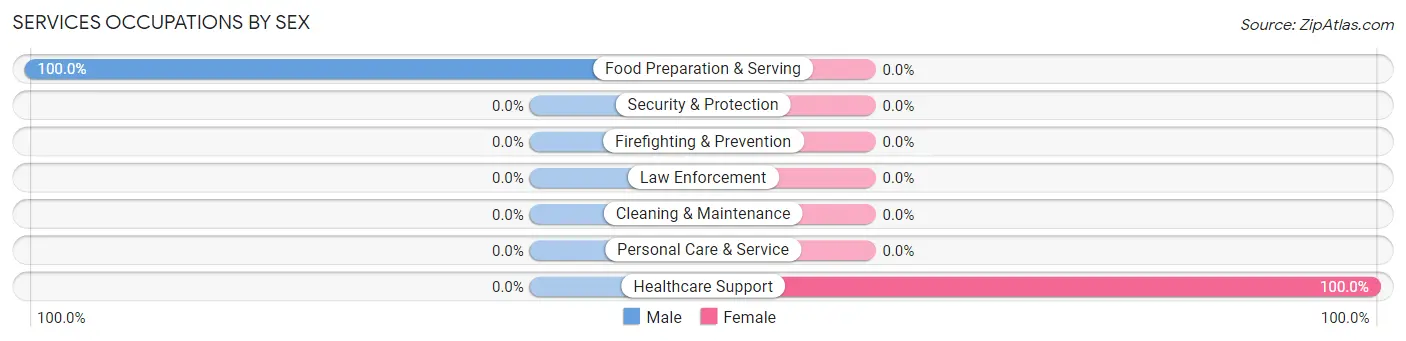
| Occupation | Male | Female |
| Healthcare Support | 0 (0.0%) | 1 (100.0%) |
| Security & Protection | 0 (0.0%) | 0 (0.0%) |
| Firefighting & Prevention | 0 (0.0%) | 0 (0.0%) |
| Law Enforcement | 0 (0.0%) | 0 (0.0%) |
| Food Preparation & Serving | 1 (100.0%) | 0 (0.0%) |
| Cleaning & Maintenance | 0 (0.0%) | 0 (0.0%) |
| Personal Care & Service | 0 (0.0%) | 0 (0.0%) |
| Total (Category) | 1 (50.0%) | 1 (50.0%) |
| Total (Overall) | 36 (42.3%) | 49 (57.7%) |
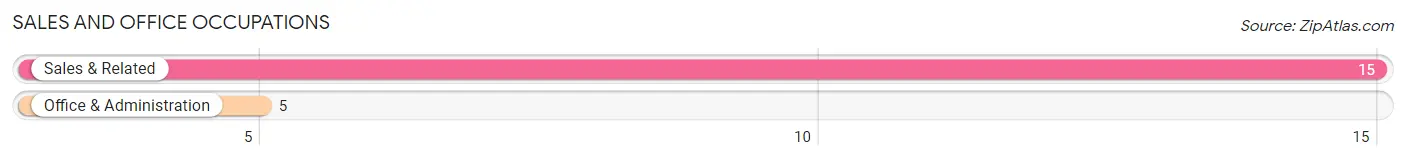
Sales and Office Occupations
The most common Sales and Office occupations in Meansville are Sales & Related (15 | 17.6%), and Office & Administration (5 | 5.9%).
Sales and Office Occupations by Sex

| Occupation | Male | Female |
| Sales & Related | 12 (80.0%) | 3 (20.0%) |
| Office & Administration | 0 (0.0%) | 5 (100.0%) |
| Total (Category) | 12 (60.0%) | 8 (40.0%) |
| Total (Overall) | 36 (42.3%) | 49 (57.7%) |
Natural Resources, Construction and Maintenance Occupations
The most common Natural Resources, Construction and Maintenance occupations in Meansville are , and Construction & Extraction (10 | 11.8%).
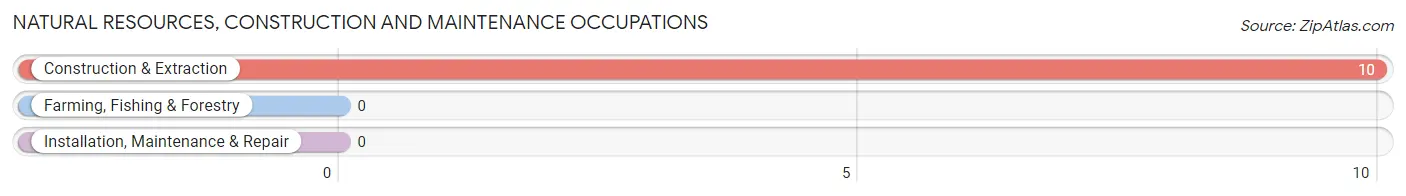
Natural Resources, Construction and Maintenance Occupations by Sex

| Occupation | Male | Female |
| Farming, Fishing & Forestry | 0 (0.0%) | 0 (0.0%) |
| Construction & Extraction | 10 (100.0%) | 0 (0.0%) |
| Installation, Maintenance & Repair | 0 (0.0%) | 0 (0.0%) |
| Total (Category) | 10 (100.0%) | 0 (0.0%) |
| Total (Overall) | 36 (42.3%) | 49 (57.7%) |
Production, Transportation and Moving Occupations
The most common Production, Transportation and Moving occupations in Meansville are Material Moving (5 | 5.9%), and Production (3 | 3.5%).
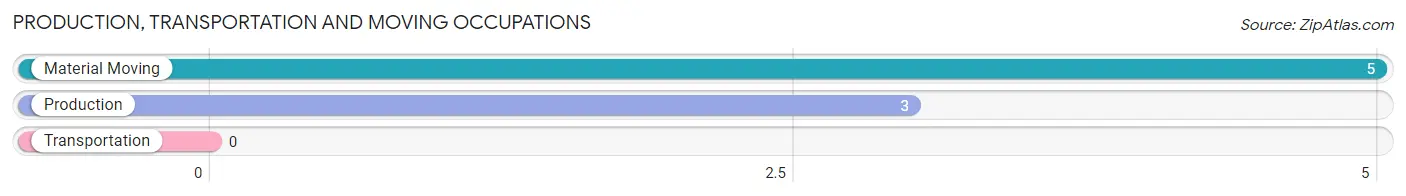
Production, Transportation and Moving Occupations by Sex
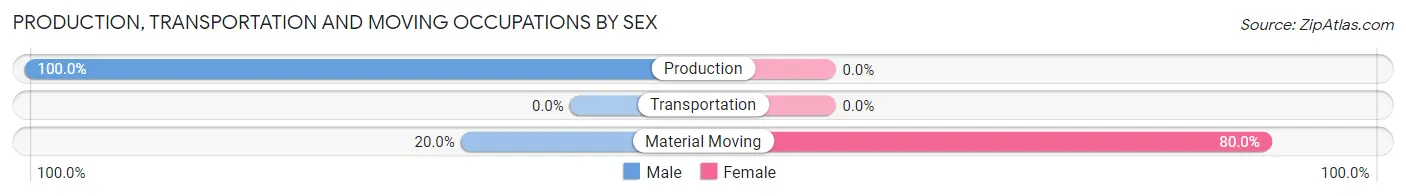
| Occupation | Male | Female |
| Production | 3 (100.0%) | 0 (0.0%) |
| Transportation | 0 (0.0%) | 0 (0.0%) |
| Material Moving | 1 (20.0%) | 4 (80.0%) |
| Total (Category) | 4 (50.0%) | 4 (50.0%) |
| Total (Overall) | 36 (42.3%) | 49 (57.7%) |
Employment Industries by Sex in Meansville
Employment Industries in Meansville
The major employment industries in Meansville include Construction (18 | 21.2%), Retail Trade (16 | 18.8%), Manufacturing (8 | 9.4%), Public Administration (7 | 8.2%), and Real Estate, Rental & Leasing (6 | 7.1%).
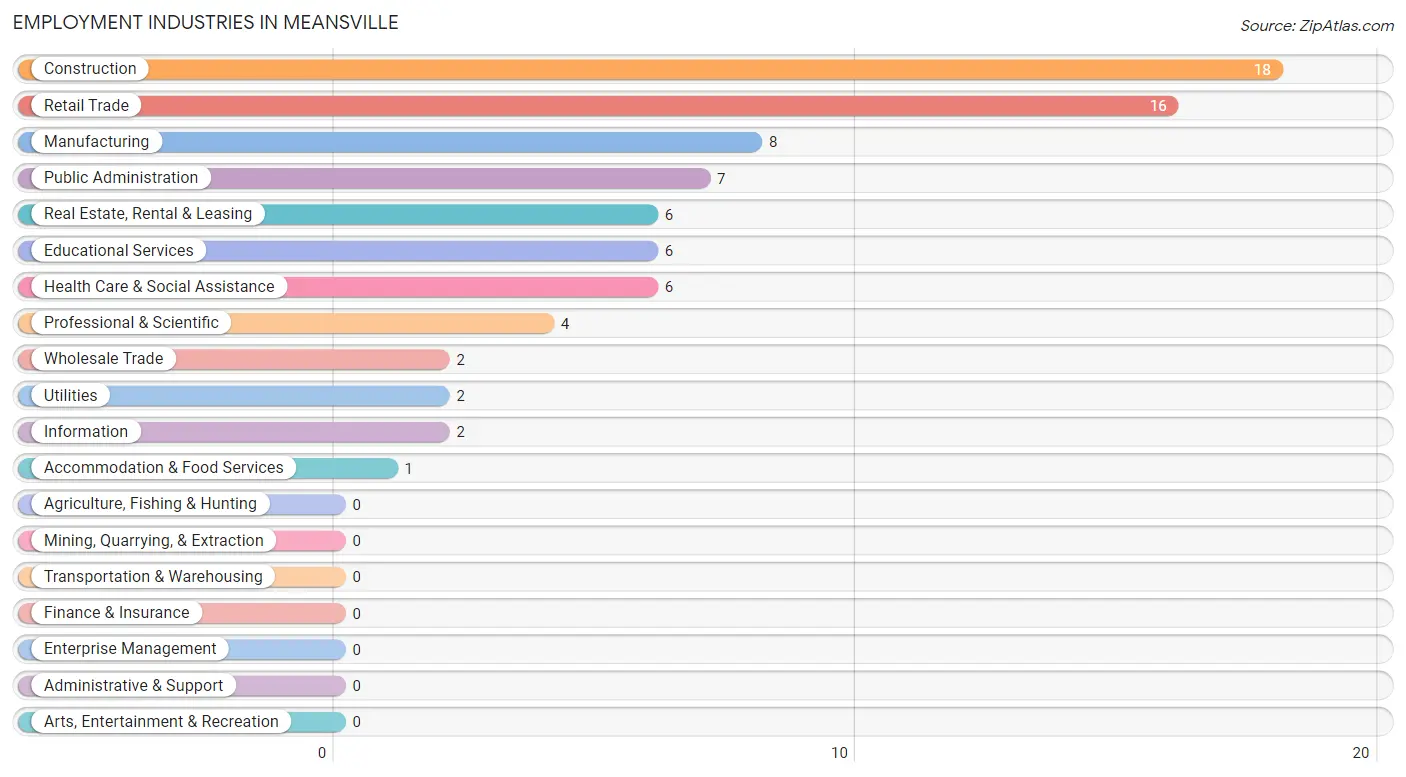
Employment Industries by Sex in Meansville
The Meansville industries that see more men than women are Utilities (100.0%), Professional & Scientific (100.0%), and Accommodation & Food Services (100.0%), whereas the industries that tend to have a higher number of women are Wholesale Trade (100.0%), Information (100.0%), and Educational Services (100.0%).
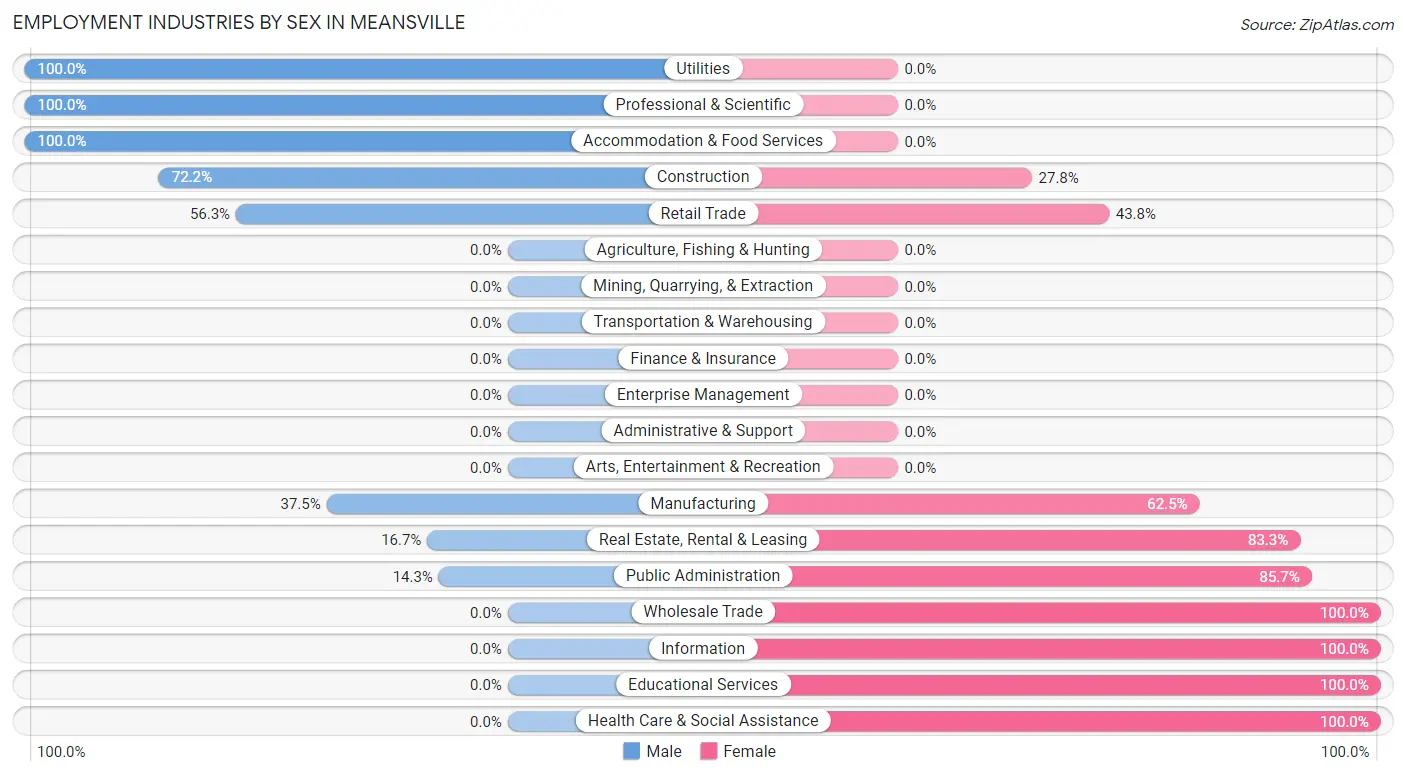
| Industry | Male | Female |
| Agriculture, Fishing & Hunting | 0 (0.0%) | 0 (0.0%) |
| Mining, Quarrying, & Extraction | 0 (0.0%) | 0 (0.0%) |
| Construction | 13 (72.2%) | 5 (27.8%) |
| Manufacturing | 3 (37.5%) | 5 (62.5%) |
| Wholesale Trade | 0 (0.0%) | 2 (100.0%) |
| Retail Trade | 9 (56.2%) | 7 (43.8%) |
| Transportation & Warehousing | 0 (0.0%) | 0 (0.0%) |
| Utilities | 2 (100.0%) | 0 (0.0%) |
| Information | 0 (0.0%) | 2 (100.0%) |
| Finance & Insurance | 0 (0.0%) | 0 (0.0%) |
| Real Estate, Rental & Leasing | 1 (16.7%) | 5 (83.3%) |
| Professional & Scientific | 4 (100.0%) | 0 (0.0%) |
| Enterprise Management | 0 (0.0%) | 0 (0.0%) |
| Administrative & Support | 0 (0.0%) | 0 (0.0%) |
| Educational Services | 0 (0.0%) | 6 (100.0%) |
| Health Care & Social Assistance | 0 (0.0%) | 6 (100.0%) |
| Arts, Entertainment & Recreation | 0 (0.0%) | 0 (0.0%) |
| Accommodation & Food Services | 1 (100.0%) | 0 (0.0%) |
| Public Administration | 1 (14.3%) | 6 (85.7%) |
| Total | 36 (42.3%) | 49 (57.7%) |
Education in Meansville
School Enrollment in Meansville
The most common levels of schooling among the 58 students in Meansville are high school (20 | 34.5%), college / undergraduate (18 | 31.0%), and graduate / professional (7 | 12.1%).
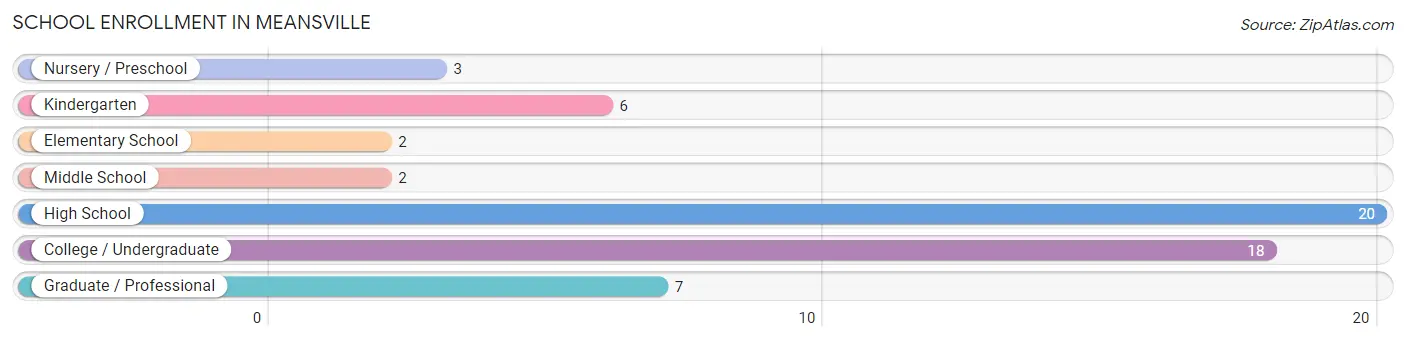
| School Level | # Students | % Students |
| Nursery / Preschool | 3 | 5.2% |
| Kindergarten | 6 | 10.3% |
| Elementary School | 2 | 3.5% |
| Middle School | 2 | 3.5% |
| High School | 20 | 34.5% |
| College / Undergraduate | 18 | 31.0% |
| Graduate / Professional | 7 | 12.1% |
| Total | 58 | 100.0% |
School Enrollment by Age by Funding Source in Meansville
Out of a total of 58 students who are enrolled in schools in Meansville, 10 (17.2%) attend a private institution, while the remaining 48 (82.8%) are enrolled in public schools. The age group of 3 to 4 year olds has the highest likelihood of being enrolled in private schools, with 3 (100.0% in the age bracket) enrolled. Conversely, the age group of 5 to 9 year old has the lowest likelihood of being enrolled in a private school, with 8 (100.0% in the age bracket) attending a public institution.
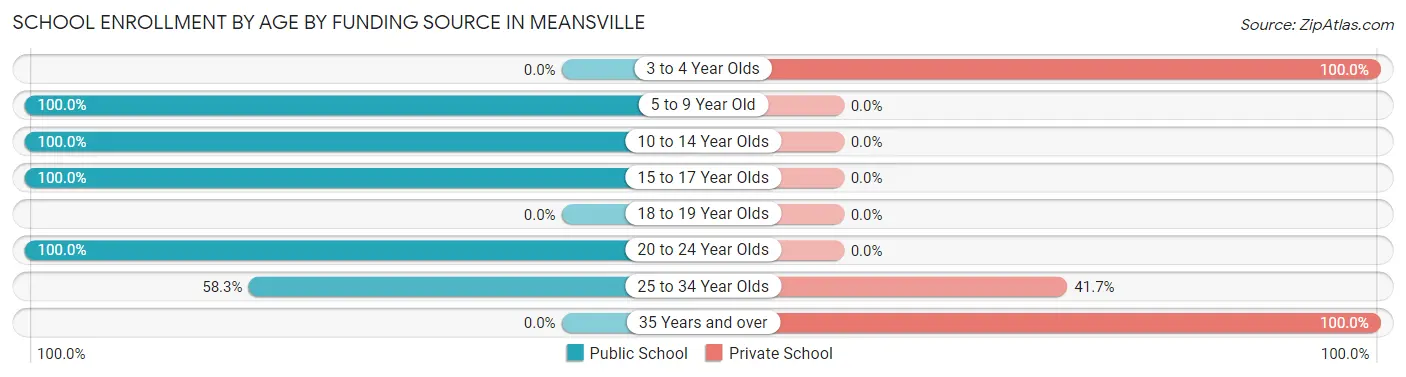
| Age Bracket | Public School | Private School |
| 3 to 4 Year Olds | 0 (0.0%) | 3 (100.0%) |
| 5 to 9 Year Old | 8 (100.0%) | 0 (0.0%) |
| 10 to 14 Year Olds | 2 (100.0%) | 0 (0.0%) |
| 15 to 17 Year Olds | 20 (100.0%) | 0 (0.0%) |
| 18 to 19 Year Olds | 0 (0.0%) | 0 (0.0%) |
| 20 to 24 Year Olds | 11 (100.0%) | 0 (0.0%) |
| 25 to 34 Year Olds | 7 (58.3%) | 5 (41.7%) |
| 35 Years and over | 0 (0.0%) | 2 (100.0%) |
| Total | 48 (82.8%) | 10 (17.2%) |
Educational Attainment by Field of Study in Meansville
Business (10 | 26.3%), education (8 | 21.0%), psychology (7 | 18.4%), literature & languages (4 | 10.5%), and bio, nature & agricultural (2 | 5.3%) are the most common fields of study among 38 individuals in Meansville who have obtained a bachelor's degree or higher.
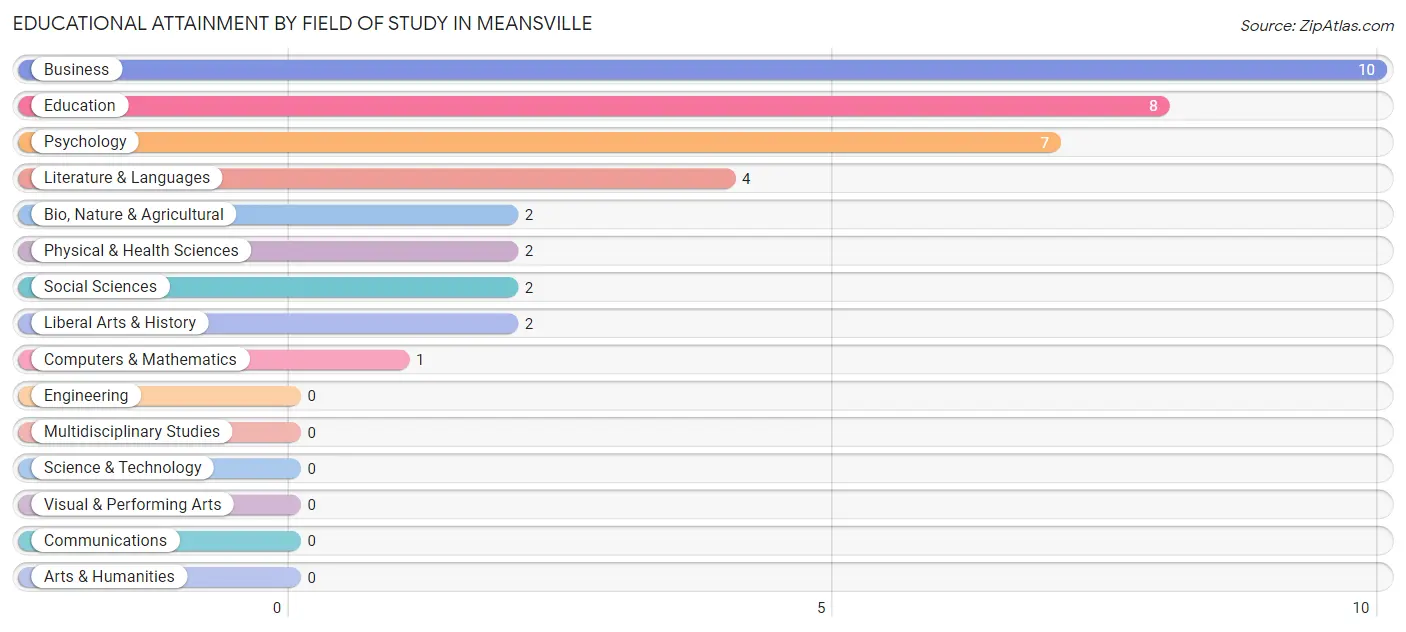
| Field of Study | # Graduates | % Graduates |
| Computers & Mathematics | 1 | 2.6% |
| Bio, Nature & Agricultural | 2 | 5.3% |
| Physical & Health Sciences | 2 | 5.3% |
| Psychology | 7 | 18.4% |
| Social Sciences | 2 | 5.3% |
| Engineering | 0 | 0.0% |
| Multidisciplinary Studies | 0 | 0.0% |
| Science & Technology | 0 | 0.0% |
| Business | 10 | 26.3% |
| Education | 8 | 21.0% |
| Literature & Languages | 4 | 10.5% |
| Liberal Arts & History | 2 | 5.3% |
| Visual & Performing Arts | 0 | 0.0% |
| Communications | 0 | 0.0% |
| Arts & Humanities | 0 | 0.0% |
| Total | 38 | 100.0% |
Transportation & Commute in Meansville
Vehicle Availability by Sex in Meansville
The most prevalent vehicle ownership categories in Meansville are males with 3 vehicles (11, accounting for 33.3%) and females with 3 vehicles (22, making up 22.5%).
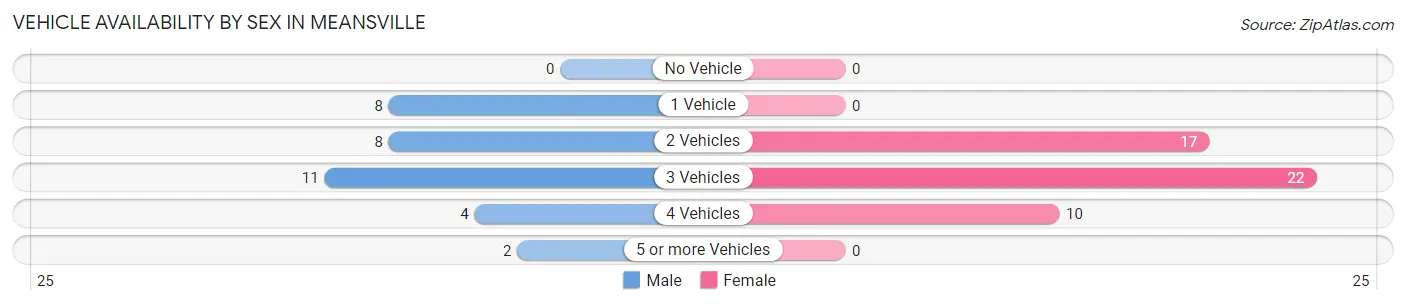
| Vehicles Available | Male | Female |
| No Vehicle | 0 (0.0%) | 0 (0.0%) |
| 1 Vehicle | 8 (24.2%) | 0 (0.0%) |
| 2 Vehicles | 8 (24.2%) | 17 (34.7%) |
| 3 Vehicles | 11 (33.3%) | 22 (44.9%) |
| 4 Vehicles | 4 (12.1%) | 10 (20.4%) |
| 5 or more Vehicles | 2 (6.1%) | 0 (0.0%) |
| Total | 33 (100.0%) | 49 (100.0%) |
Commute Time in Meansville
The most frequently occuring commute durations in Meansville are 60 to 89 minutes (15 commuters, 19.0%), 20 to 24 minutes (14 commuters, 17.7%), and 45 to 59 minutes (12 commuters, 15.2%).

| Commute Time | # Commuters | % Commuters |
| Less than 5 Minutes | 8 | 10.1% |
| 5 to 9 Minutes | 0 | 0.0% |
| 10 to 14 Minutes | 9 | 11.4% |
| 15 to 19 Minutes | 5 | 6.3% |
| 20 to 24 Minutes | 14 | 17.7% |
| 25 to 29 Minutes | 7 | 8.9% |
| 30 to 34 Minutes | 0 | 0.0% |
| 35 to 39 Minutes | 7 | 8.9% |
| 40 to 44 Minutes | 0 | 0.0% |
| 45 to 59 Minutes | 12 | 15.2% |
| 60 to 89 Minutes | 15 | 19.0% |
| 90 or more Minutes | 2 | 2.5% |
Commute Time by Sex in Meansville
The most common commute times in Meansville are 45 to 59 minutes (12 commuters, 36.4%) for males and 20 to 24 minutes (11 commuters, 23.9%) for females.
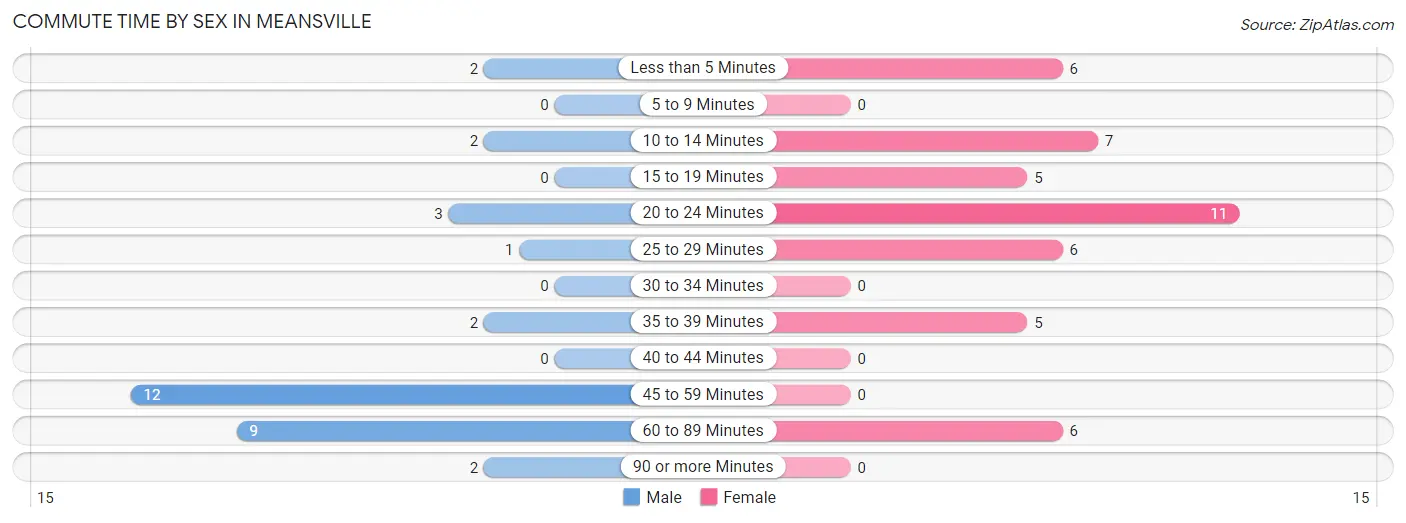
| Commute Time | Male | Female |
| Less than 5 Minutes | 2 (6.1%) | 6 (13.0%) |
| 5 to 9 Minutes | 0 (0.0%) | 0 (0.0%) |
| 10 to 14 Minutes | 2 (6.1%) | 7 (15.2%) |
| 15 to 19 Minutes | 0 (0.0%) | 5 (10.9%) |
| 20 to 24 Minutes | 3 (9.1%) | 11 (23.9%) |
| 25 to 29 Minutes | 1 (3.0%) | 6 (13.0%) |
| 30 to 34 Minutes | 0 (0.0%) | 0 (0.0%) |
| 35 to 39 Minutes | 2 (6.1%) | 5 (10.9%) |
| 40 to 44 Minutes | 0 (0.0%) | 0 (0.0%) |
| 45 to 59 Minutes | 12 (36.4%) | 0 (0.0%) |
| 60 to 89 Minutes | 9 (27.3%) | 6 (13.0%) |
| 90 or more Minutes | 2 (6.1%) | 0 (0.0%) |
Time of Departure to Work by Sex in Meansville
The most frequent times of departure to work in Meansville are 9:00 AM to 9:59 AM (10, 30.3%) for males and 7:00 AM to 7:29 AM (14, 30.4%) for females.
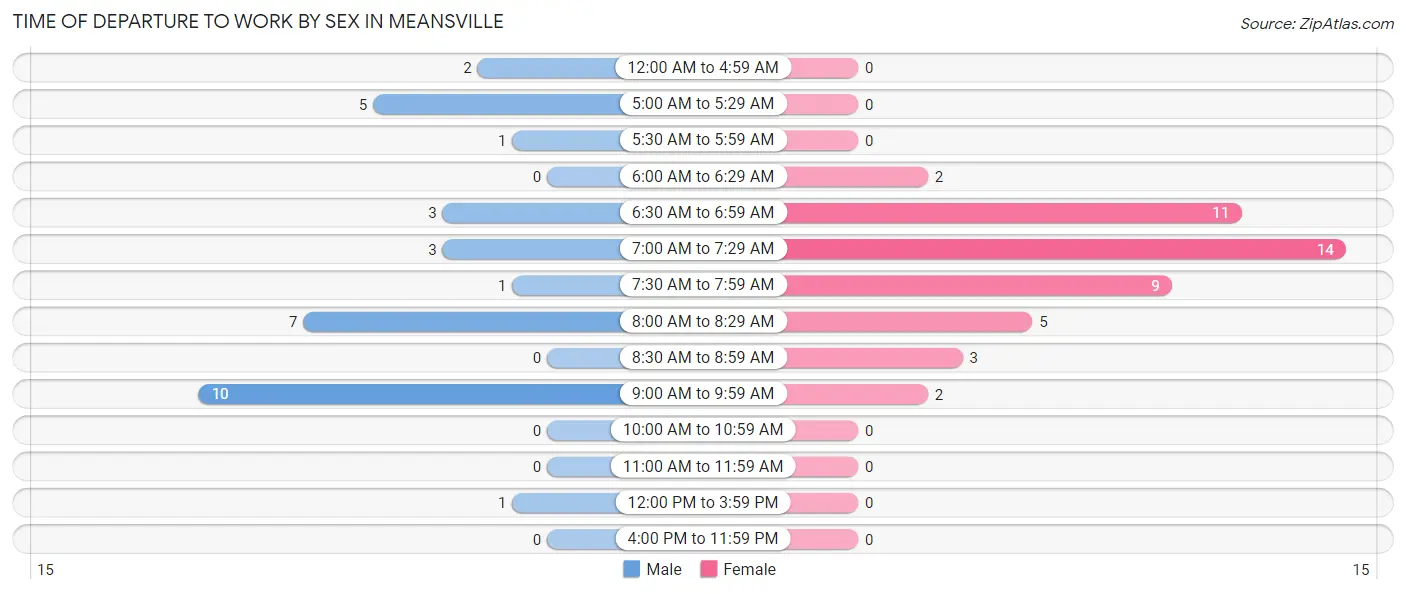
| Time of Departure | Male | Female |
| 12:00 AM to 4:59 AM | 2 (6.1%) | 0 (0.0%) |
| 5:00 AM to 5:29 AM | 5 (15.1%) | 0 (0.0%) |
| 5:30 AM to 5:59 AM | 1 (3.0%) | 0 (0.0%) |
| 6:00 AM to 6:29 AM | 0 (0.0%) | 2 (4.3%) |
| 6:30 AM to 6:59 AM | 3 (9.1%) | 11 (23.9%) |
| 7:00 AM to 7:29 AM | 3 (9.1%) | 14 (30.4%) |
| 7:30 AM to 7:59 AM | 1 (3.0%) | 9 (19.6%) |
| 8:00 AM to 8:29 AM | 7 (21.2%) | 5 (10.9%) |
| 8:30 AM to 8:59 AM | 0 (0.0%) | 3 (6.5%) |
| 9:00 AM to 9:59 AM | 10 (30.3%) | 2 (4.3%) |
| 10:00 AM to 10:59 AM | 0 (0.0%) | 0 (0.0%) |
| 11:00 AM to 11:59 AM | 0 (0.0%) | 0 (0.0%) |
| 12:00 PM to 3:59 PM | 1 (3.0%) | 0 (0.0%) |
| 4:00 PM to 11:59 PM | 0 (0.0%) | 0 (0.0%) |
| Total | 33 (100.0%) | 46 (100.0%) |
Housing Occupancy in Meansville
Occupancy by Ownership in Meansville
Of the total 100 dwellings in Meansville, owner-occupied units account for 72 (72.0%), while renter-occupied units make up 28 (28.0%).
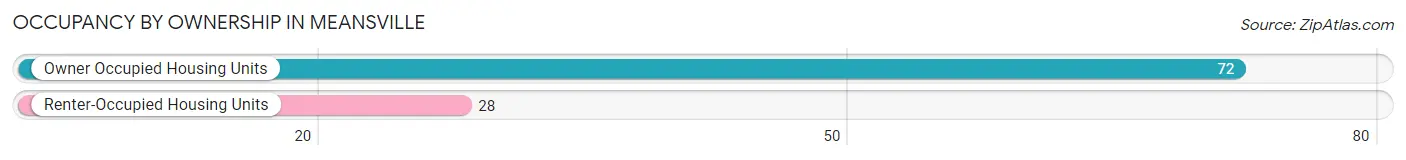
| Occupancy | # Housing Units | % Housing Units |
| Owner Occupied Housing Units | 72 | 72.0% |
| Renter-Occupied Housing Units | 28 | 28.0% |
| Total Occupied Housing Units | 100 | 100.0% |
Occupancy by Household Size in Meansville
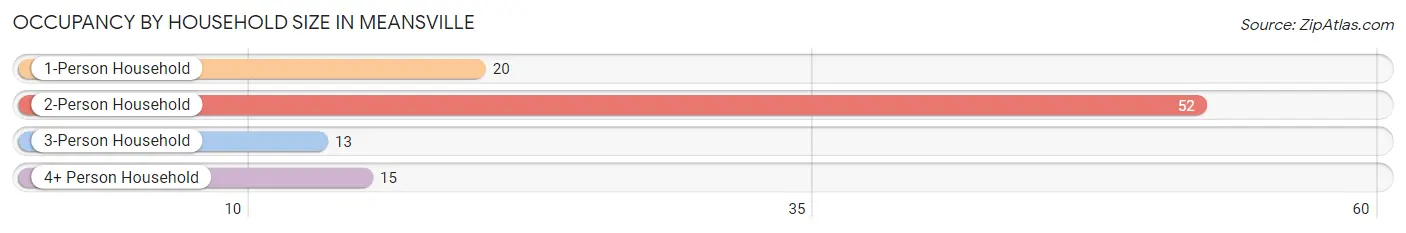
| Household Size | # Housing Units | % Housing Units |
| 1-Person Household | 20 | 20.0% |
| 2-Person Household | 52 | 52.0% |
| 3-Person Household | 13 | 13.0% |
| 4+ Person Household | 15 | 15.0% |
| Total Housing Units | 100 | 100.0% |
Occupancy by Ownership by Household Size in Meansville
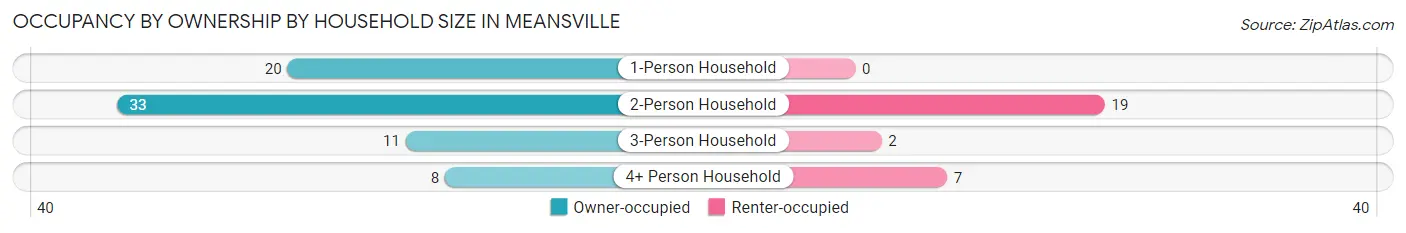
| Household Size | Owner-occupied | Renter-occupied |
| 1-Person Household | 20 (100.0%) | 0 (0.0%) |
| 2-Person Household | 33 (63.5%) | 19 (36.5%) |
| 3-Person Household | 11 (84.6%) | 2 (15.4%) |
| 4+ Person Household | 8 (53.3%) | 7 (46.7%) |
| Total Housing Units | 72 (72.0%) | 28 (28.0%) |
Occupancy by Educational Attainment in Meansville
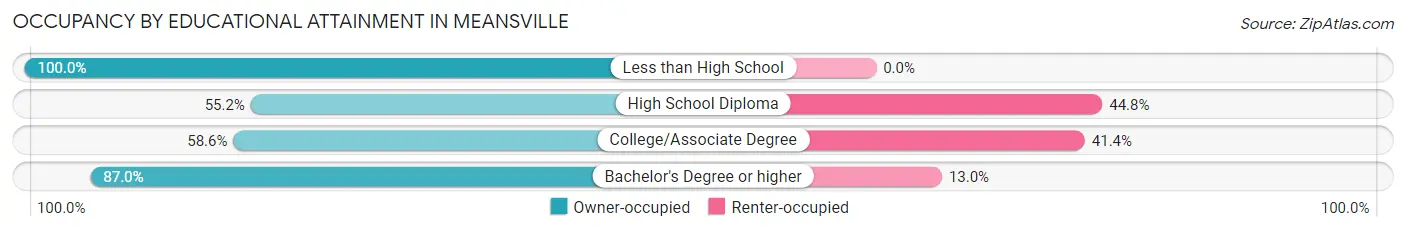
| Household Size | Owner-occupied | Renter-occupied |
| Less than High School | 19 (100.0%) | 0 (0.0%) |
| High School Diploma | 16 (55.2%) | 13 (44.8%) |
| College/Associate Degree | 17 (58.6%) | 12 (41.4%) |
| Bachelor's Degree or higher | 20 (87.0%) | 3 (13.0%) |
Occupancy by Age of Householder in Meansville
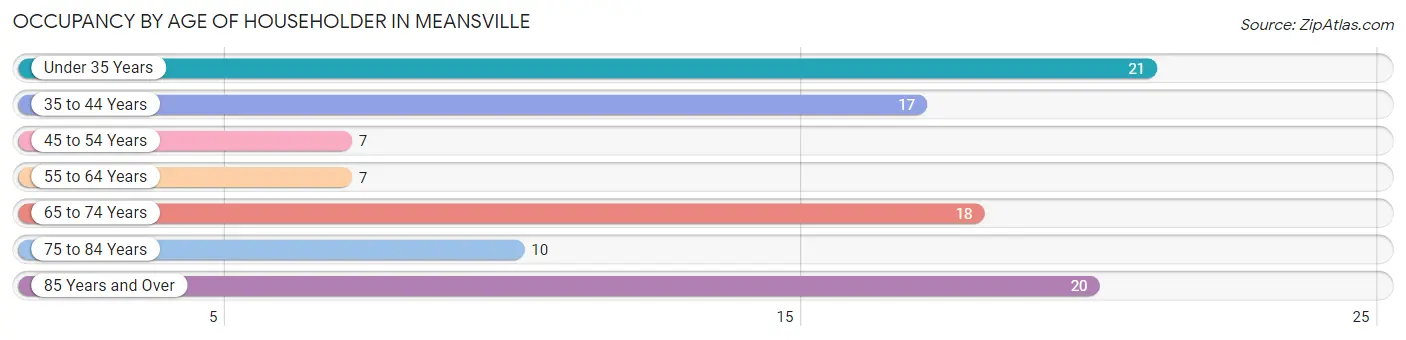
| Age Bracket | # Households | % Households |
| Under 35 Years | 21 | 21.0% |
| 35 to 44 Years | 17 | 17.0% |
| 45 to 54 Years | 7 | 7.0% |
| 55 to 64 Years | 7 | 7.0% |
| 65 to 74 Years | 18 | 18.0% |
| 75 to 84 Years | 10 | 10.0% |
| 85 Years and Over | 20 | 20.0% |
| Total | 100 | 100.0% |
Housing Finances in Meansville
Median Income by Occupancy in Meansville
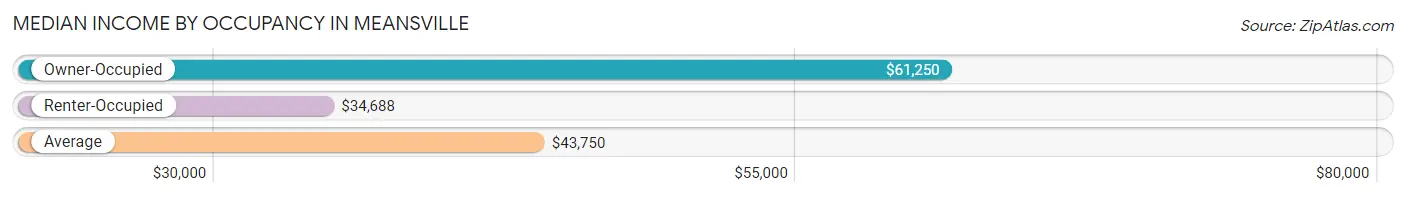
| Occupancy Type | # Households | Median Income |
| Owner-Occupied | 72 (72.0%) | $61,250 |
| Renter-Occupied | 28 (28.0%) | $34,688 |
| Average | 100 (100.0%) | $43,750 |
Occupancy by Householder Income Bracket in Meansville
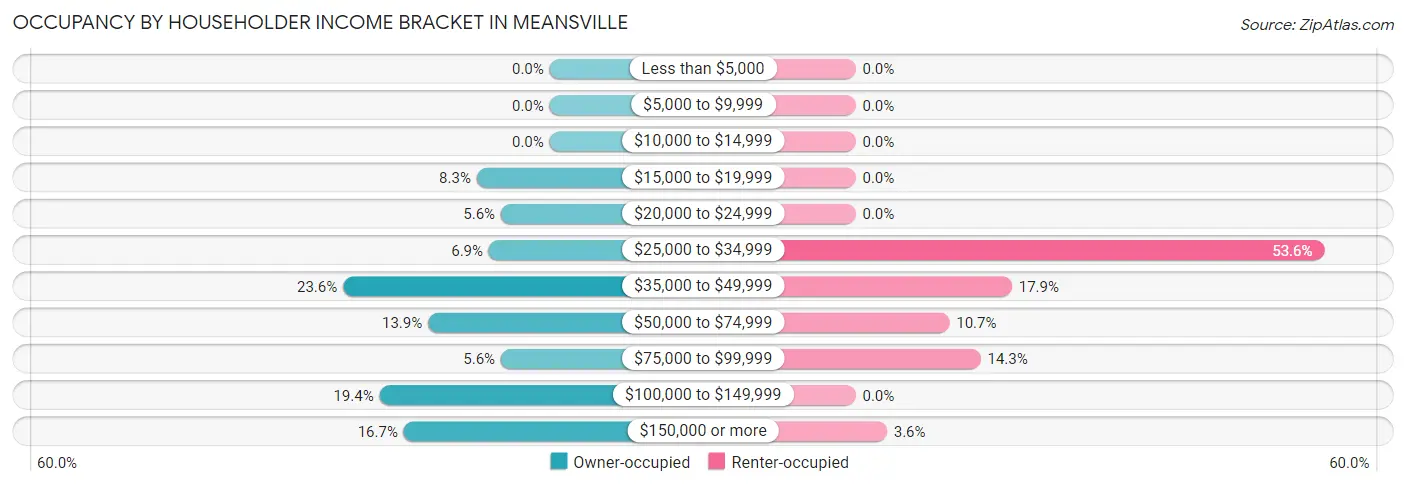
| Income Bracket | Owner-occupied | Renter-occupied |
| Less than $5,000 | 0 (0.0%) | 0 (0.0%) |
| $5,000 to $9,999 | 0 (0.0%) | 0 (0.0%) |
| $10,000 to $14,999 | 0 (0.0%) | 0 (0.0%) |
| $15,000 to $19,999 | 6 (8.3%) | 0 (0.0%) |
| $20,000 to $24,999 | 4 (5.6%) | 0 (0.0%) |
| $25,000 to $34,999 | 5 (6.9%) | 15 (53.6%) |
| $35,000 to $49,999 | 17 (23.6%) | 5 (17.9%) |
| $50,000 to $74,999 | 10 (13.9%) | 3 (10.7%) |
| $75,000 to $99,999 | 4 (5.6%) | 4 (14.3%) |
| $100,000 to $149,999 | 14 (19.4%) | 0 (0.0%) |
| $150,000 or more | 12 (16.7%) | 1 (3.6%) |
| Total | 72 (100.0%) | 28 (100.0%) |
Monthly Housing Cost Tiers in Meansville
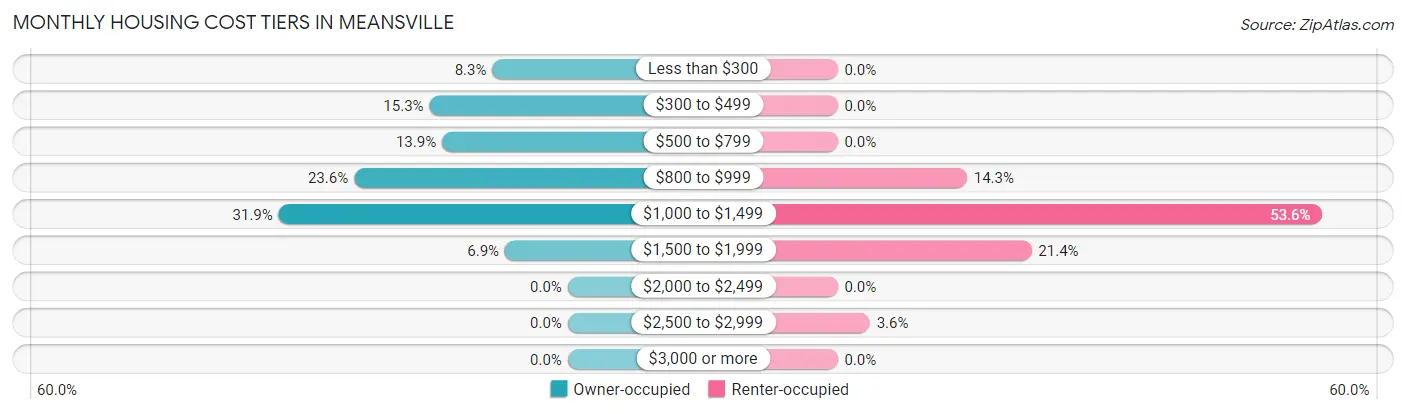
| Monthly Cost | Owner-occupied | Renter-occupied |
| Less than $300 | 6 (8.3%) | 0 (0.0%) |
| $300 to $499 | 11 (15.3%) | 0 (0.0%) |
| $500 to $799 | 10 (13.9%) | 0 (0.0%) |
| $800 to $999 | 17 (23.6%) | 4 (14.3%) |
| $1,000 to $1,499 | 23 (31.9%) | 15 (53.6%) |
| $1,500 to $1,999 | 5 (6.9%) | 6 (21.4%) |
| $2,000 to $2,499 | 0 (0.0%) | 0 (0.0%) |
| $2,500 to $2,999 | 0 (0.0%) | 1 (3.6%) |
| $3,000 or more | 0 (0.0%) | 0 (0.0%) |
| Total | 72 (100.0%) | 28 (100.0%) |
Physical Housing Characteristics in Meansville
Housing Structures in Meansville
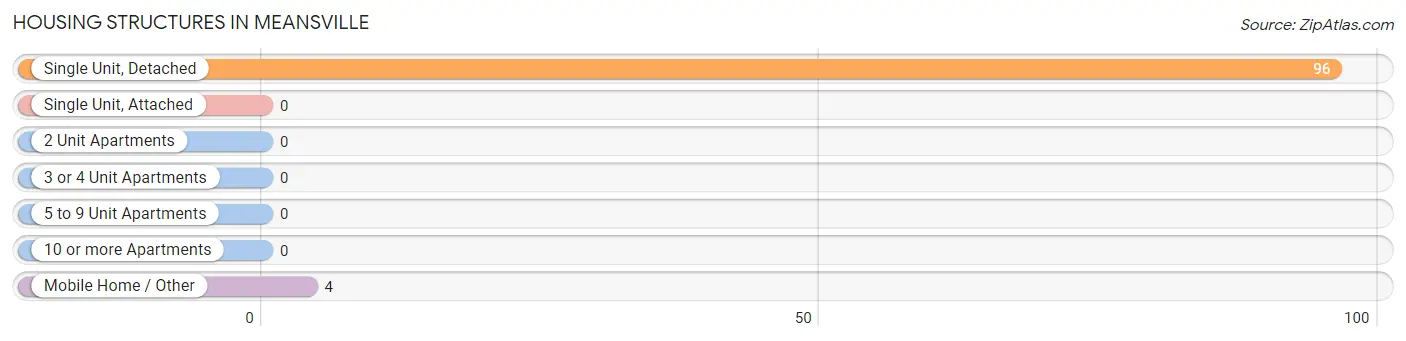
| Structure Type | # Housing Units | % Housing Units |
| Single Unit, Detached | 96 | 96.0% |
| Single Unit, Attached | 0 | 0.0% |
| 2 Unit Apartments | 0 | 0.0% |
| 3 or 4 Unit Apartments | 0 | 0.0% |
| 5 to 9 Unit Apartments | 0 | 0.0% |
| 10 or more Apartments | 0 | 0.0% |
| Mobile Home / Other | 4 | 4.0% |
| Total | 100 | 100.0% |
Housing Structures by Occupancy in Meansville
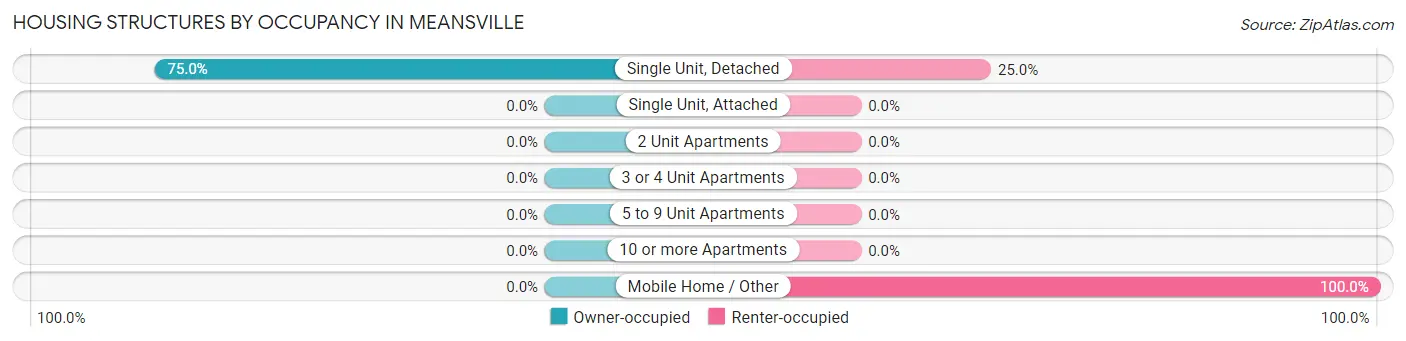
| Structure Type | Owner-occupied | Renter-occupied |
| Single Unit, Detached | 72 (75.0%) | 24 (25.0%) |
| Single Unit, Attached | 0 (0.0%) | 0 (0.0%) |
| 2 Unit Apartments | 0 (0.0%) | 0 (0.0%) |
| 3 or 4 Unit Apartments | 0 (0.0%) | 0 (0.0%) |
| 5 to 9 Unit Apartments | 0 (0.0%) | 0 (0.0%) |
| 10 or more Apartments | 0 (0.0%) | 0 (0.0%) |
| Mobile Home / Other | 0 (0.0%) | 4 (100.0%) |
| Total | 72 (72.0%) | 28 (28.0%) |
Housing Structures by Number of Rooms in Meansville
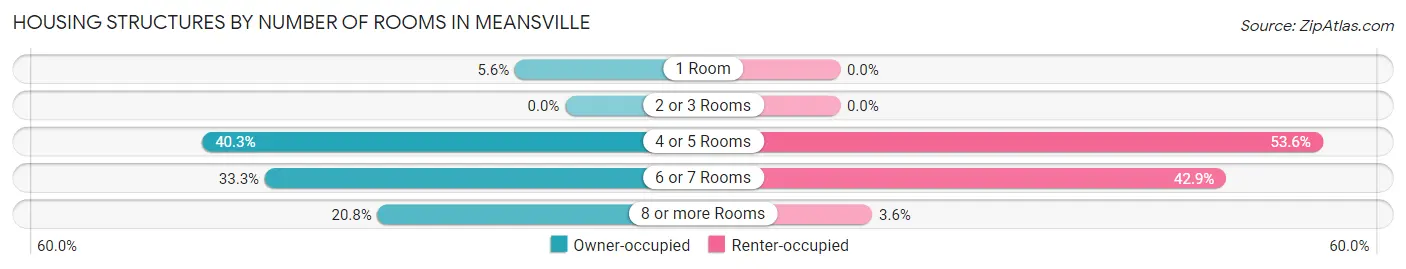
| Number of Rooms | Owner-occupied | Renter-occupied |
| 1 Room | 4 (5.6%) | 0 (0.0%) |
| 2 or 3 Rooms | 0 (0.0%) | 0 (0.0%) |
| 4 or 5 Rooms | 29 (40.3%) | 15 (53.6%) |
| 6 or 7 Rooms | 24 (33.3%) | 12 (42.9%) |
| 8 or more Rooms | 15 (20.8%) | 1 (3.6%) |
| Total | 72 (100.0%) | 28 (100.0%) |
Housing Structure by Heating Type in Meansville
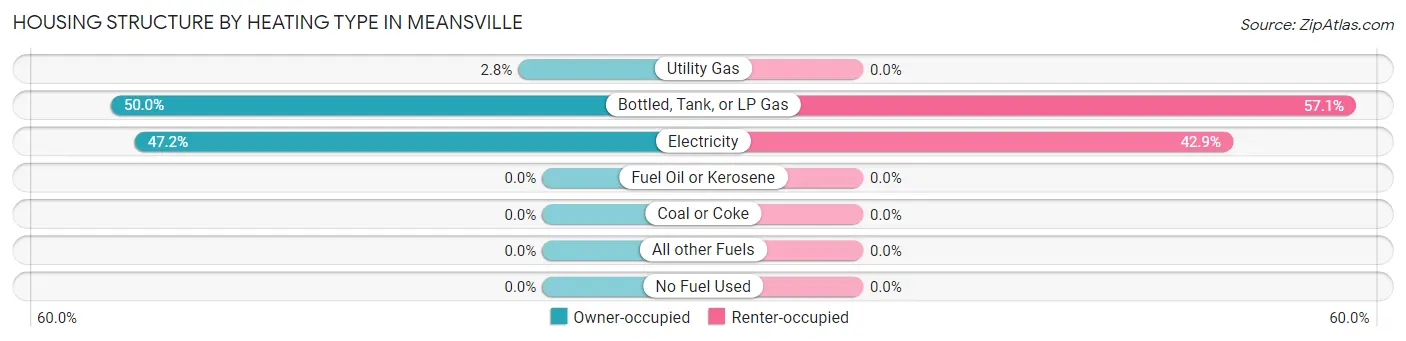
| Heating Type | Owner-occupied | Renter-occupied |
| Utility Gas | 2 (2.8%) | 0 (0.0%) |
| Bottled, Tank, or LP Gas | 36 (50.0%) | 16 (57.1%) |
| Electricity | 34 (47.2%) | 12 (42.9%) |
| Fuel Oil or Kerosene | 0 (0.0%) | 0 (0.0%) |
| Coal or Coke | 0 (0.0%) | 0 (0.0%) |
| All other Fuels | 0 (0.0%) | 0 (0.0%) |
| No Fuel Used | 0 (0.0%) | 0 (0.0%) |
| Total | 72 (100.0%) | 28 (100.0%) |
Household Vehicle Usage in Meansville
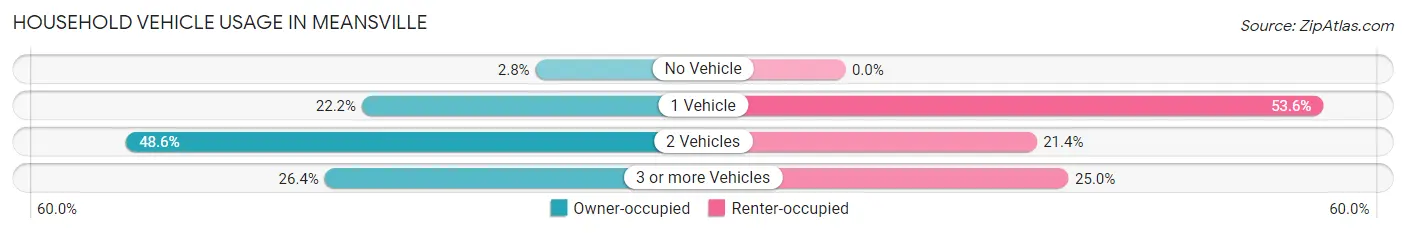
| Vehicles per Household | Owner-occupied | Renter-occupied |
| No Vehicle | 2 (2.8%) | 0 (0.0%) |
| 1 Vehicle | 16 (22.2%) | 15 (53.6%) |
| 2 Vehicles | 35 (48.6%) | 6 (21.4%) |
| 3 or more Vehicles | 19 (26.4%) | 7 (25.0%) |
| Total | 72 (100.0%) | 28 (100.0%) |
Real Estate & Mortgages in Meansville
Real Estate and Mortgage Overview in Meansville
| Characteristic | Without Mortgage | With Mortgage |
| Housing Units | 33 | 39 |
| Median Property Value | $82,800 | $221,900 |
| Median Household Income | $36,458 | $10 |
| Monthly Housing Costs | - | - |
| Real Estate Taxes | $900 | $6 |
Property Value by Mortgage Status in Meansville
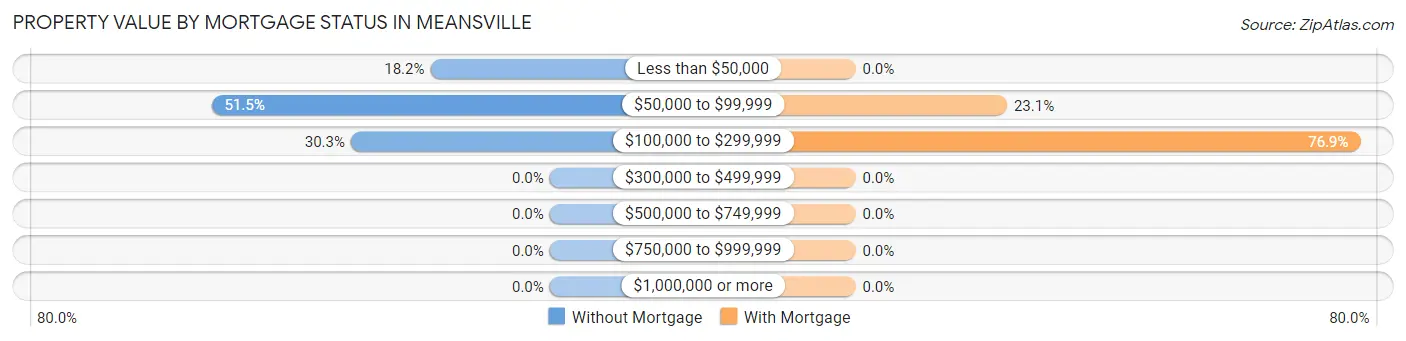
| Property Value | Without Mortgage | With Mortgage |
| Less than $50,000 | 6 (18.2%) | 0 (0.0%) |
| $50,000 to $99,999 | 17 (51.5%) | 9 (23.1%) |
| $100,000 to $299,999 | 10 (30.3%) | 30 (76.9%) |
| $300,000 to $499,999 | 0 (0.0%) | 0 (0.0%) |
| $500,000 to $749,999 | 0 (0.0%) | 0 (0.0%) |
| $750,000 to $999,999 | 0 (0.0%) | 0 (0.0%) |
| $1,000,000 or more | 0 (0.0%) | 0 (0.0%) |
| Total | 33 (100.0%) | 39 (100.0%) |
Household Income by Mortgage Status in Meansville
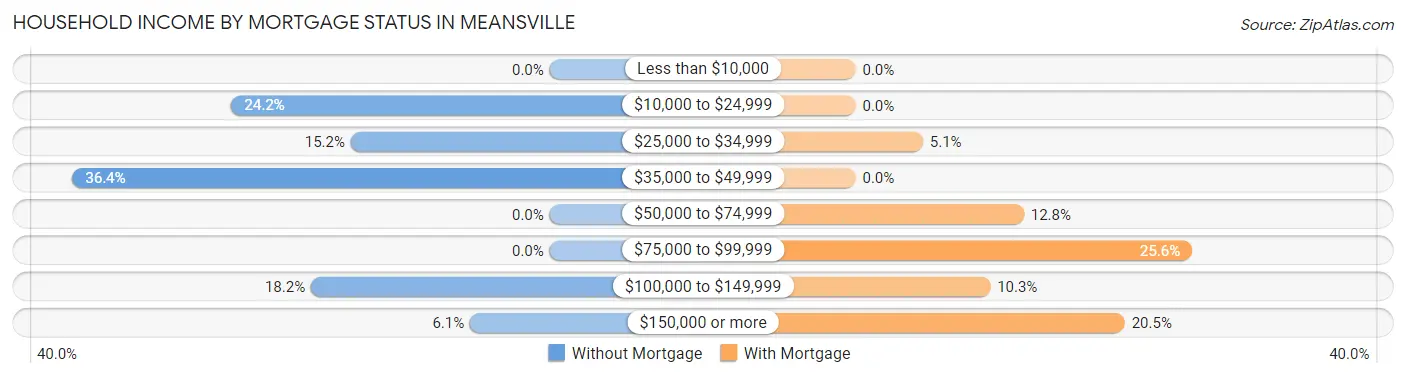
| Household Income | Without Mortgage | With Mortgage |
| Less than $10,000 | 0 (0.0%) | 0 (0.0%) |
| $10,000 to $24,999 | 8 (24.2%) | 0 (0.0%) |
| $25,000 to $34,999 | 5 (15.1%) | 2 (5.1%) |
| $35,000 to $49,999 | 12 (36.4%) | 0 (0.0%) |
| $50,000 to $74,999 | 0 (0.0%) | 5 (12.8%) |
| $75,000 to $99,999 | 0 (0.0%) | 10 (25.6%) |
| $100,000 to $149,999 | 6 (18.2%) | 4 (10.3%) |
| $150,000 or more | 2 (6.1%) | 8 (20.5%) |
| Total | 33 (100.0%) | 39 (100.0%) |
Property Value to Household Income Ratio in Meansville
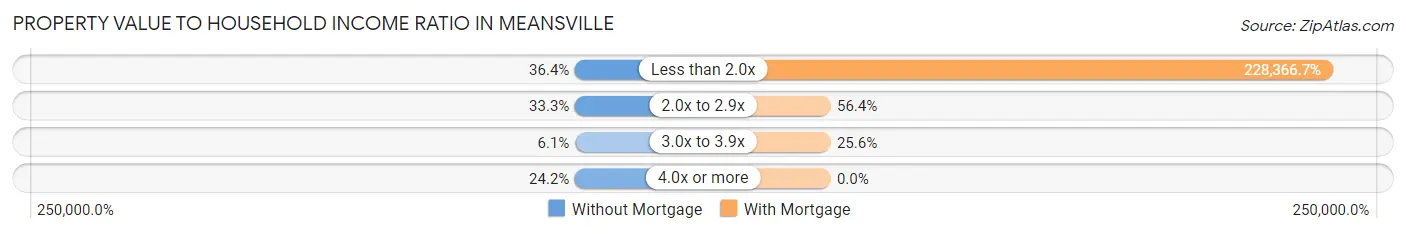
| Value-to-Income Ratio | Without Mortgage | With Mortgage |
| Less than 2.0x | 12 (36.4%) | 89,063 (228,366.7%) |
| 2.0x to 2.9x | 11 (33.3%) | 22 (56.4%) |
| 3.0x to 3.9x | 2 (6.1%) | 10 (25.6%) |
| 4.0x or more | 8 (24.2%) | 0 (0.0%) |
| Total | 33 (100.0%) | 39 (100.0%) |
Real Estate Taxes by Mortgage Status in Meansville
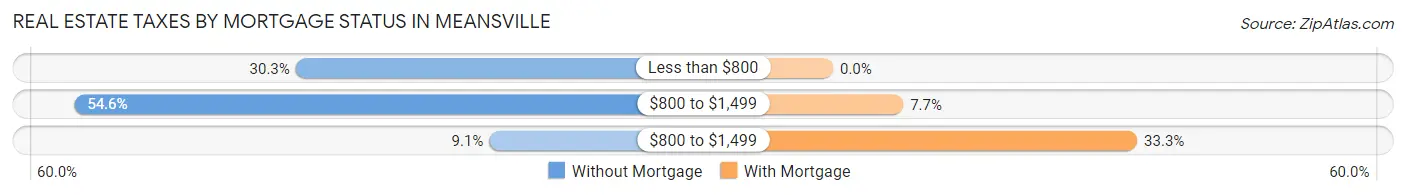
| Property Taxes | Without Mortgage | With Mortgage |
| Less than $800 | 10 (30.3%) | 0 (0.0%) |
| $800 to $1,499 | 18 (54.5%) | 3 (7.7%) |
| $800 to $1,499 | 3 (9.1%) | 13 (33.3%) |
| Total | 33 (100.0%) | 39 (100.0%) |
Health & Disability in Meansville
Health Insurance Coverage by Age in Meansville
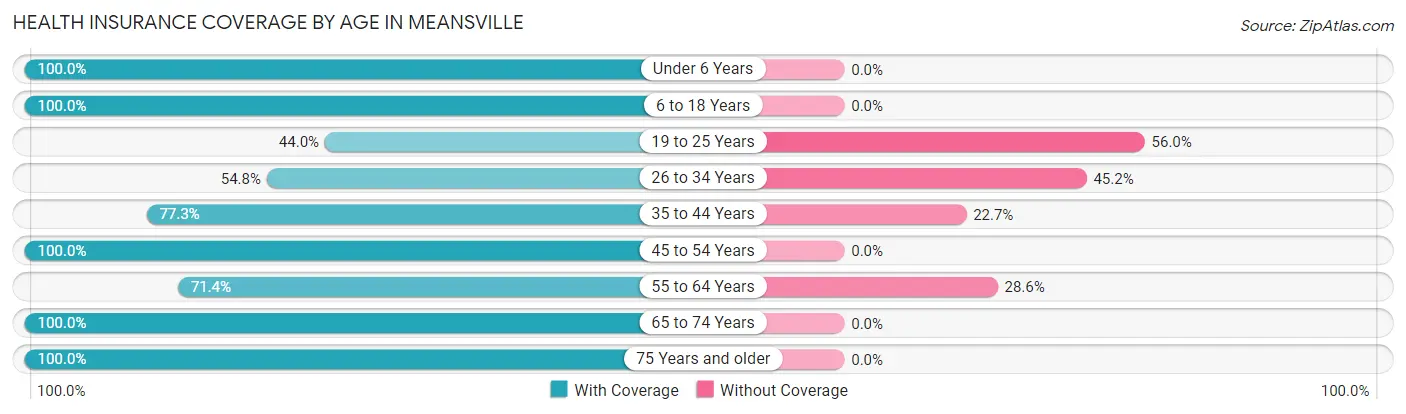
| Age Bracket | With Coverage | Without Coverage |
| Under 6 Years | 15 (100.0%) | 0 (0.0%) |
| 6 to 18 Years | 31 (100.0%) | 0 (0.0%) |
| 19 to 25 Years | 11 (44.0%) | 14 (56.0%) |
| 26 to 34 Years | 17 (54.8%) | 14 (45.2%) |
| 35 to 44 Years | 17 (77.3%) | 5 (22.7%) |
| 45 to 54 Years | 19 (100.0%) | 0 (0.0%) |
| 55 to 64 Years | 10 (71.4%) | 4 (28.6%) |
| 65 to 74 Years | 30 (100.0%) | 0 (0.0%) |
| 75 Years and older | 52 (100.0%) | 0 (0.0%) |
| Total | 202 (84.5%) | 37 (15.5%) |
Health Insurance Coverage by Citizenship Status in Meansville
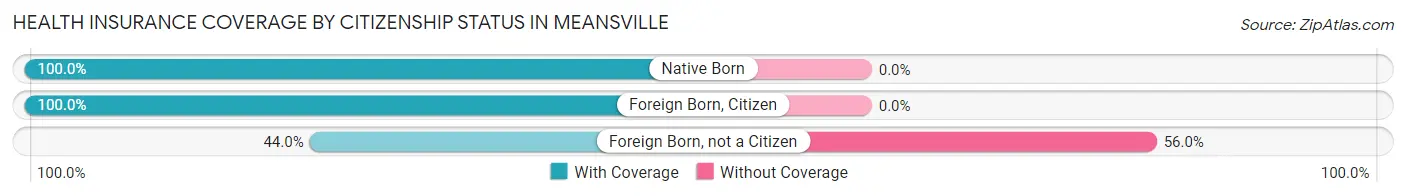
| Citizenship Status | With Coverage | Without Coverage |
| Native Born | 15 (100.0%) | 0 (0.0%) |
| Foreign Born, Citizen | 31 (100.0%) | 0 (0.0%) |
| Foreign Born, not a Citizen | 11 (44.0%) | 14 (56.0%) |
Health Insurance Coverage by Household Income in Meansville
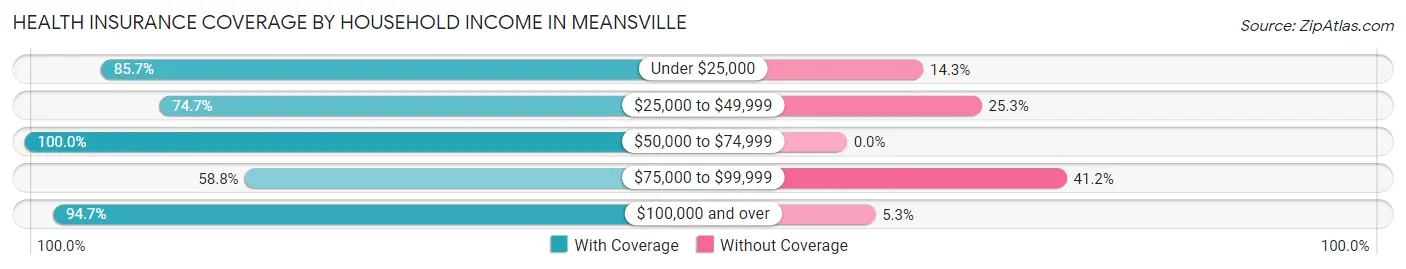
| Household Income | With Coverage | Without Coverage |
| Under $25,000 | 12 (85.7%) | 2 (14.3%) |
| $25,000 to $49,999 | 71 (74.7%) | 24 (25.3%) |
| $50,000 to $74,999 | 38 (100.0%) | 0 (0.0%) |
| $75,000 to $99,999 | 10 (58.8%) | 7 (41.2%) |
| $100,000 and over | 71 (94.7%) | 4 (5.3%) |
Public vs Private Health Insurance Coverage by Age in Meansville
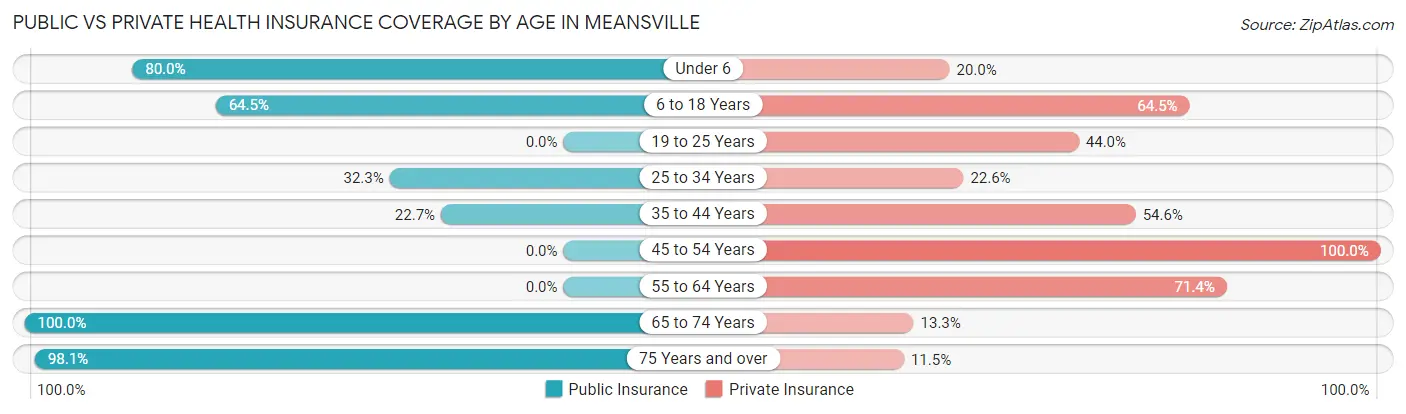
| Age Bracket | Public Insurance | Private Insurance |
| Under 6 | 12 (80.0%) | 3 (20.0%) |
| 6 to 18 Years | 20 (64.5%) | 20 (64.5%) |
| 19 to 25 Years | 0 (0.0%) | 11 (44.0%) |
| 25 to 34 Years | 10 (32.3%) | 7 (22.6%) |
| 35 to 44 Years | 5 (22.7%) | 12 (54.5%) |
| 45 to 54 Years | 0 (0.0%) | 19 (100.0%) |
| 55 to 64 Years | 0 (0.0%) | 10 (71.4%) |
| 65 to 74 Years | 30 (100.0%) | 4 (13.3%) |
| 75 Years and over | 51 (98.1%) | 6 (11.5%) |
| Total | 128 (53.6%) | 92 (38.5%) |
Disability Status by Sex by Age in Meansville
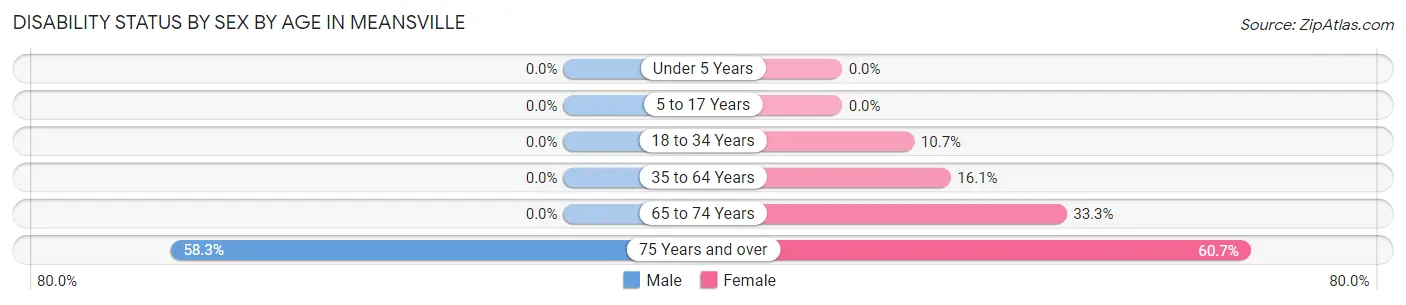
| Age Bracket | Male | Female |
| Under 5 Years | 0 (0.0%) | 0 (0.0%) |
| 5 to 17 Years | 0 (0.0%) | 0 (0.0%) |
| 18 to 34 Years | 0 (0.0%) | 3 (10.7%) |
| 35 to 64 Years | 0 (0.0%) | 5 (16.1%) |
| 65 to 74 Years | 0 (0.0%) | 6 (33.3%) |
| 75 Years and over | 14 (58.3%) | 17 (60.7%) |
Disability Class by Sex by Age in Meansville
Disability Class: Hearing Difficulty
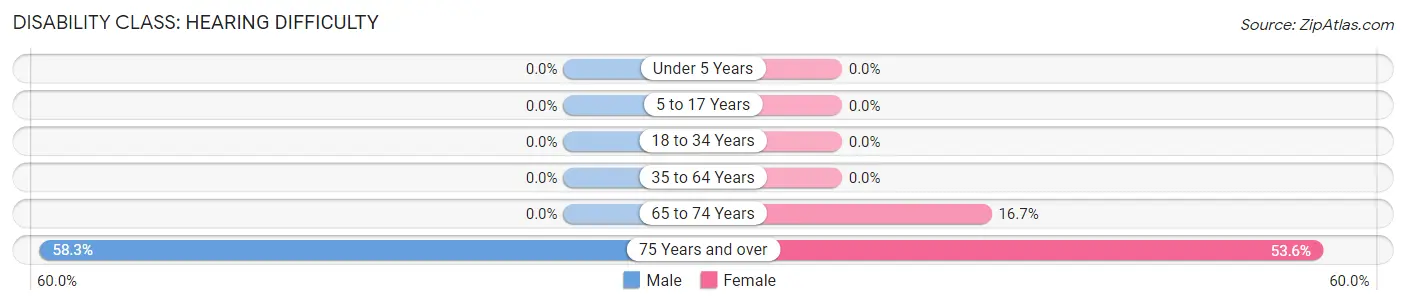
| Age Bracket | Male | Female |
| Under 5 Years | 0 (0.0%) | 0 (0.0%) |
| 5 to 17 Years | 0 (0.0%) | 0 (0.0%) |
| 18 to 34 Years | 0 (0.0%) | 0 (0.0%) |
| 35 to 64 Years | 0 (0.0%) | 0 (0.0%) |
| 65 to 74 Years | 0 (0.0%) | 3 (16.7%) |
| 75 Years and over | 14 (58.3%) | 15 (53.6%) |
Disability Class: Vision Difficulty
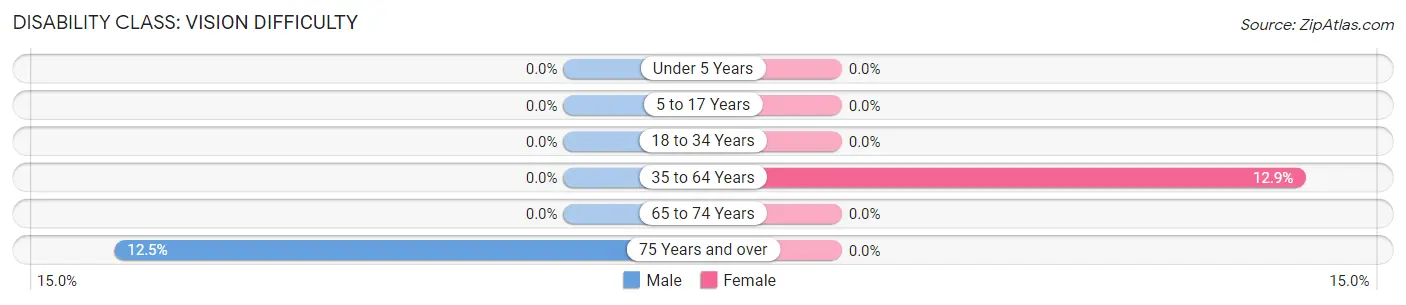
| Age Bracket | Male | Female |
| Under 5 Years | 0 (0.0%) | 0 (0.0%) |
| 5 to 17 Years | 0 (0.0%) | 0 (0.0%) |
| 18 to 34 Years | 0 (0.0%) | 0 (0.0%) |
| 35 to 64 Years | 0 (0.0%) | 4 (12.9%) |
| 65 to 74 Years | 0 (0.0%) | 0 (0.0%) |
| 75 Years and over | 3 (12.5%) | 0 (0.0%) |
Disability Class: Cognitive Difficulty
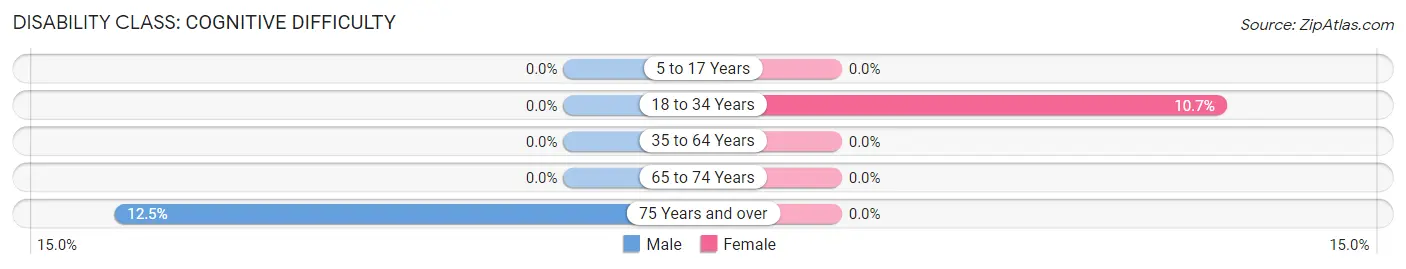
| Age Bracket | Male | Female |
| 5 to 17 Years | 0 (0.0%) | 0 (0.0%) |
| 18 to 34 Years | 0 (0.0%) | 3 (10.7%) |
| 35 to 64 Years | 0 (0.0%) | 0 (0.0%) |
| 65 to 74 Years | 0 (0.0%) | 0 (0.0%) |
| 75 Years and over | 3 (12.5%) | 0 (0.0%) |
Disability Class: Ambulatory Difficulty
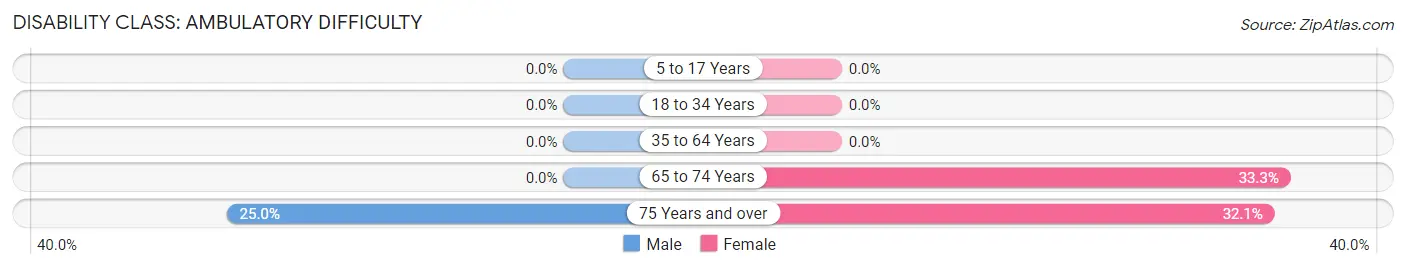
| Age Bracket | Male | Female |
| 5 to 17 Years | 0 (0.0%) | 0 (0.0%) |
| 18 to 34 Years | 0 (0.0%) | 0 (0.0%) |
| 35 to 64 Years | 0 (0.0%) | 0 (0.0%) |
| 65 to 74 Years | 0 (0.0%) | 6 (33.3%) |
| 75 Years and over | 6 (25.0%) | 9 (32.1%) |
Disability Class: Self-Care Difficulty
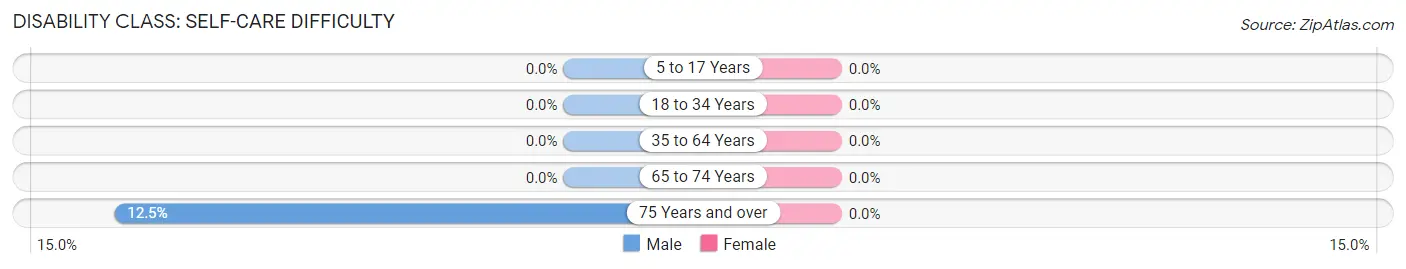
| Age Bracket | Male | Female |
| 5 to 17 Years | 0 (0.0%) | 0 (0.0%) |
| 18 to 34 Years | 0 (0.0%) | 0 (0.0%) |
| 35 to 64 Years | 0 (0.0%) | 0 (0.0%) |
| 65 to 74 Years | 0 (0.0%) | 0 (0.0%) |
| 75 Years and over | 3 (12.5%) | 0 (0.0%) |
Technology Access in Meansville
Computing Device Access in Meansville
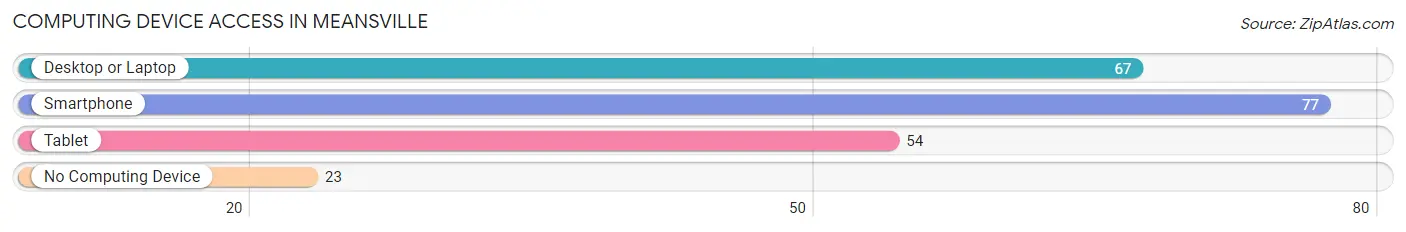
| Device Type | # Households | % Households |
| Desktop or Laptop | 67 | 67.0% |
| Smartphone | 77 | 77.0% |
| Tablet | 54 | 54.0% |
| No Computing Device | 23 | 23.0% |
| Total | 100 | 100.0% |
Internet Access in Meansville
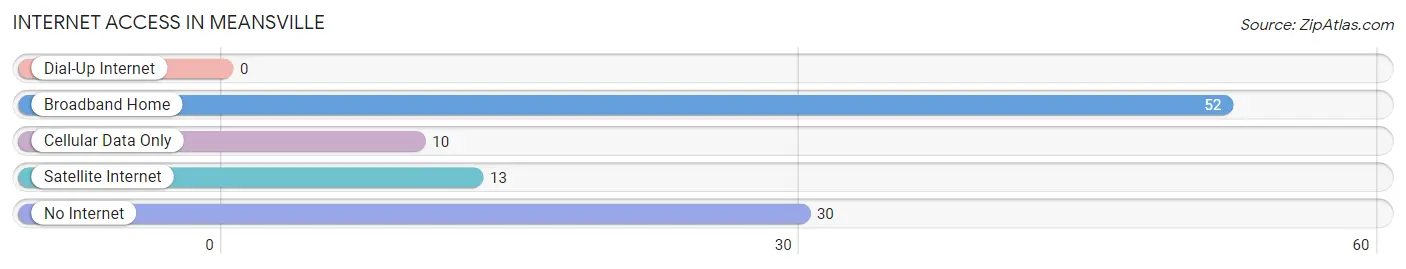
| Internet Type | # Households | % Households |
| Dial-Up Internet | 0 | 0.0% |
| Broadband Home | 52 | 52.0% |
| Cellular Data Only | 10 | 10.0% |
| Satellite Internet | 13 | 13.0% |
| No Internet | 30 | 30.0% |
| Total | 100 | 100.0% |
Meansville Summary
Meansville, Georgia is a small town located in Pike County, Georgia, United States. It is situated about 30 miles south of Atlanta and is part of the Atlanta metropolitan area. The population of Meansville was estimated to be 1,845 in 2019.
History
Meansville was founded in 1820 by William Means, a Revolutionary War veteran. The town was originally called Meansville Station, and was a stop on the Macon and Western Railroad. The town was incorporated in 1883 and was named after its founder.
Meansville was a small farming community until the 1950s, when the town began to experience rapid growth due to the expansion of the Atlanta metropolitan area. The town was home to several businesses, including a cotton gin, a sawmill, and a grist mill.
Geography
Meansville is located in Pike County, Georgia, about 30 miles south of Atlanta. The town is situated in the Piedmont region of Georgia, and is surrounded by rolling hills and forests. The town is located on the banks of the Ocmulgee River, which flows through the town.
The climate in Meansville is humid subtropical, with hot, humid summers and mild winters. The average annual temperature is around 70 degrees Fahrenheit, and the average annual precipitation is around 50 inches.
Economy
Meansville’s economy is largely based on agriculture and manufacturing. The town is home to several farms, which produce a variety of crops, including corn, soybeans, cotton, and peanuts. The town is also home to several manufacturing companies, which produce a variety of products, including furniture, textiles, and automotive parts.
The town is also home to several small businesses, including restaurants, shops, and services. The town is also home to several tourist attractions, including the Meansville Historical Museum and the Meansville Railroad Museum.
Demographics
As of 2019, the population of Meansville was estimated to be 1,845. The town has a diverse population, with a majority of the population being white (77.3%), followed by African American (17.2%), Hispanic (2.7%), and Asian (1.8%). The median household income in Meansville is $41,945, and the median home value is $133,400.
Meansville is served by the Pike County School District, which includes four elementary schools, one middle school, and one high school. The town is also home to several churches, including the Meansville United Methodist Church and the Meansville Baptist Church.
Meansville is a small town with a rich history and a diverse population. The town is home to several businesses and tourist attractions, and is a great place to live and work.
Common Questions
What is Per Capita Income in Meansville?
Per Capita income in Meansville is $30,939.
What is the Median Family Income in Meansville?
Median Family Income in Meansville is $51,250.
What is the Median Household income in Meansville?
Median Household Income in Meansville is $43,750.
What is Income or Wage Gap in Meansville?
Income or Wage Gap in Meansville is 29.7%.
Women in Meansville earn 70.3 cents for every dollar earned by a man.
What is Inequality or Gini Index in Meansville?
Inequality or Gini Index in Meansville is 0.41.
What is the Total Population of Meansville?
Total Population of Meansville is 239.
What is the Total Male Population of Meansville?
Total Male Population of Meansville is 107.
What is the Total Female Population of Meansville?
Total Female Population of Meansville is 132.
What is the Ratio of Males per 100 Females in Meansville?
There are 81.06 Males per 100 Females in Meansville.
What is the Ratio of Females per 100 Males in Meansville?
There are 123.36 Females per 100 Males in Meansville.
What is the Median Population Age in Meansville?
Median Population Age in Meansville is 44.4 Years.
What is the Average Family Size in Meansville
Average Family Size in Meansville is 2.7 People.
What is the Average Household Size in Meansville
Average Household Size in Meansville is 2.4 People.
How Large is the Labor Force in Meansville?
There are 107 People in the Labor Forcein in Meansville.
What is the Percentage of People in the Labor Force in Meansville?
52.2% of People are in the Labor Force in Meansville.
What is the Unemployment Rate in Meansville?
Unemployment Rate in Meansville is 20.6%.