Sale City, GA Map & Demographics
Sale City Map
Sale City Overview
$19,684
PER CAPITA INCOME
$60,208
AVG FAMILY INCOME
$43,571
AVG HOUSEHOLD INCOME
13.0%
WAGE / INCOME GAP [ % ]
87.0¢/ $1
WAGE / INCOME GAP [ $ ]
0.42
INEQUALITY / GINI INDEX
415
TOTAL POPULATION
172
MALE POPULATION
243
FEMALE POPULATION
70.78
MALES / 100 FEMALES
141.28
FEMALES / 100 MALES
43.0
MEDIAN AGE
3.0
AVG FAMILY SIZE
2.6
AVG HOUSEHOLD SIZE
166
LABOR FORCE [ PEOPLE ]
54.2%
PERCENT IN LABOR FORCE
4.8%
UNEMPLOYMENT RATE
Sale City Zip Codes
Sale City Area Codes
Income in Sale City
Income Overview in Sale City
Per Capita Income in Sale City is $19,684, while median incomes of families and households are $60,208 and $43,571 respectively.
| Characteristic | Number | Measure |
| Per Capita Income | 415 | $19,684 |
| Median Family Income | 119 | $60,208 |
| Mean Family Income | 119 | $68,480 |
| Median Household Income | 158 | $43,571 |
| Mean Household Income | 158 | $57,151 |
| Income Deficit | 119 | $0 |
| Wage / Income Gap (%) | 415 | 12.98% |
| Wage / Income Gap ($) | 415 | 87.02¢ per $1 |
| Gini / Inequality Index | 415 | 0.42 |
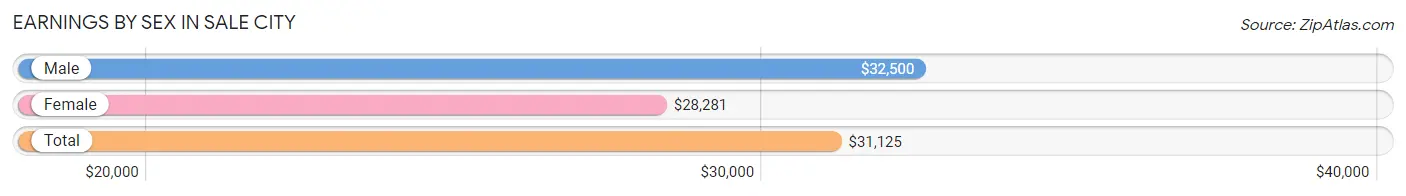
Earnings by Sex in Sale City
Average Earnings in Sale City are $31,125, $32,500 for men and $28,281 for women, a difference of 13.0%.
| Sex | Number | Average Earnings |
| Male | 86 (52.1%) | $32,500 |
| Female | 79 (47.9%) | $28,281 |
| Total | 165 (100.0%) | $31,125 |
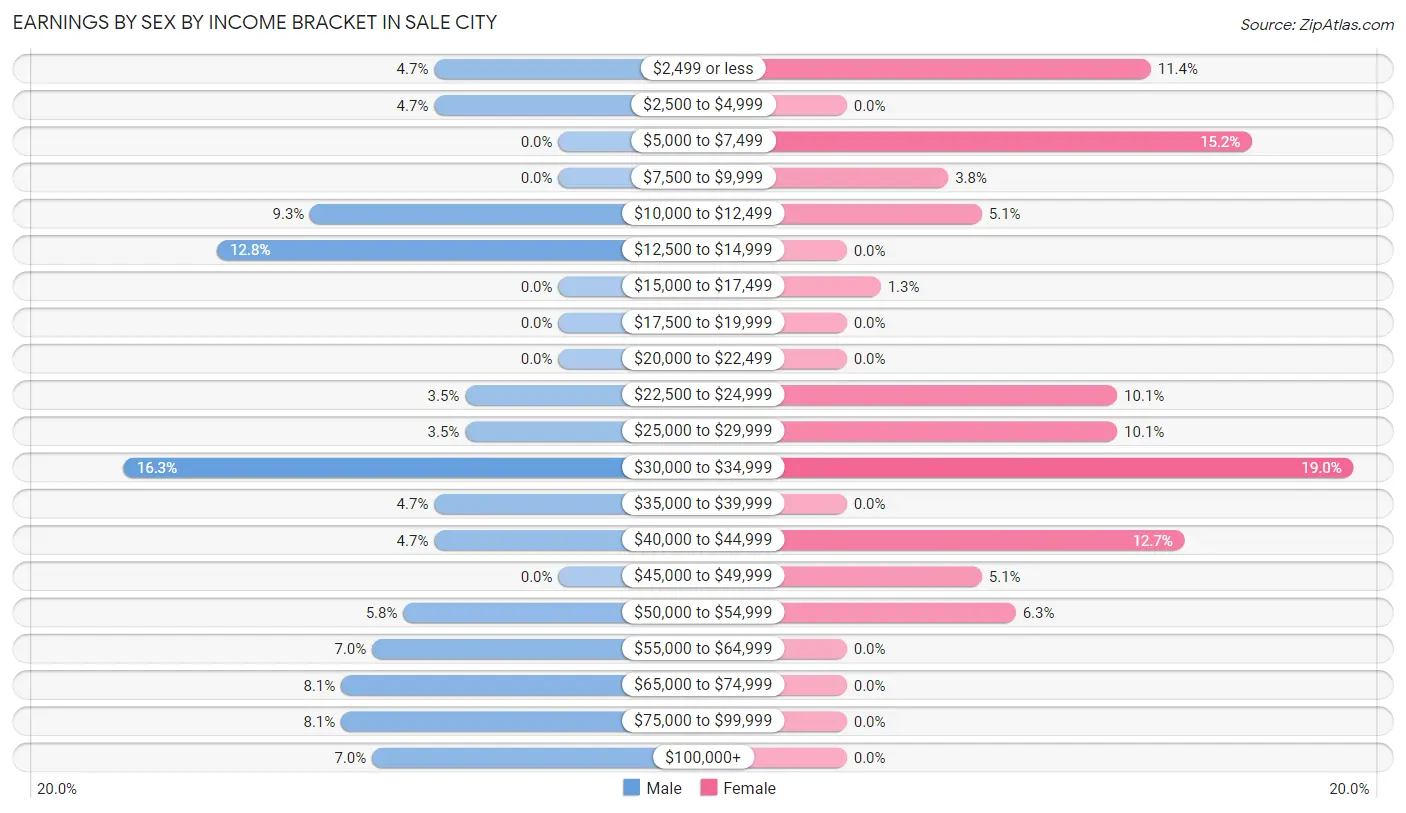
Earnings by Sex by Income Bracket in Sale City
The most common earnings brackets in Sale City are $30,000 to $34,999 for men (14 | 16.3%) and $30,000 to $34,999 for women (15 | 19.0%).
| Income | Male | Female |
| $2,499 or less | 4 (4.6%) | 9 (11.4%) |
| $2,500 to $4,999 | 4 (4.6%) | 0 (0.0%) |
| $5,000 to $7,499 | 0 (0.0%) | 12 (15.2%) |
| $7,500 to $9,999 | 0 (0.0%) | 3 (3.8%) |
| $10,000 to $12,499 | 8 (9.3%) | 4 (5.1%) |
| $12,500 to $14,999 | 11 (12.8%) | 0 (0.0%) |
| $15,000 to $17,499 | 0 (0.0%) | 1 (1.3%) |
| $17,500 to $19,999 | 0 (0.0%) | 0 (0.0%) |
| $20,000 to $22,499 | 0 (0.0%) | 0 (0.0%) |
| $22,500 to $24,999 | 3 (3.5%) | 8 (10.1%) |
| $25,000 to $29,999 | 3 (3.5%) | 8 (10.1%) |
| $30,000 to $34,999 | 14 (16.3%) | 15 (19.0%) |
| $35,000 to $39,999 | 4 (4.6%) | 0 (0.0%) |
| $40,000 to $44,999 | 4 (4.6%) | 10 (12.7%) |
| $45,000 to $49,999 | 0 (0.0%) | 4 (5.1%) |
| $50,000 to $54,999 | 5 (5.8%) | 5 (6.3%) |
| $55,000 to $64,999 | 6 (7.0%) | 0 (0.0%) |
| $65,000 to $74,999 | 7 (8.1%) | 0 (0.0%) |
| $75,000 to $99,999 | 7 (8.1%) | 0 (0.0%) |
| $100,000+ | 6 (7.0%) | 0 (0.0%) |
| Total | 86 (100.0%) | 79 (100.0%) |
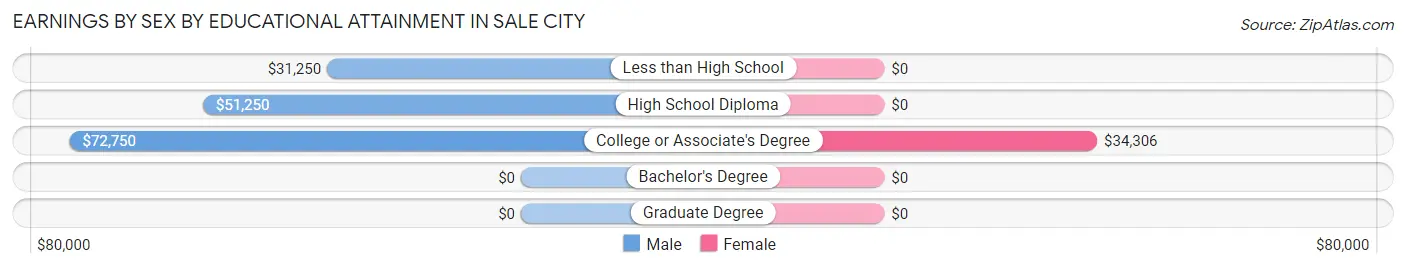
Earnings by Sex by Educational Attainment in Sale City
Average earnings in Sale City are $37,813 for men and $29,219 for women, a difference of 22.7%. Men with an educational attainment of college or associate's degree enjoy the highest average annual earnings of $72,750, while those with less than high school education earn the least with $31,250. Women with an educational attainment of college or associate's degree earn the most with the average annual earnings of $34,306, while those with college or associate's degree education have the smallest earnings of $34,306.
| Educational Attainment | Male Income | Female Income |
| Less than High School | $31,250 | $0 |
| High School Diploma | $51,250 | $0 |
| College or Associate's Degree | $72,750 | $34,306 |
| Bachelor's Degree | - | - |
| Graduate Degree | - | - |
| Total | $37,813 | $29,219 |
Family Income in Sale City
Family Income Brackets in Sale City
According to the Sale City family income data, there are 29 families falling into the $50,000 to $74,999 income range, which is the most common income bracket and makes up 24.4% of all families.
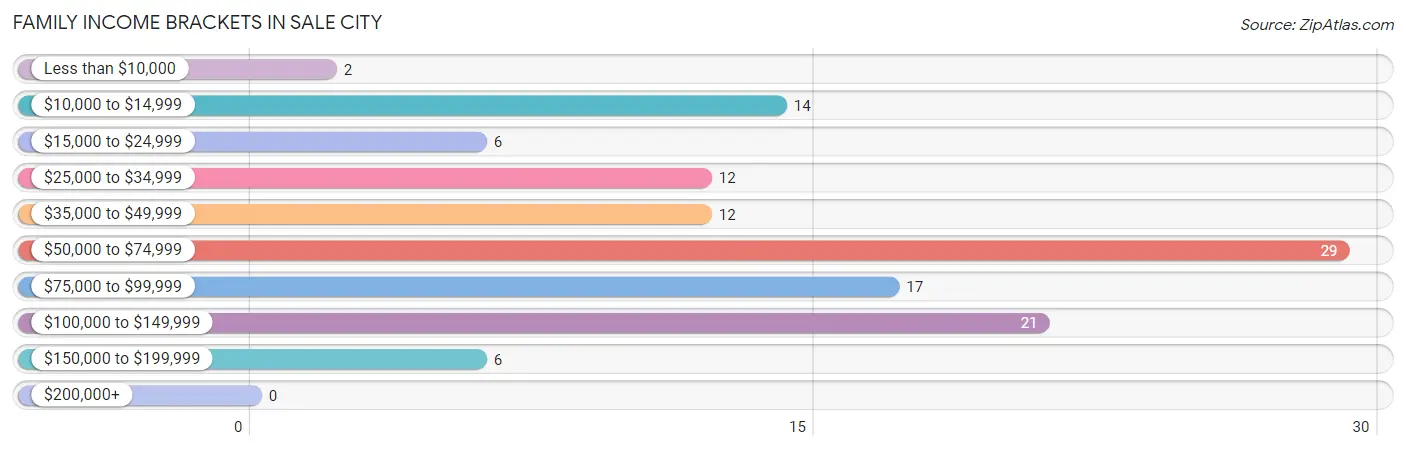
| Income Bracket | # Families | % Families |
| Less than $10,000 | 2 | 1.7% |
| $10,000 to $14,999 | 14 | 11.8% |
| $15,000 to $24,999 | 6 | 5.0% |
| $25,000 to $34,999 | 12 | 10.1% |
| $35,000 to $49,999 | 12 | 10.1% |
| $50,000 to $74,999 | 29 | 24.4% |
| $75,000 to $99,999 | 17 | 14.3% |
| $100,000 to $149,999 | 21 | 17.6% |
| $150,000 to $199,999 | 6 | 5.0% |
| $200,000+ | 0 | 0.0% |
Family Income by Famaliy Size in Sale City
4-person families (31 | 26.1%) account for the highest median family income in Sale City with $138,125 per family, while 4-person families (31 | 26.1%) have the highest median income of $34,531 per family member.
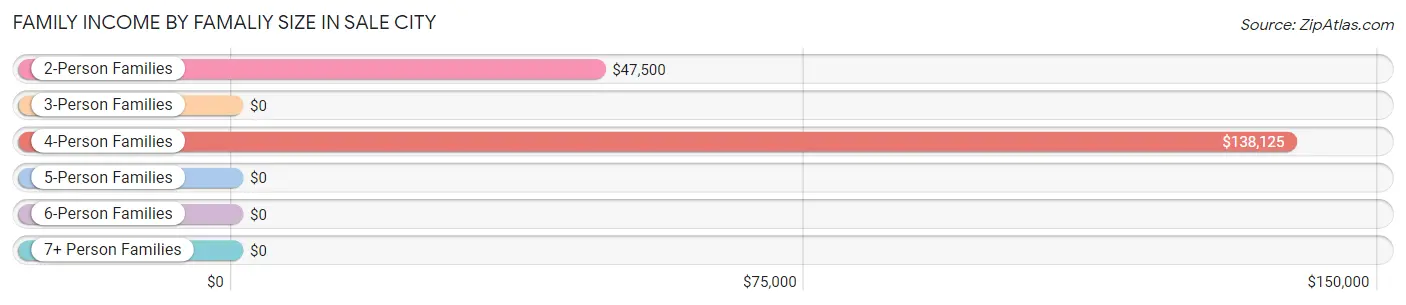
| Income Bracket | # Families | Median Income |
| 2-Person Families | 48 (40.3%) | $47,500 |
| 3-Person Families | 32 (26.9%) | $0 |
| 4-Person Families | 31 (26.1%) | $138,125 |
| 5-Person Families | 8 (6.7%) | $0 |
| 6-Person Families | 0 (0.0%) | $0 |
| 7+ Person Families | 0 (0.0%) | $0 |
| Total | 119 (100.0%) | $60,208 |
Family Income by Number of Earners in Sale City
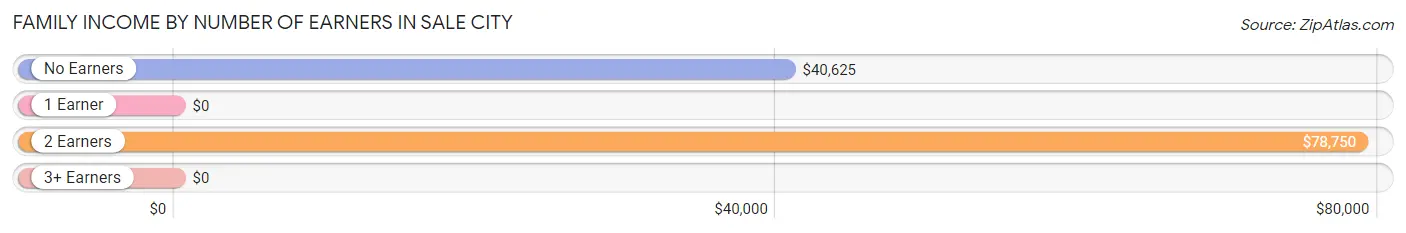
| Number of Earners | # Families | Median Income |
| No Earners | 23 (19.3%) | $40,625 |
| 1 Earner | 56 (47.1%) | $0 |
| 2 Earners | 37 (31.1%) | $78,750 |
| 3+ Earners | 3 (2.5%) | $0 |
| Total | 119 (100.0%) | $60,208 |
Household Income in Sale City
Household Income Brackets in Sale City
With 29 households falling in the category, the $50,000 to $74,999 income range is the most frequent in Sale City, accounting for 18.3% of all households.
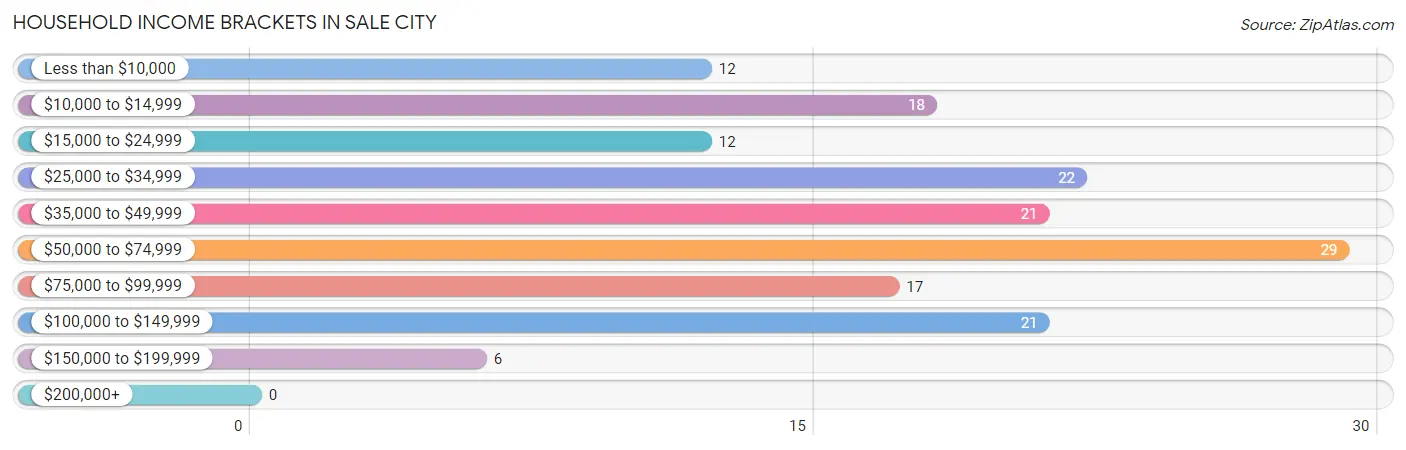
| Income Bracket | # Households | % Households |
| Less than $10,000 | 12 | 7.6% |
| $10,000 to $14,999 | 18 | 11.4% |
| $15,000 to $24,999 | 12 | 7.6% |
| $25,000 to $34,999 | 22 | 13.9% |
| $35,000 to $49,999 | 21 | 13.3% |
| $50,000 to $74,999 | 29 | 18.4% |
| $75,000 to $99,999 | 17 | 10.8% |
| $100,000 to $149,999 | 21 | 13.3% |
| $150,000 to $199,999 | 6 | 3.8% |
| $200,000+ | 0 | 0.0% |
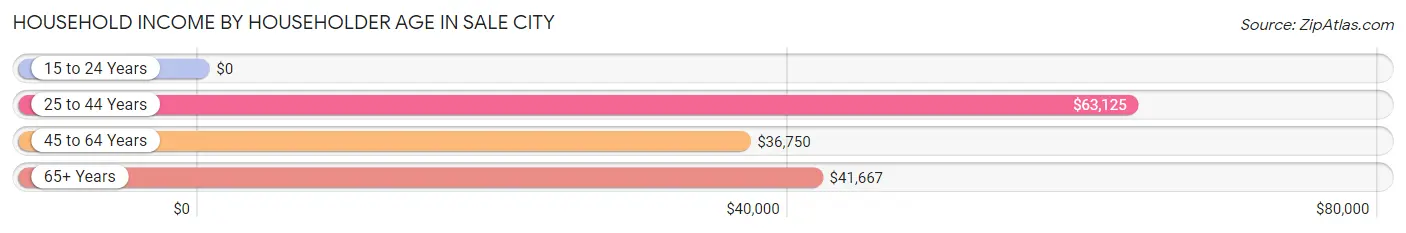
Household Income by Householder Age in Sale City
The median household income in Sale City is $43,571, with the highest median household income of $63,125 found in the 25 to 44 years age bracket for the primary householder. A total of 65 households (41.1%) fall into this category. Meanwhile, the 15 to 24 years age bracket for the primary householder has the lowest median household income of $0, with 2 households (1.3%) in this group.
| Income Bracket | # Households | Median Income |
| 15 to 24 Years | 2 (1.3%) | $0 |
| 25 to 44 Years | 65 (41.1%) | $63,125 |
| 45 to 64 Years | 47 (29.7%) | $36,750 |
| 65+ Years | 44 (27.9%) | $41,667 |
| Total | 158 (100.0%) | $43,571 |
Poverty in Sale City
Income Below Poverty by Sex and Age in Sale City
With 15.1% poverty level for males and 31.3% for females among the residents of Sale City, under 5 year old males and 6 to 11 year old females are the most vulnerable to poverty, with 2 males (50.0%) and 21 females (80.8%) in their respective age groups living below the poverty level.
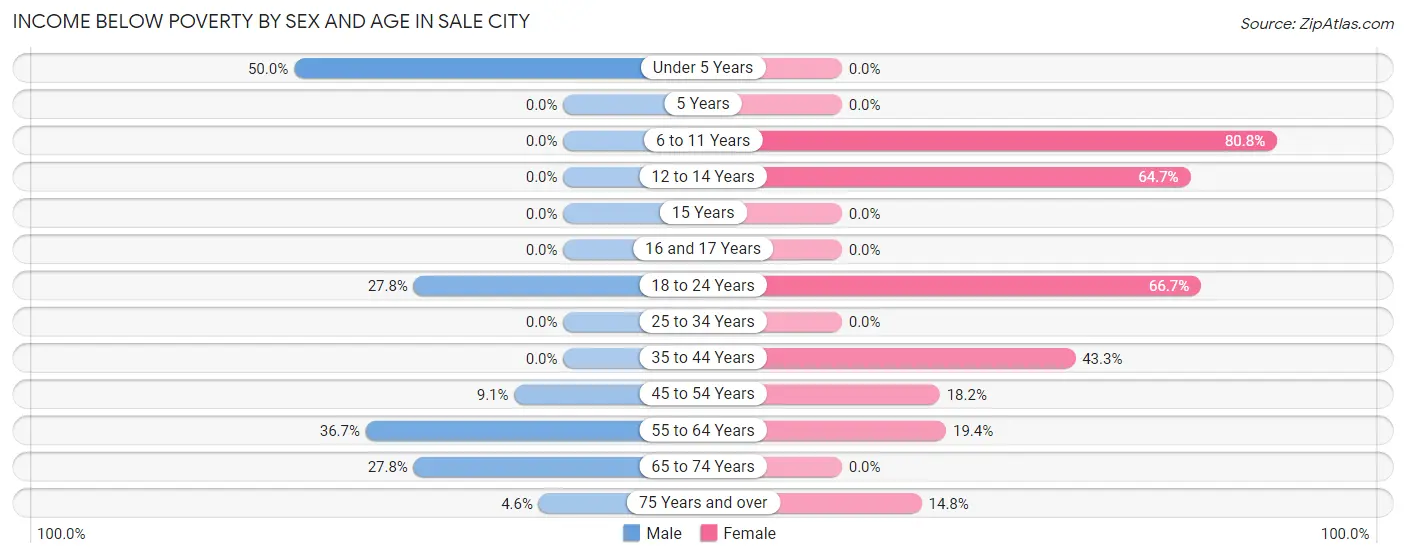
| Age Bracket | Male | Female |
| Under 5 Years | 2 (50.0%) | 0 (0.0%) |
| 5 Years | 0 (0.0%) | 0 (0.0%) |
| 6 to 11 Years | 0 (0.0%) | 21 (80.8%) |
| 12 to 14 Years | 0 (0.0%) | 22 (64.7%) |
| 15 Years | 0 (0.0%) | 0 (0.0%) |
| 16 and 17 Years | 0 (0.0%) | 0 (0.0%) |
| 18 to 24 Years | 5 (27.8%) | 4 (66.7%) |
| 25 to 34 Years | 0 (0.0%) | 0 (0.0%) |
| 35 to 44 Years | 0 (0.0%) | 13 (43.3%) |
| 45 to 54 Years | 2 (9.1%) | 6 (18.2%) |
| 55 to 64 Years | 11 (36.7%) | 6 (19.4%) |
| 65 to 74 Years | 5 (27.8%) | 0 (0.0%) |
| 75 Years and over | 1 (4.5%) | 4 (14.8%) |
| Total | 26 (15.1%) | 76 (31.3%) |
Income Above Poverty by Sex and Age in Sale City
According to the poverty statistics in Sale City, males aged 5 years and females aged under 5 years are the age groups that are most secure financially, with 100.0% of males and 100.0% of females in these age groups living above the poverty line.
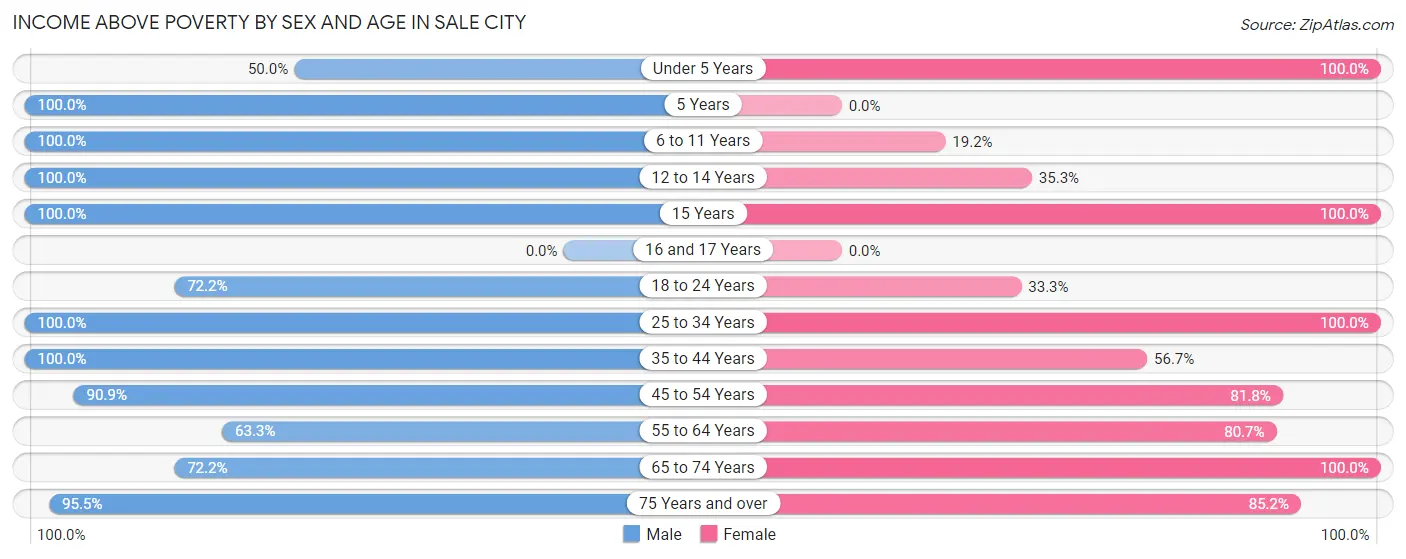
| Age Bracket | Male | Female |
| Under 5 Years | 2 (50.0%) | 19 (100.0%) |
| 5 Years | 6 (100.0%) | 0 (0.0%) |
| 6 to 11 Years | 5 (100.0%) | 5 (19.2%) |
| 12 to 14 Years | 6 (100.0%) | 12 (35.3%) |
| 15 Years | 4 (100.0%) | 5 (100.0%) |
| 16 and 17 Years | 0 (0.0%) | 0 (0.0%) |
| 18 to 24 Years | 13 (72.2%) | 2 (33.3%) |
| 25 to 34 Years | 11 (100.0%) | 27 (100.0%) |
| 35 to 44 Years | 26 (100.0%) | 17 (56.7%) |
| 45 to 54 Years | 20 (90.9%) | 27 (81.8%) |
| 55 to 64 Years | 19 (63.3%) | 25 (80.6%) |
| 65 to 74 Years | 13 (72.2%) | 5 (100.0%) |
| 75 Years and over | 21 (95.5%) | 23 (85.2%) |
| Total | 146 (84.9%) | 167 (68.7%) |
Income Below Poverty Among Married-Couple Families in Sale City
The poverty statistics for married-couple families in Sale City show that 4.6% or 4 of the total 86 families live below the poverty line. Families with no children have the highest poverty rate of 8.0%, comprising of 4 families. On the other hand, families with 1 or 2 children have the lowest poverty rate of 0.0%, which includes 0 families.
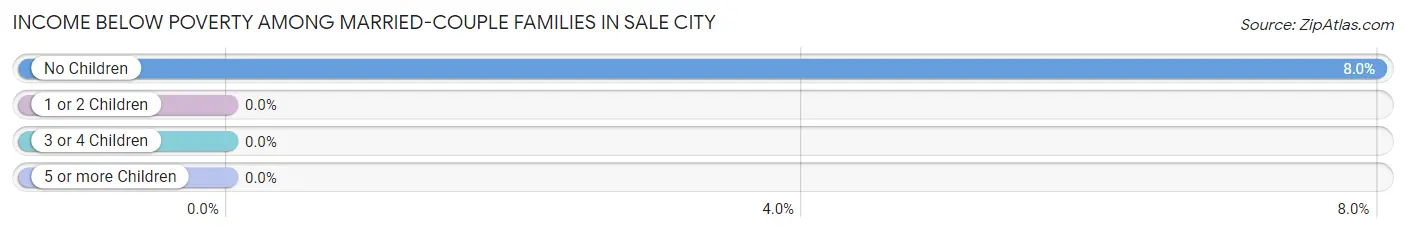
| Children | Above Poverty | Below Poverty |
| No Children | 46 (92.0%) | 4 (8.0%) |
| 1 or 2 Children | 31 (100.0%) | 0 (0.0%) |
| 3 or 4 Children | 5 (100.0%) | 0 (0.0%) |
| 5 or more Children | 0 (0.0%) | 0 (0.0%) |
| Total | 82 (95.4%) | 4 (4.6%) |
Income Below Poverty Among Single-Parent Households in Sale City
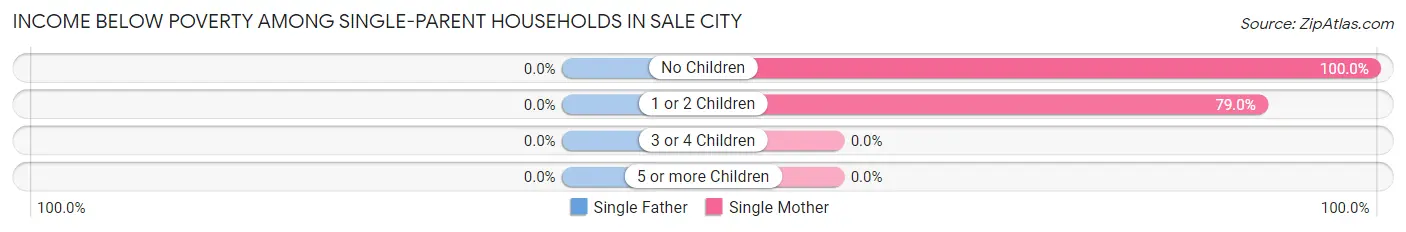
| Children | Single Father | Single Mother |
| No Children | 0 (0.0%) | 1 (100.0%) |
| 1 or 2 Children | 0 (0.0%) | 15 (78.9%) |
| 3 or 4 Children | 0 (0.0%) | 0 (0.0%) |
| 5 or more Children | 0 (0.0%) | 0 (0.0%) |
| Total | 0 (0.0%) | 16 (80.0%) |
Income Below Poverty Among Married-Couple vs Single-Parent Households in Sale City
The poverty data for Sale City shows that 4 of the married-couple family households (4.6%) and 16 of the single-parent households (48.5%) are living below the poverty level. Within the married-couple family households, those with no children have the highest poverty rate, with 4 households (8.0%) falling below the poverty line. Among the single-parent households, those with 1 or 2 children have the highest poverty rate, with 15 household (68.2%) living below poverty.
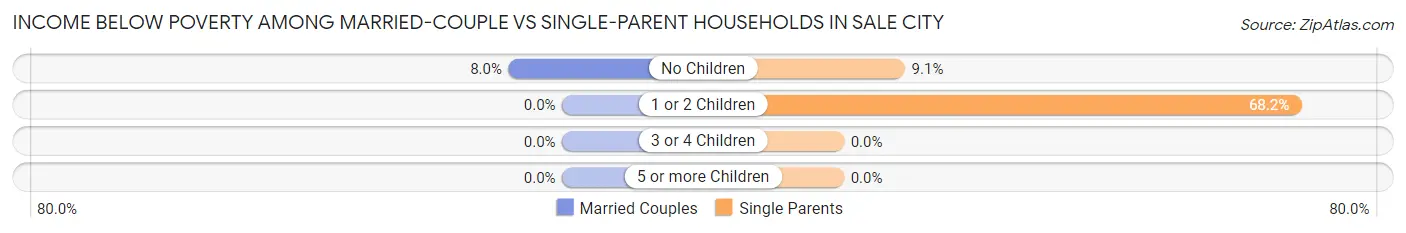
| Children | Married-Couple Families | Single-Parent Households |
| No Children | 4 (8.0%) | 1 (9.1%) |
| 1 or 2 Children | 0 (0.0%) | 15 (68.2%) |
| 3 or 4 Children | 0 (0.0%) | 0 (0.0%) |
| 5 or more Children | 0 (0.0%) | 0 (0.0%) |
| Total | 4 (4.6%) | 16 (48.5%) |
Race in Sale City
The most populous races in Sale City are White / Caucasian (368 | 88.7%), Black / African American (46 | 11.1%), and Hispanic or Latino (6 | 1.5%).

| Race | # Population | % Population |
| Asian | 0 | 0.0% |
| Black / African American | 46 | 11.1% |
| Hawaiian / Pacific | 0 | 0.0% |
| Hispanic or Latino | 6 | 1.5% |
| Native / Alaskan | 0 | 0.0% |
| White / Caucasian | 368 | 88.7% |
| Two or more Races | 1 | 0.2% |
| Some other Race | 0 | 0.0% |
| Total | 415 | 100.0% |
Ancestry in Sale City
The most populous ancestries reported in Sale City are American (115 | 27.7%), English (27 | 6.5%), German (15 | 3.6%), Irish (11 | 2.6%), and Mexican (6 | 1.5%), together accounting for 41.9% of all Sale City residents.
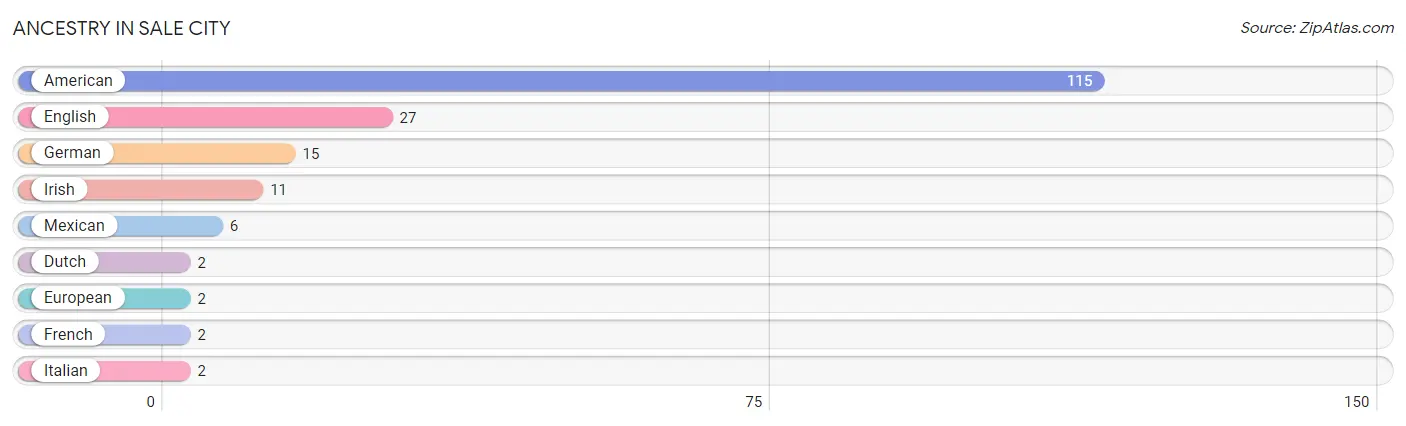
| Ancestry | # Population | % Population |
| American | 115 | 27.7% |
| Dutch | 2 | 0.5% |
| English | 27 | 6.5% |
| European | 2 | 0.5% |
| French | 2 | 0.5% |
| German | 15 | 3.6% |
| Irish | 11 | 2.6% |
| Italian | 2 | 0.5% |
| Mexican | 6 | 1.5% | View All 9 Rows |
Immigrants in Sale City
The most numerous immigrant groups reported in Sale City came from Central America (6 | 1.5%), Latin America (6 | 1.5%), Mexico (6 | 1.5%), Europe (2 | 0.5%), and Germany (2 | 0.5%), together accounting for 5.3% of all Sale City residents.
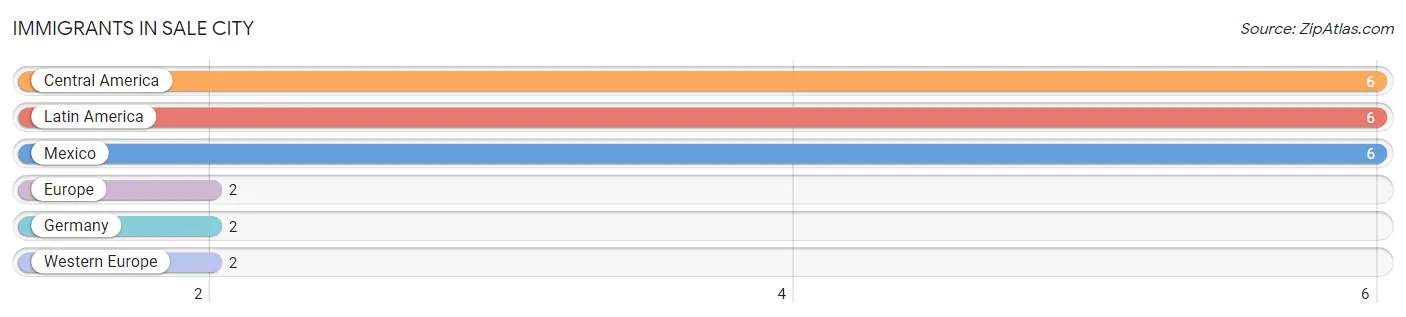
| Immigration Origin | # Population | % Population |
| Central America | 6 | 1.5% |
| Europe | 2 | 0.5% |
| Germany | 2 | 0.5% |
| Latin America | 6 | 1.5% |
| Mexico | 6 | 1.5% |
| Western Europe | 2 | 0.5% | View All 6 Rows |
Sex and Age in Sale City
Sex and Age in Sale City
The most populous age groups in Sale City are 60 to 64 Years (19 | 11.1%) for men and 10 to 14 Years (35 | 14.4%) for women.
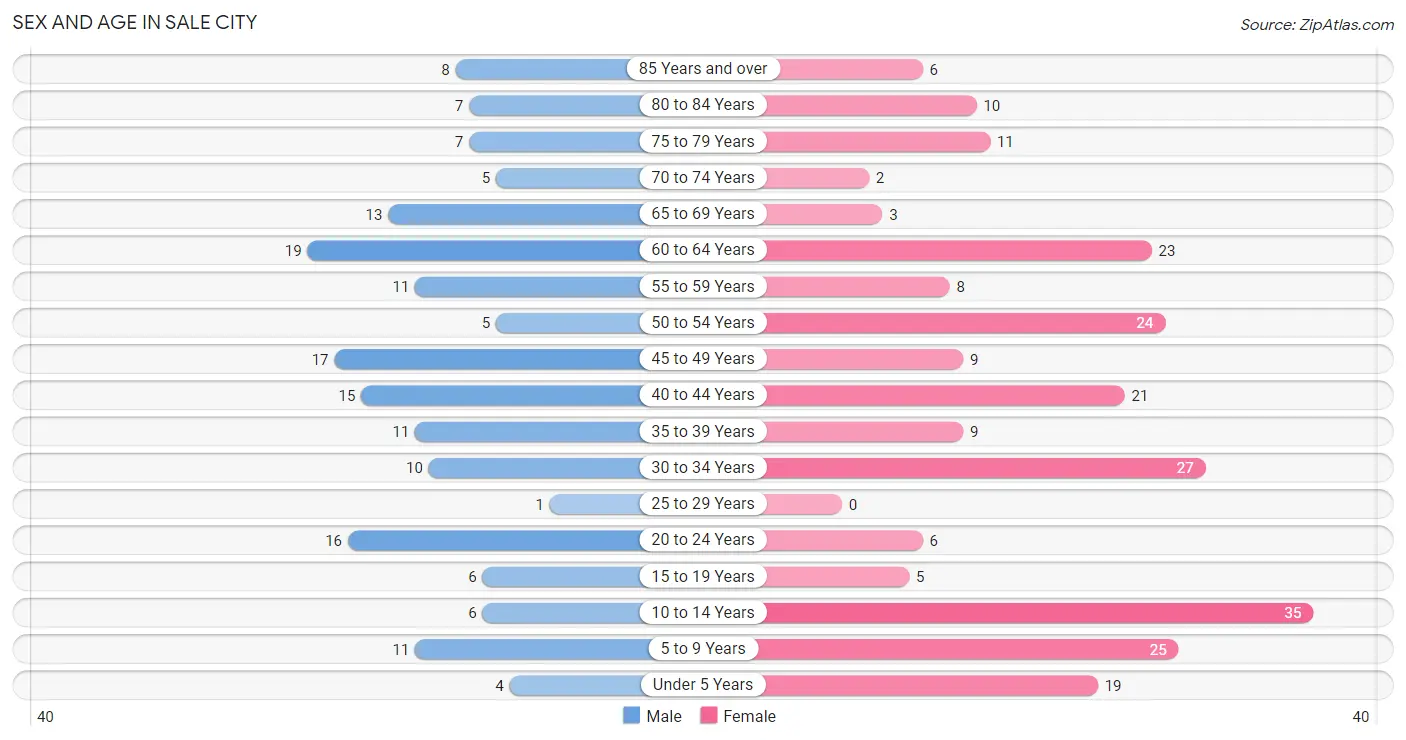
| Age Bracket | Male | Female |
| Under 5 Years | 4 (2.3%) | 19 (7.8%) |
| 5 to 9 Years | 11 (6.4%) | 25 (10.3%) |
| 10 to 14 Years | 6 (3.5%) | 35 (14.4%) |
| 15 to 19 Years | 6 (3.5%) | 5 (2.1%) |
| 20 to 24 Years | 16 (9.3%) | 6 (2.5%) |
| 25 to 29 Years | 1 (0.6%) | 0 (0.0%) |
| 30 to 34 Years | 10 (5.8%) | 27 (11.1%) |
| 35 to 39 Years | 11 (6.4%) | 9 (3.7%) |
| 40 to 44 Years | 15 (8.7%) | 21 (8.6%) |
| 45 to 49 Years | 17 (9.9%) | 9 (3.7%) |
| 50 to 54 Years | 5 (2.9%) | 24 (9.9%) |
| 55 to 59 Years | 11 (6.4%) | 8 (3.3%) |
| 60 to 64 Years | 19 (11.1%) | 23 (9.5%) |
| 65 to 69 Years | 13 (7.6%) | 3 (1.2%) |
| 70 to 74 Years | 5 (2.9%) | 2 (0.8%) |
| 75 to 79 Years | 7 (4.1%) | 11 (4.5%) |
| 80 to 84 Years | 7 (4.1%) | 10 (4.1%) |
| 85 Years and over | 8 (4.6%) | 6 (2.5%) |
| Total | 172 (100.0%) | 243 (100.0%) |
Families and Households in Sale City
Median Family Size in Sale City
The median family size in Sale City is 3.04 persons per family, with single female/mother families (20 | 16.8%) accounting for the largest median family size of 4.1 persons per family. On the other hand, single male/father families (13 | 10.9%) represent the smallest median family size with 2.62 persons per family.
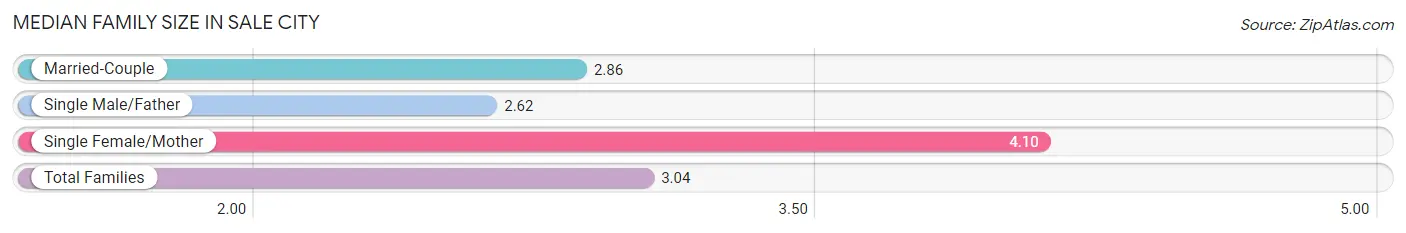
| Family Type | # Families | Family Size |
| Married-Couple | 86 (72.3%) | 2.86 |
| Single Male/Father | 13 (10.9%) | 2.62 |
| Single Female/Mother | 20 (16.8%) | 4.10 |
| Total Families | 119 (100.0%) | 3.04 |
Median Household Size in Sale City
The median household size in Sale City is 2.63 persons per household, with single female/mother households (20 | 12.7%) accounting for the largest median household size of 4.1 persons per household. non-family households (39 | 24.7%) represent the smallest median household size with 1.26 persons per household.
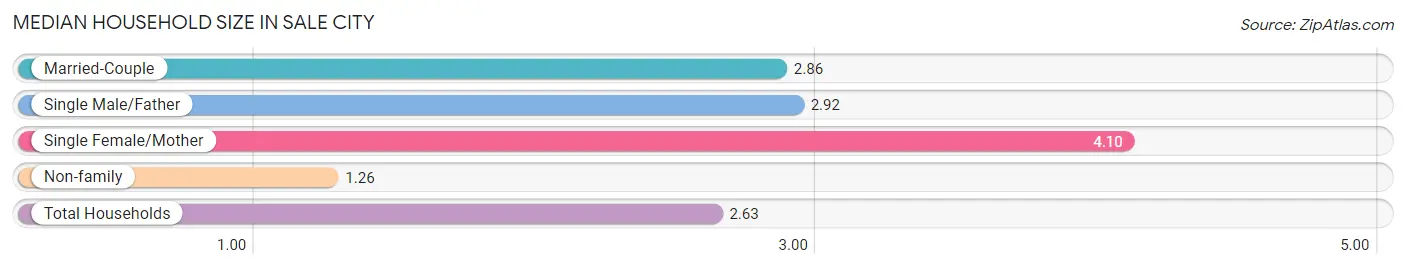
| Household Type | # Households | Household Size |
| Married-Couple | 86 (54.4%) | 2.86 |
| Single Male/Father | 13 (8.2%) | 2.92 |
| Single Female/Mother | 20 (12.7%) | 4.10 |
| Non-family | 39 (24.7%) | 1.26 |
| Total Households | 158 (100.0%) | 2.63 |
Household Size by Marriage Status in Sale City
Out of a total of 158 households in Sale City, 119 (75.3%) are family households, while 39 (24.7%) are nonfamily households. The most numerous type of family households are 2-person households, comprising 46, and the most common type of nonfamily households are 1-person households, comprising 30.
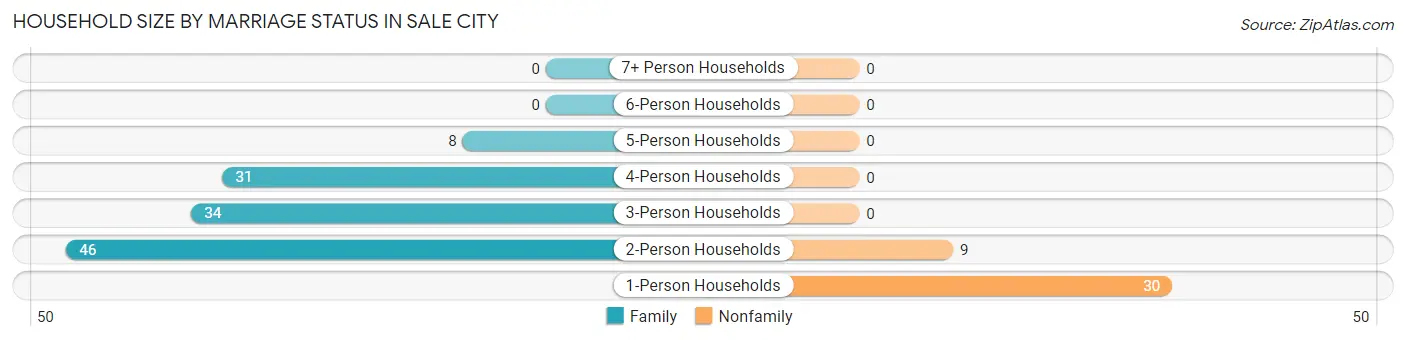
| Household Size | Family Households | Nonfamily Households |
| 1-Person Households | - | 30 (19.0%) |
| 2-Person Households | 46 (29.1%) | 9 (5.7%) |
| 3-Person Households | 34 (21.5%) | 0 (0.0%) |
| 4-Person Households | 31 (19.6%) | 0 (0.0%) |
| 5-Person Households | 8 (5.1%) | 0 (0.0%) |
| 6-Person Households | 0 (0.0%) | 0 (0.0%) |
| 7+ Person Households | 0 (0.0%) | 0 (0.0%) |
| Total | 119 (75.3%) | 39 (24.7%) |
Female Fertility in Sale City
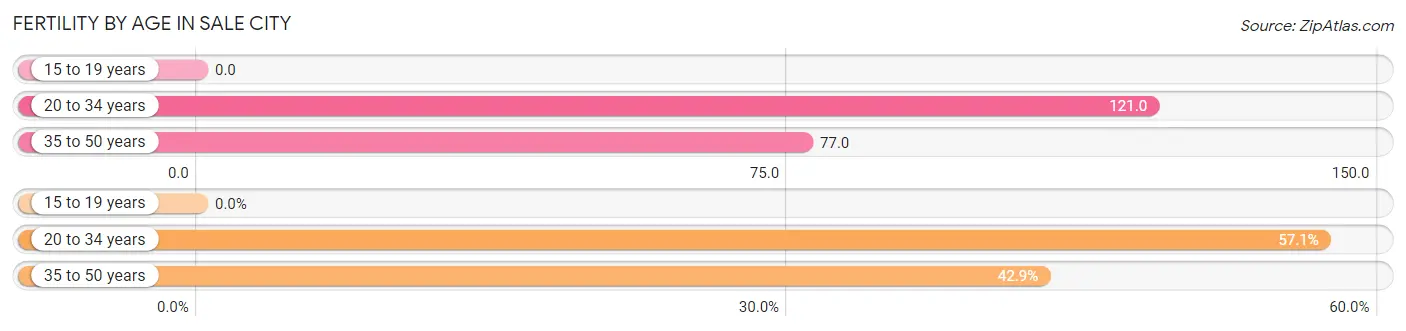
Fertility by Age in Sale City
Average fertility rate in Sale City is 91.0 births per 1,000 women. Women in the age bracket of 20 to 34 years have the highest fertility rate with 121.0 births per 1,000 women. Women in the age bracket of 20 to 34 years acount for 57.1% of all women with births.
| Age Bracket | Women with Births | Births / 1,000 Women |
| 15 to 19 years | 0 (0.0%) | 0.0 |
| 20 to 34 years | 4 (57.1%) | 121.0 |
| 35 to 50 years | 3 (42.9%) | 77.0 |
| Total | 7 (100.0%) | 91.0 |
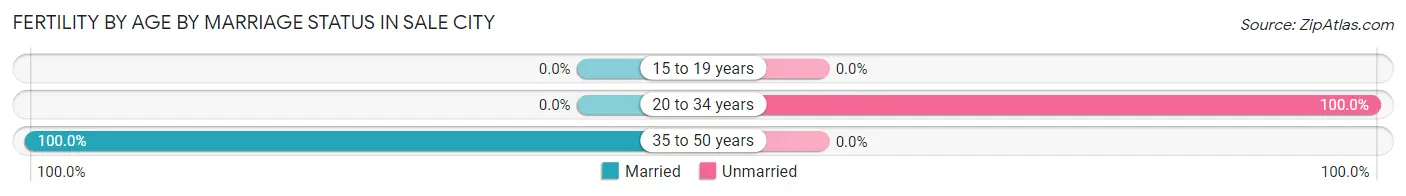
Fertility by Age by Marriage Status in Sale City
42.9% of women with births (7) in Sale City are married. The highest percentage of unmarried women with births falls into 20 to 34 years age bracket with 100.0% of them unmarried at the time of birth, while the lowest percentage of unmarried women with births belong to 35 to 50 years age bracket with 0.0% of them unmarried.
| Age Bracket | Married | Unmarried |
| 15 to 19 years | 0 (0.0%) | 0 (0.0%) |
| 20 to 34 years | 0 (0.0%) | 4 (100.0%) |
| 35 to 50 years | 3 (100.0%) | 0 (0.0%) |
| Total | 3 (42.9%) | 4 (57.1%) |
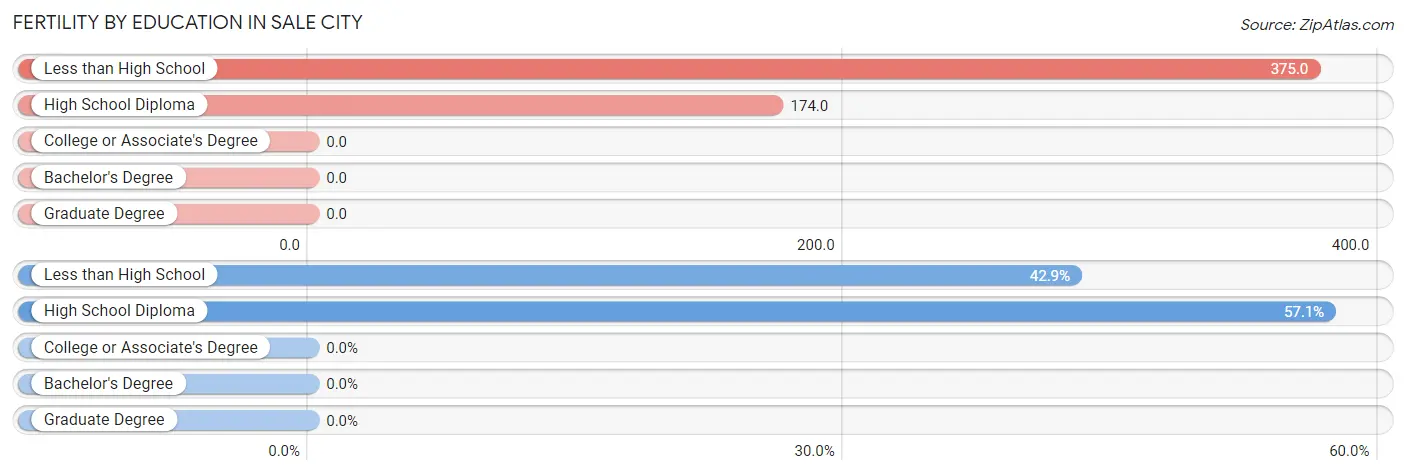
Fertility by Education in Sale City
| Educational Attainment | Women with Births | Births / 1,000 Women |
| Less than High School | 3 (42.9%) | 375.0 |
| High School Diploma | 4 (57.1%) | 174.0 |
| College or Associate's Degree | 0 (0.0%) | 0.0 |
| Bachelor's Degree | 0 (0.0%) | 0.0 |
| Graduate Degree | 0 (0.0%) | 0.0 |
| Total | 7 (100.0%) | 91.0 |
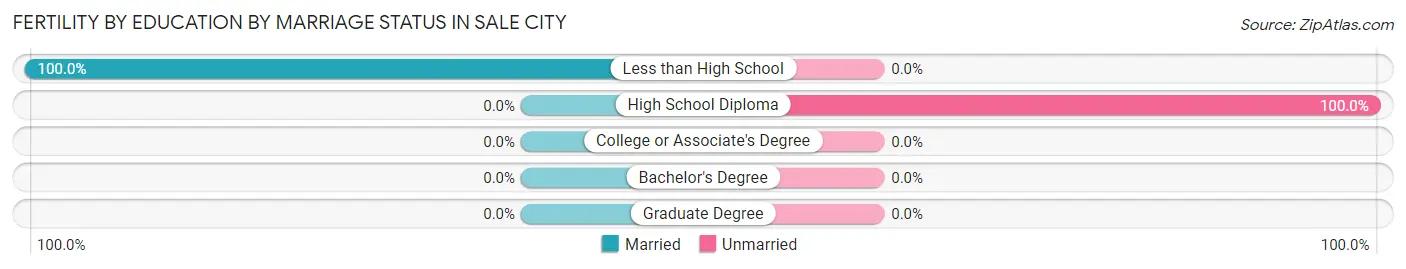
Fertility by Education by Marriage Status in Sale City
57.1% of women with births in Sale City are unmarried. Women with the educational attainment of less than high school are most likely to be married with 100.0% of them married at childbirth, while women with the educational attainment of high school diploma are least likely to be married with 100.0% of them unmarried at childbirth.
| Educational Attainment | Married | Unmarried |
| Less than High School | 3 (100.0%) | 0 (0.0%) |
| High School Diploma | 0 (0.0%) | 4 (100.0%) |
| College or Associate's Degree | 0 (0.0%) | 0 (0.0%) |
| Bachelor's Degree | 0 (0.0%) | 0 (0.0%) |
| Graduate Degree | 0 (0.0%) | 0 (0.0%) |
| Total | 3 (42.9%) | 4 (57.1%) |
Employment Characteristics in Sale City
Employment by Class of Employer in Sale City
Among the 150 employed individuals in Sale City, private company employees (108 | 72.0%), local government employees (28 | 18.7%), and not-for-profit organizations (6 | 4.0%) make up the most common classes of employment.
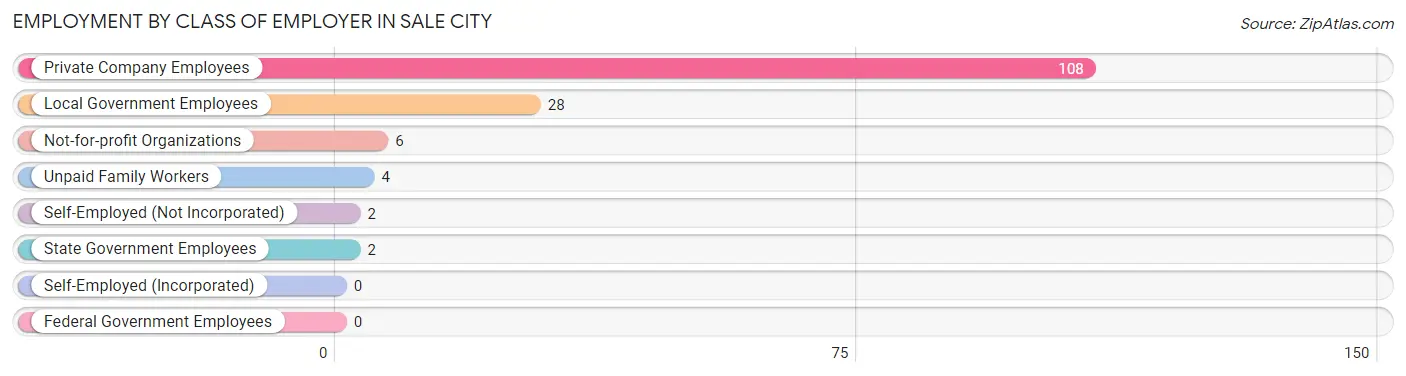
| Employer Class | # Employees | % Employees |
| Private Company Employees | 108 | 72.0% |
| Self-Employed (Incorporated) | 0 | 0.0% |
| Self-Employed (Not Incorporated) | 2 | 1.3% |
| Not-for-profit Organizations | 6 | 4.0% |
| Local Government Employees | 28 | 18.7% |
| State Government Employees | 2 | 1.3% |
| Federal Government Employees | 0 | 0.0% |
| Unpaid Family Workers | 4 | 2.7% |
| Total | 150 | 100.0% |
Employment Status by Age in Sale City
According to the labor force statistics for Sale City, out of the total population over 16 years of age (306), 54.2% or 166 individuals are in the labor force, with 4.8% or 8 of them unemployed. The age group with the highest labor force participation rate is 35 to 44 years, with 91.1% or 51 individuals in the labor force. Within the labor force, the 60 to 64 years age range has the highest percentage of unemployed individuals, with 18.2% or 2 of them being unemployed.
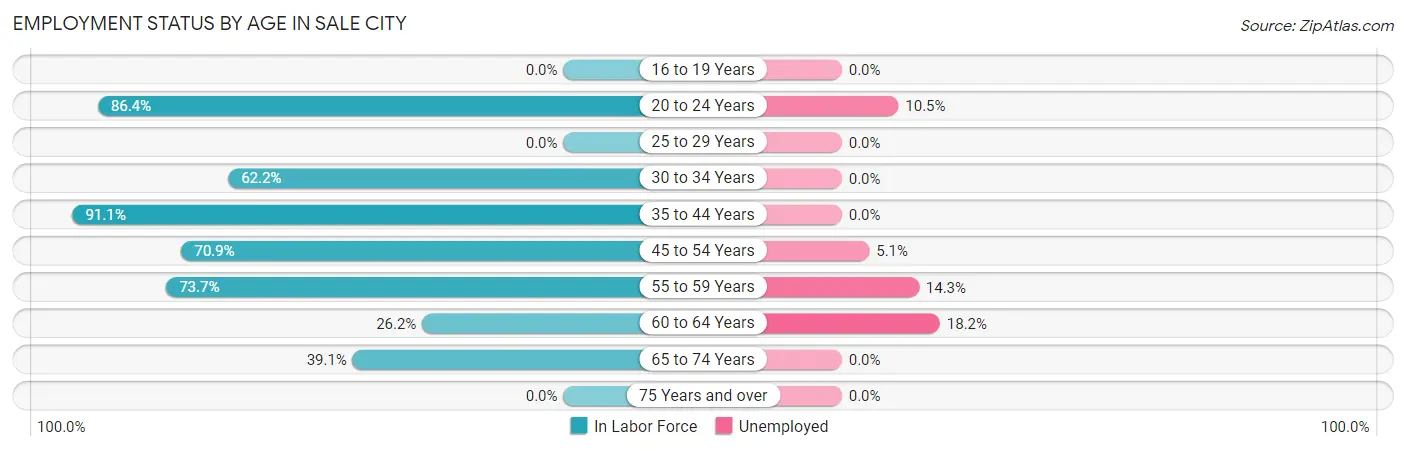
| Age Bracket | In Labor Force | Unemployed |
| 16 to 19 Years | 0 (0.0%) | 0 (0.0%) |
| 20 to 24 Years | 19 (86.4%) | 2 (10.5%) |
| 25 to 29 Years | 0 (0.0%) | 0 (0.0%) |
| 30 to 34 Years | 23 (62.2%) | 0 (0.0%) |
| 35 to 44 Years | 51 (91.1%) | 0 (0.0%) |
| 45 to 54 Years | 39 (70.9%) | 2 (5.1%) |
| 55 to 59 Years | 14 (73.7%) | 2 (14.3%) |
| 60 to 64 Years | 11 (26.2%) | 2 (18.2%) |
| 65 to 74 Years | 9 (39.1%) | 0 (0.0%) |
| 75 Years and over | 0 (0.0%) | 0 (0.0%) |
| Total | 166 (54.2%) | 8 (4.8%) |
Employment Status by Educational Attainment in Sale City
According to labor force statistics for Sale City, 65.7% of individuals (138) out of the total population between 25 and 64 years of age (210) are in the labor force, with 4.3% or 6 of them being unemployed. The group with the highest labor force participation rate are those with the educational attainment of less than high school, with 93.8% or 30 individuals in the labor force. Within the labor force, individuals with less than high school education have the highest percentage of unemployment, with 13.3% or 4 of them being unemployed.
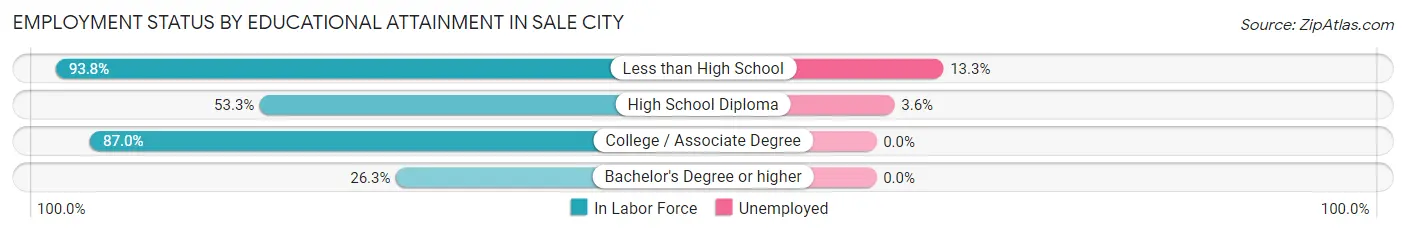
| Educational Attainment | In Labor Force | Unemployed |
| Less than High School | 30 (93.8%) | 4 (13.3%) |
| High School Diploma | 56 (53.3%) | 4 (3.6%) |
| College / Associate Degree | 47 (87.0%) | 0 (0.0%) |
| Bachelor's Degree or higher | 5 (26.3%) | 0 (0.0%) |
| Total | 138 (65.7%) | 9 (4.3%) |
Employment Occupations by Sex in Sale City
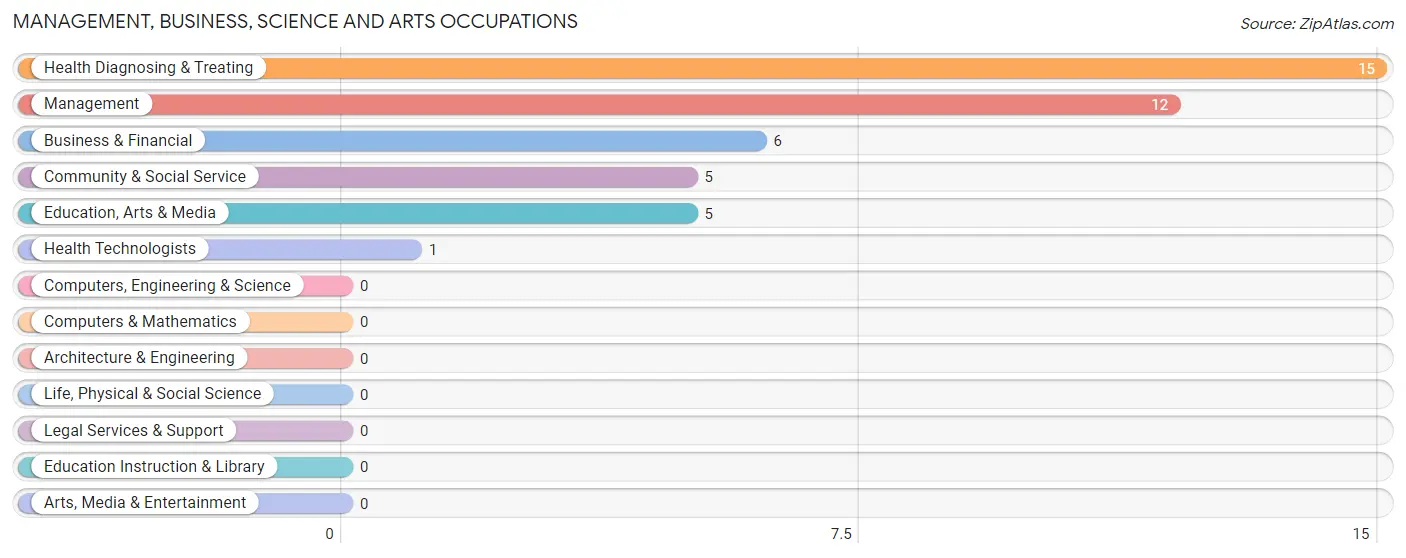
Management, Business, Science and Arts Occupations
The most common Management, Business, Science and Arts occupations in Sale City are Health Diagnosing & Treating (15 | 9.5%), Management (12 | 7.6%), Business & Financial (6 | 3.8%), Community & Social Service (5 | 3.2%), and Education, Arts & Media (5 | 3.2%).
Management, Business, Science and Arts Occupations by Sex
Within the Management, Business, Science and Arts occupations in Sale City, the most male-oriented occupations are Community & Social Service (100.0%), Education, Arts & Media (100.0%), and Management (66.7%), while the most female-oriented occupations are Business & Financial (100.0%), Health Technologists (100.0%), and Health Diagnosing & Treating (86.7%).
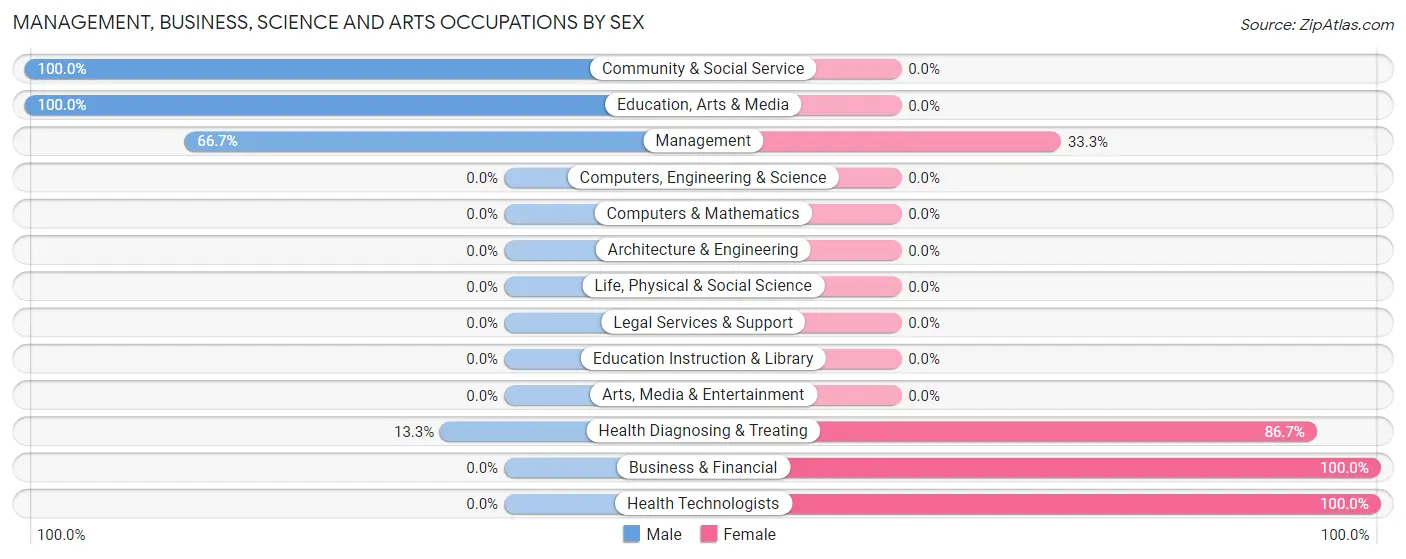
| Occupation | Male | Female |
| Management | 8 (66.7%) | 4 (33.3%) |
| Business & Financial | 0 (0.0%) | 6 (100.0%) |
| Computers, Engineering & Science | 0 (0.0%) | 0 (0.0%) |
| Computers & Mathematics | 0 (0.0%) | 0 (0.0%) |
| Architecture & Engineering | 0 (0.0%) | 0 (0.0%) |
| Life, Physical & Social Science | 0 (0.0%) | 0 (0.0%) |
| Community & Social Service | 5 (100.0%) | 0 (0.0%) |
| Education, Arts & Media | 5 (100.0%) | 0 (0.0%) |
| Legal Services & Support | 0 (0.0%) | 0 (0.0%) |
| Education Instruction & Library | 0 (0.0%) | 0 (0.0%) |
| Arts, Media & Entertainment | 0 (0.0%) | 0 (0.0%) |
| Health Diagnosing & Treating | 2 (13.3%) | 13 (86.7%) |
| Health Technologists | 0 (0.0%) | 1 (100.0%) |
| Total (Category) | 15 (39.5%) | 23 (60.5%) |
| Total (Overall) | 82 (51.9%) | 76 (48.1%) |
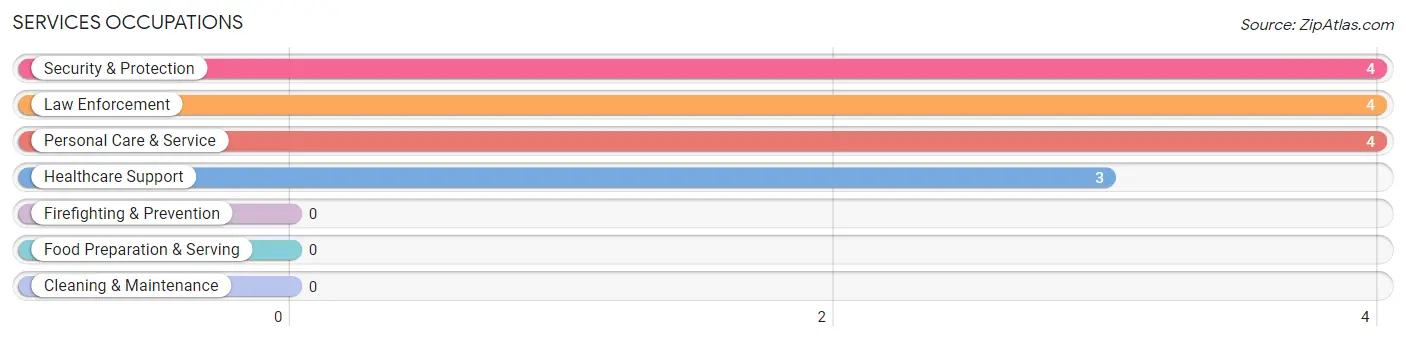
Services Occupations
The most common Services occupations in Sale City are Security & Protection (4 | 2.5%), Law Enforcement (4 | 2.5%), Personal Care & Service (4 | 2.5%), and Healthcare Support (3 | 1.9%).
Services Occupations by Sex
Within the Services occupations in Sale City, the most male-oriented occupations are Security & Protection (100.0%), and Law Enforcement (100.0%), while the most female-oriented occupations are Healthcare Support (100.0%), and Personal Care & Service (100.0%).
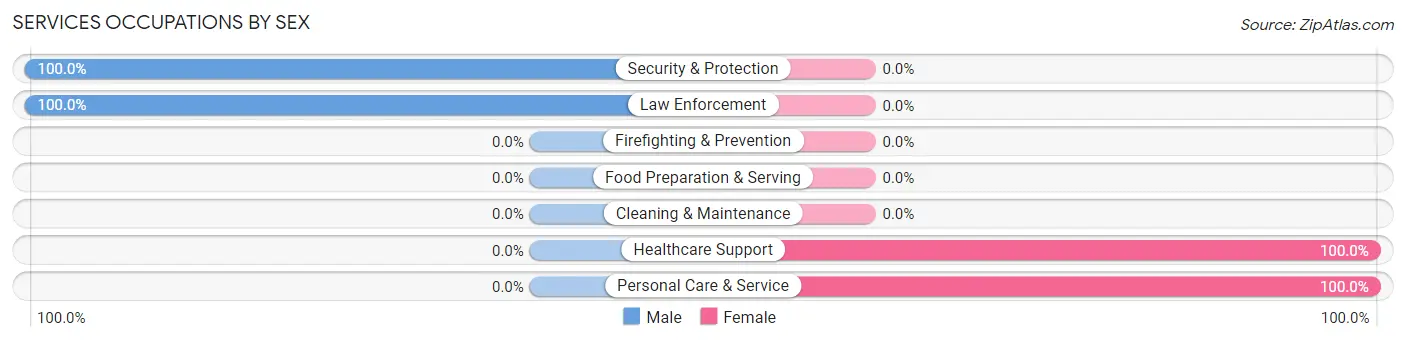
| Occupation | Male | Female |
| Healthcare Support | 0 (0.0%) | 3 (100.0%) |
| Security & Protection | 4 (100.0%) | 0 (0.0%) |
| Firefighting & Prevention | 0 (0.0%) | 0 (0.0%) |
| Law Enforcement | 4 (100.0%) | 0 (0.0%) |
| Food Preparation & Serving | 0 (0.0%) | 0 (0.0%) |
| Cleaning & Maintenance | 0 (0.0%) | 0 (0.0%) |
| Personal Care & Service | 0 (0.0%) | 4 (100.0%) |
| Total (Category) | 4 (36.4%) | 7 (63.6%) |
| Total (Overall) | 82 (51.9%) | 76 (48.1%) |
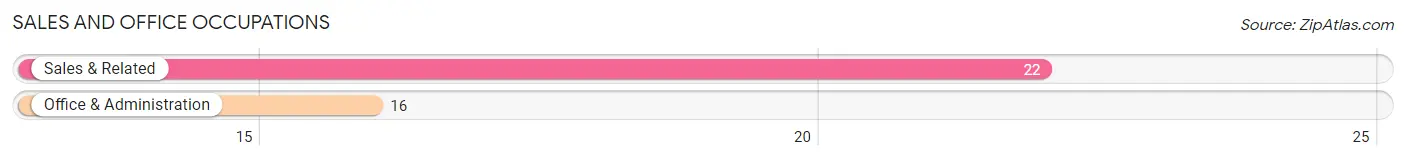
Sales and Office Occupations
The most common Sales and Office occupations in Sale City are Sales & Related (22 | 13.9%), and Office & Administration (16 | 10.1%).
Sales and Office Occupations by Sex
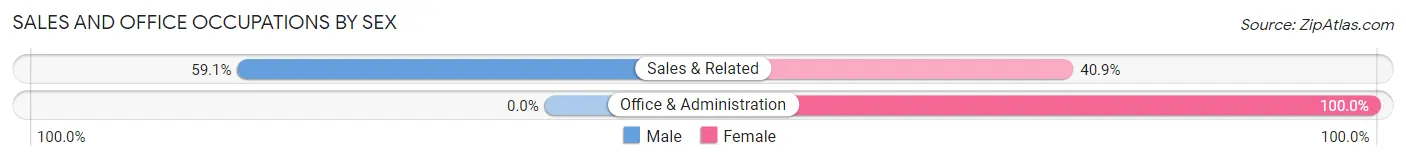
| Occupation | Male | Female |
| Sales & Related | 13 (59.1%) | 9 (40.9%) |
| Office & Administration | 0 (0.0%) | 16 (100.0%) |
| Total (Category) | 13 (34.2%) | 25 (65.8%) |
| Total (Overall) | 82 (51.9%) | 76 (48.1%) |
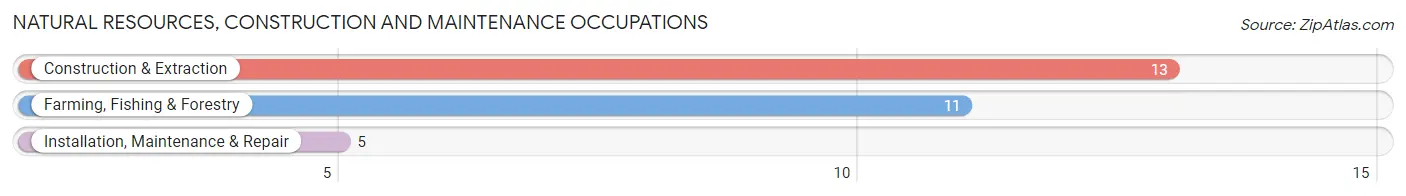
Natural Resources, Construction and Maintenance Occupations
The most common Natural Resources, Construction and Maintenance occupations in Sale City are Construction & Extraction (13 | 8.2%), Farming, Fishing & Forestry (11 | 7.0%), and Installation, Maintenance & Repair (5 | 3.2%).
Natural Resources, Construction and Maintenance Occupations by Sex
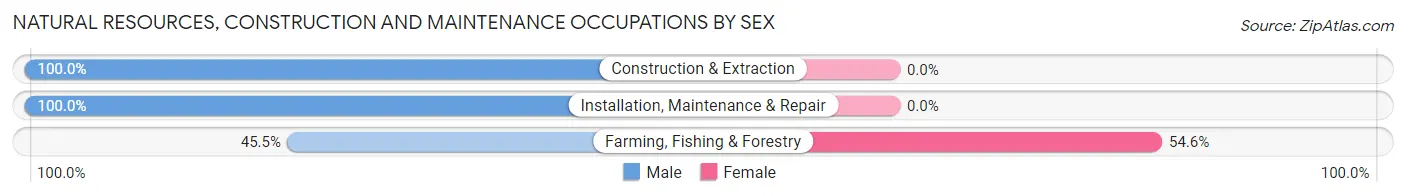
| Occupation | Male | Female |
| Farming, Fishing & Forestry | 5 (45.5%) | 6 (54.5%) |
| Construction & Extraction | 13 (100.0%) | 0 (0.0%) |
| Installation, Maintenance & Repair | 5 (100.0%) | 0 (0.0%) |
| Total (Category) | 23 (79.3%) | 6 (20.7%) |
| Total (Overall) | 82 (51.9%) | 76 (48.1%) |
Production, Transportation and Moving Occupations
The most common Production, Transportation and Moving occupations in Sale City are Production (26 | 16.5%), and Material Moving (16 | 10.1%).
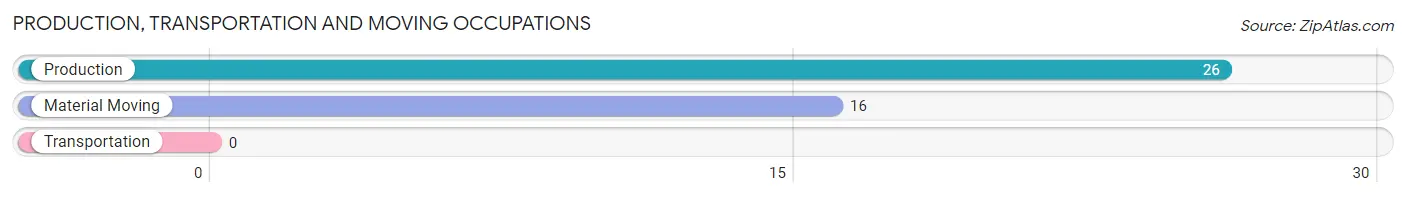
Production, Transportation and Moving Occupations by Sex
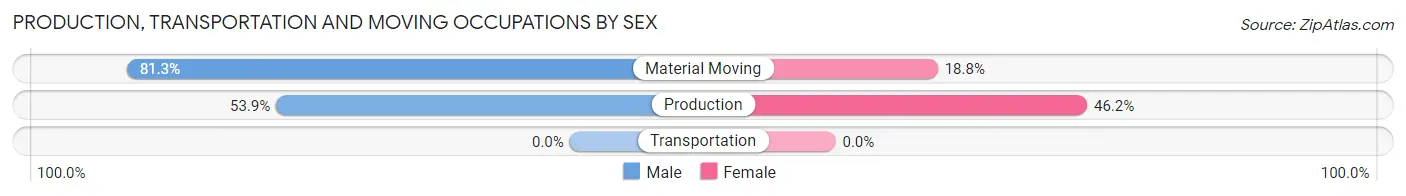
| Occupation | Male | Female |
| Production | 14 (53.8%) | 12 (46.2%) |
| Transportation | 0 (0.0%) | 0 (0.0%) |
| Material Moving | 13 (81.2%) | 3 (18.8%) |
| Total (Category) | 27 (64.3%) | 15 (35.7%) |
| Total (Overall) | 82 (51.9%) | 76 (48.1%) |
Employment Industries by Sex in Sale City
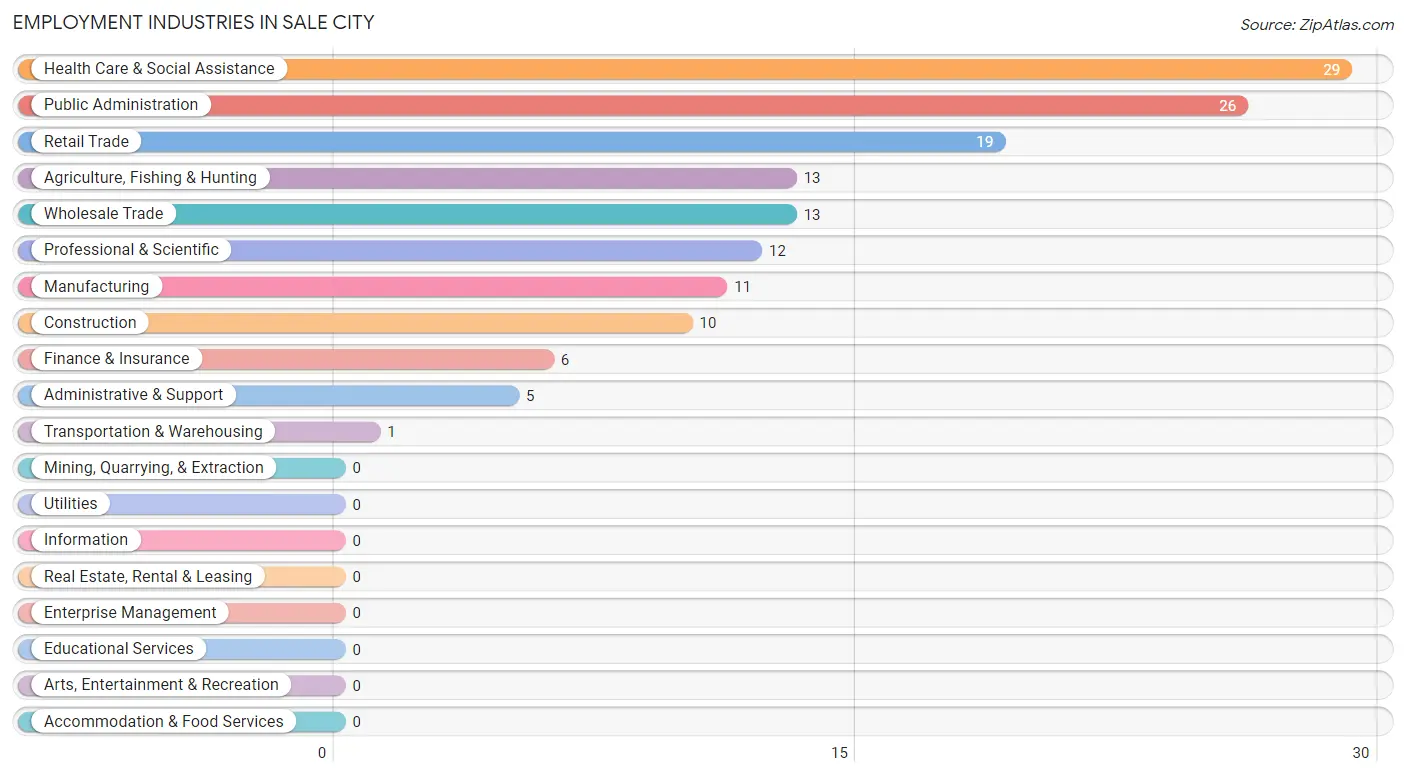
Employment Industries in Sale City
The major employment industries in Sale City include Health Care & Social Assistance (29 | 18.3%), Public Administration (26 | 16.5%), Retail Trade (19 | 12.0%), Agriculture, Fishing & Hunting (13 | 8.2%), and Wholesale Trade (13 | 8.2%).
Employment Industries by Sex in Sale City
The Sale City industries that see more men than women are Construction (100.0%), Wholesale Trade (100.0%), and Transportation & Warehousing (100.0%), whereas the industries that tend to have a higher number of women are Finance & Insurance (100.0%), Professional & Scientific (100.0%), and Health Care & Social Assistance (93.1%).
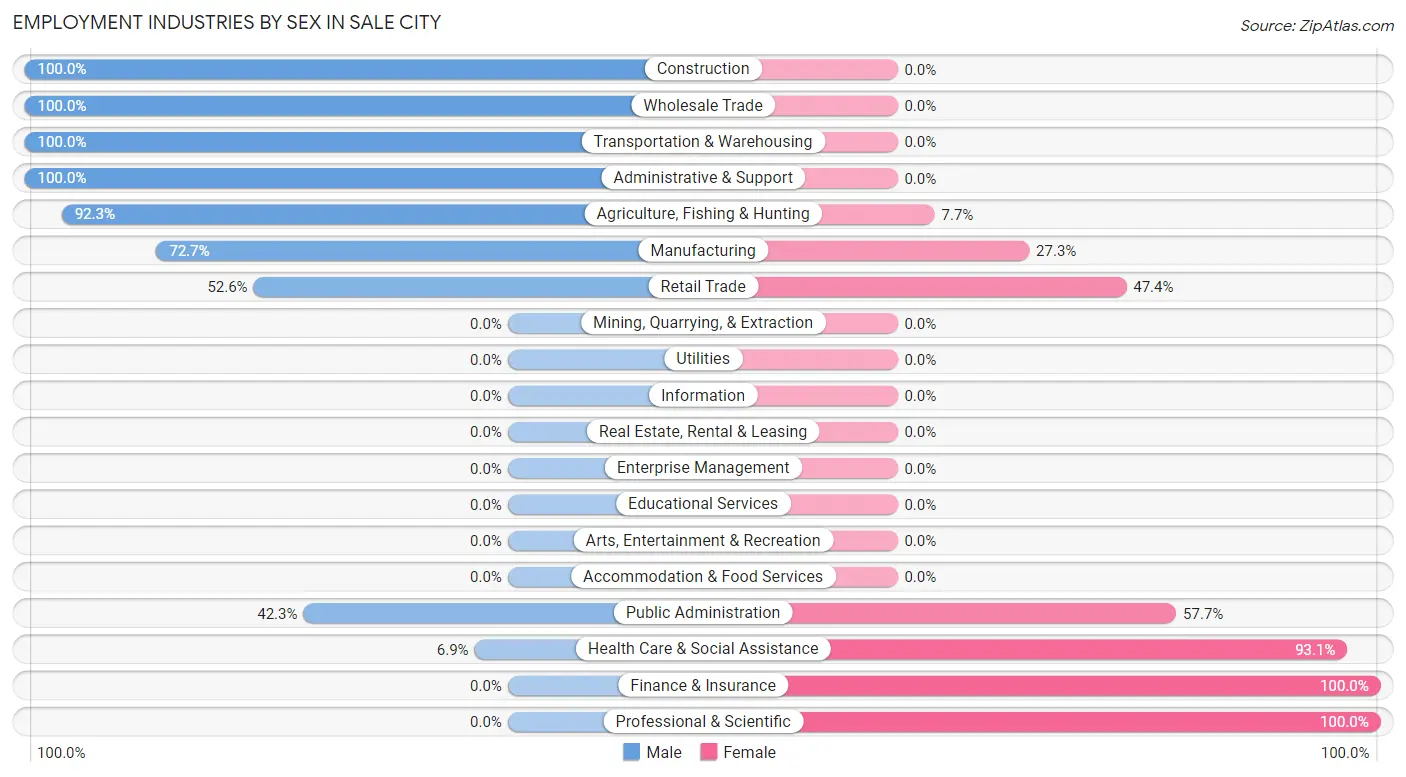
| Industry | Male | Female |
| Agriculture, Fishing & Hunting | 12 (92.3%) | 1 (7.7%) |
| Mining, Quarrying, & Extraction | 0 (0.0%) | 0 (0.0%) |
| Construction | 10 (100.0%) | 0 (0.0%) |
| Manufacturing | 8 (72.7%) | 3 (27.3%) |
| Wholesale Trade | 13 (100.0%) | 0 (0.0%) |
| Retail Trade | 10 (52.6%) | 9 (47.4%) |
| Transportation & Warehousing | 1 (100.0%) | 0 (0.0%) |
| Utilities | 0 (0.0%) | 0 (0.0%) |
| Information | 0 (0.0%) | 0 (0.0%) |
| Finance & Insurance | 0 (0.0%) | 6 (100.0%) |
| Real Estate, Rental & Leasing | 0 (0.0%) | 0 (0.0%) |
| Professional & Scientific | 0 (0.0%) | 12 (100.0%) |
| Enterprise Management | 0 (0.0%) | 0 (0.0%) |
| Administrative & Support | 5 (100.0%) | 0 (0.0%) |
| Educational Services | 0 (0.0%) | 0 (0.0%) |
| Health Care & Social Assistance | 2 (6.9%) | 27 (93.1%) |
| Arts, Entertainment & Recreation | 0 (0.0%) | 0 (0.0%) |
| Accommodation & Food Services | 0 (0.0%) | 0 (0.0%) |
| Public Administration | 11 (42.3%) | 15 (57.7%) |
| Total | 82 (51.9%) | 76 (48.1%) |
Education in Sale City
School Enrollment in Sale City
The most common levels of schooling among the 110 students in Sale City are middle school (32 | 29.1%), elementary school (30 | 27.3%), and high school (22 | 20.0%).
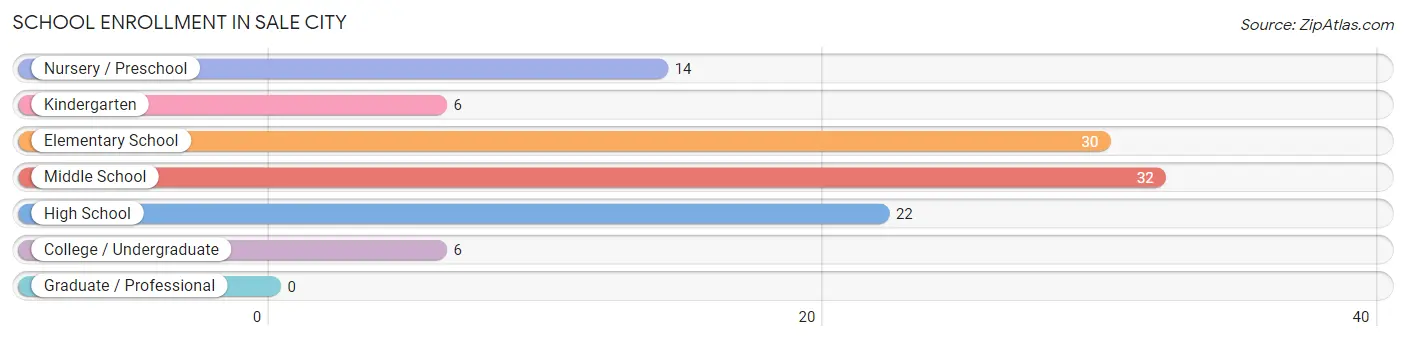
| School Level | # Students | % Students |
| Nursery / Preschool | 14 | 12.7% |
| Kindergarten | 6 | 5.4% |
| Elementary School | 30 | 27.3% |
| Middle School | 32 | 29.1% |
| High School | 22 | 20.0% |
| College / Undergraduate | 6 | 5.4% |
| Graduate / Professional | 0 | 0.0% |
| Total | 110 | 100.0% |
School Enrollment by Age by Funding Source in Sale City
Out of a total of 110 students who are enrolled in schools in Sale City, 22 (20.0%) attend a private institution, while the remaining 88 (80.0%) are enrolled in public schools. The age group of 3 to 4 year olds has the highest likelihood of being enrolled in private schools, with 8 (57.1% in the age bracket) enrolled. Conversely, the age group of 10 to 14 year olds has the lowest likelihood of being enrolled in a private school, with 41 (100.0% in the age bracket) attending a public institution.
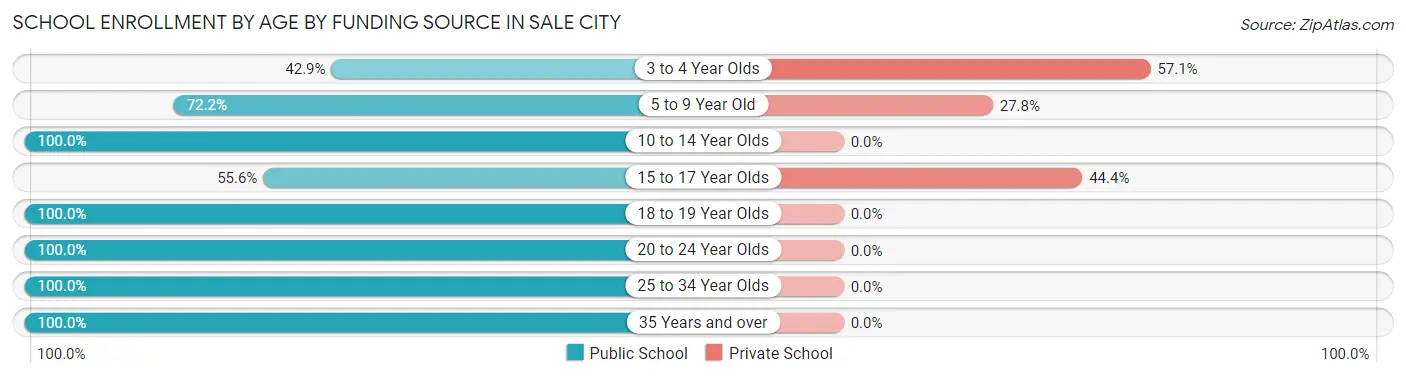
| Age Bracket | Public School | Private School |
| 3 to 4 Year Olds | 6 (42.9%) | 8 (57.1%) |
| 5 to 9 Year Old | 26 (72.2%) | 10 (27.8%) |
| 10 to 14 Year Olds | 41 (100.0%) | 0 (0.0%) |
| 15 to 17 Year Olds | 5 (55.6%) | 4 (44.4%) |
| 18 to 19 Year Olds | 2 (100.0%) | 0 (0.0%) |
| 20 to 24 Year Olds | 2 (100.0%) | 0 (0.0%) |
| 25 to 34 Year Olds | 3 (100.0%) | 0 (0.0%) |
| 35 Years and over | 3 (100.0%) | 0 (0.0%) |
| Total | 88 (80.0%) | 22 (20.0%) |
Educational Attainment by Field of Study in Sale City
Multidisciplinary studies (14 | 58.3%), business (5 | 20.8%), education (4 | 16.7%), and science & technology (1 | 4.2%) are the most common fields of study among 24 individuals in Sale City who have obtained a bachelor's degree or higher.
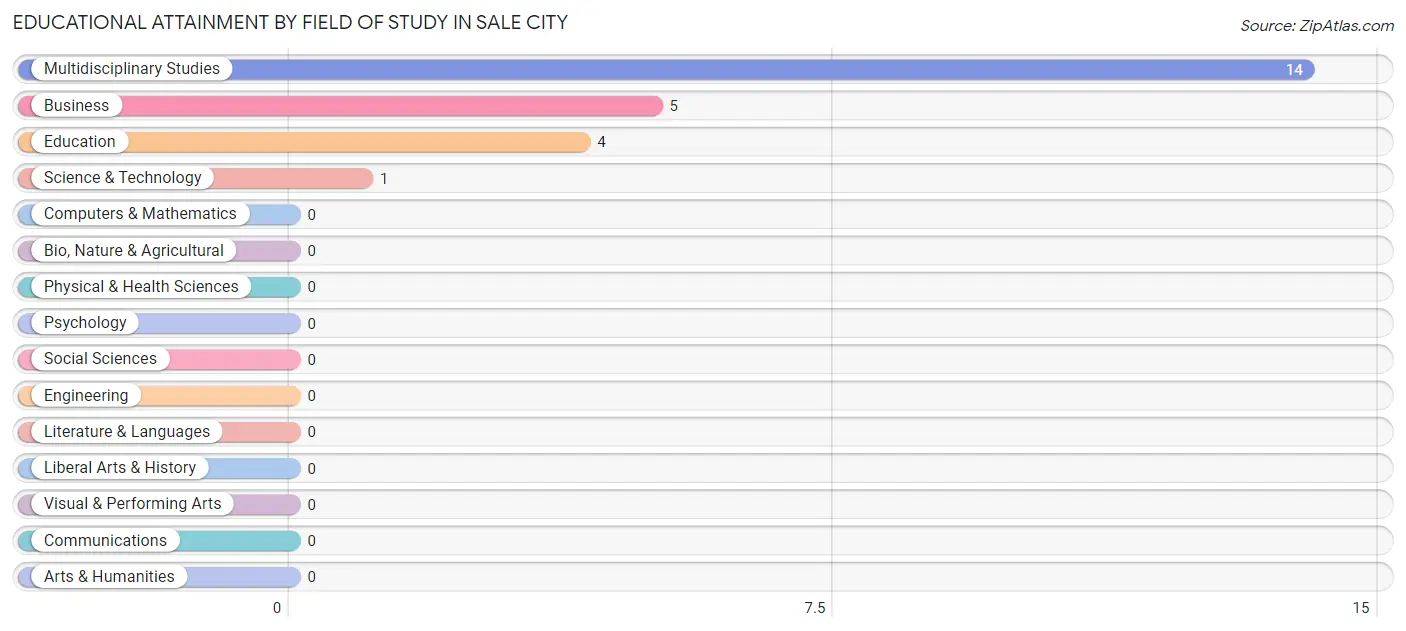
| Field of Study | # Graduates | % Graduates |
| Computers & Mathematics | 0 | 0.0% |
| Bio, Nature & Agricultural | 0 | 0.0% |
| Physical & Health Sciences | 0 | 0.0% |
| Psychology | 0 | 0.0% |
| Social Sciences | 0 | 0.0% |
| Engineering | 0 | 0.0% |
| Multidisciplinary Studies | 14 | 58.3% |
| Science & Technology | 1 | 4.2% |
| Business | 5 | 20.8% |
| Education | 4 | 16.7% |
| Literature & Languages | 0 | 0.0% |
| Liberal Arts & History | 0 | 0.0% |
| Visual & Performing Arts | 0 | 0.0% |
| Communications | 0 | 0.0% |
| Arts & Humanities | 0 | 0.0% |
| Total | 24 | 100.0% |
Transportation & Commute in Sale City
Vehicle Availability by Sex in Sale City
The most prevalent vehicle ownership categories in Sale City are males with 2 vehicles (40, accounting for 51.9%) and females with 2 vehicles (39, making up 54.8%).
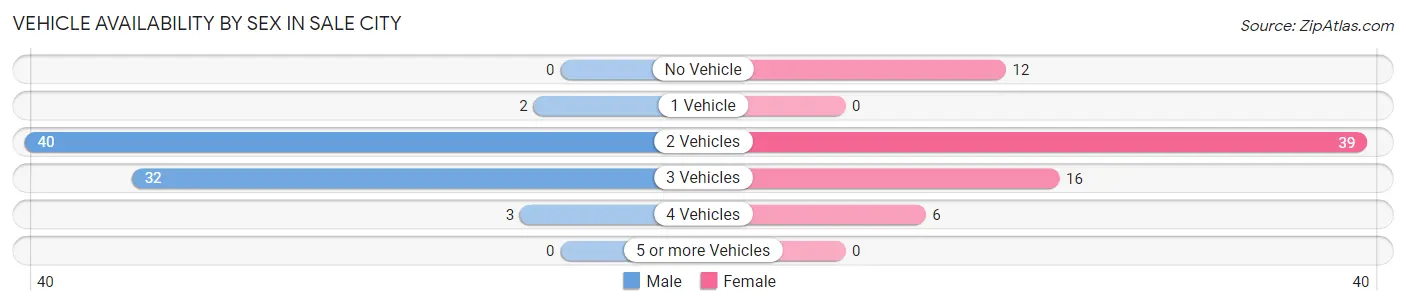
| Vehicles Available | Male | Female |
| No Vehicle | 0 (0.0%) | 12 (16.4%) |
| 1 Vehicle | 2 (2.6%) | 0 (0.0%) |
| 2 Vehicles | 40 (51.9%) | 39 (53.4%) |
| 3 Vehicles | 32 (41.6%) | 16 (21.9%) |
| 4 Vehicles | 3 (3.9%) | 6 (8.2%) |
| 5 or more Vehicles | 0 (0.0%) | 0 (0.0%) |
| Total | 77 (100.0%) | 73 (100.0%) |
Commute Time in Sale City
The most frequently occuring commute durations in Sale City are 15 to 19 minutes (28 commuters, 19.3%), 20 to 24 minutes (22 commuters, 15.2%), and less than 5 minutes (18 commuters, 12.4%).
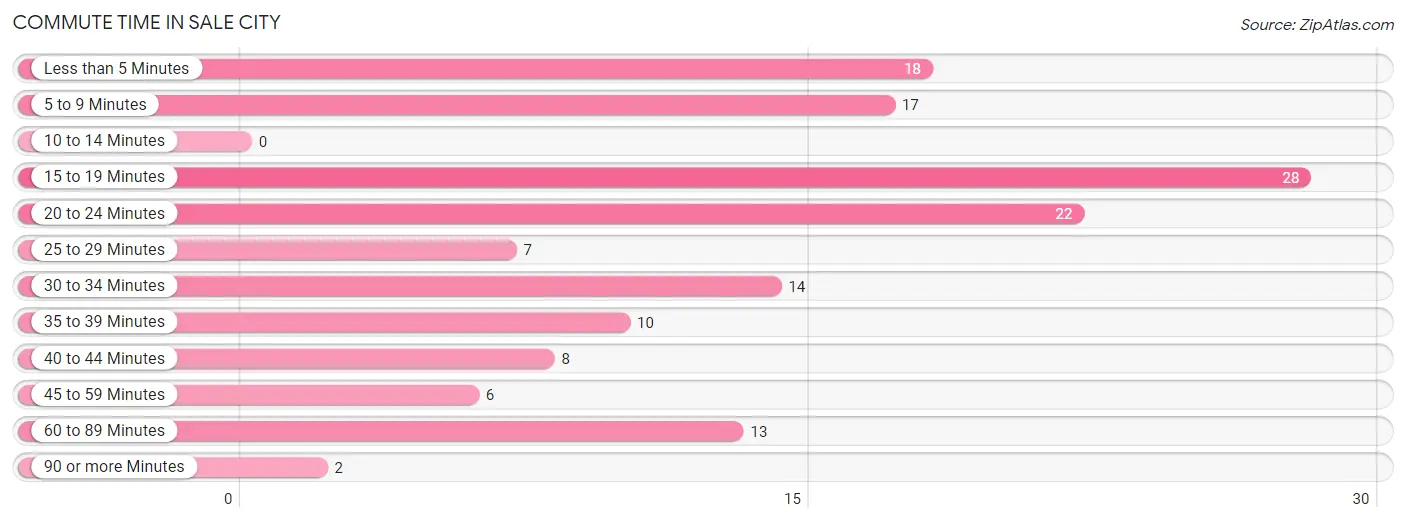
| Commute Time | # Commuters | % Commuters |
| Less than 5 Minutes | 18 | 12.4% |
| 5 to 9 Minutes | 17 | 11.7% |
| 10 to 14 Minutes | 0 | 0.0% |
| 15 to 19 Minutes | 28 | 19.3% |
| 20 to 24 Minutes | 22 | 15.2% |
| 25 to 29 Minutes | 7 | 4.8% |
| 30 to 34 Minutes | 14 | 9.7% |
| 35 to 39 Minutes | 10 | 6.9% |
| 40 to 44 Minutes | 8 | 5.5% |
| 45 to 59 Minutes | 6 | 4.1% |
| 60 to 89 Minutes | 13 | 9.0% |
| 90 or more Minutes | 2 | 1.4% |
Commute Time by Sex in Sale City
The most common commute times in Sale City are 15 to 19 minutes (28 commuters, 36.8%) for males and 30 to 34 minutes (13 commuters, 18.8%) for females.
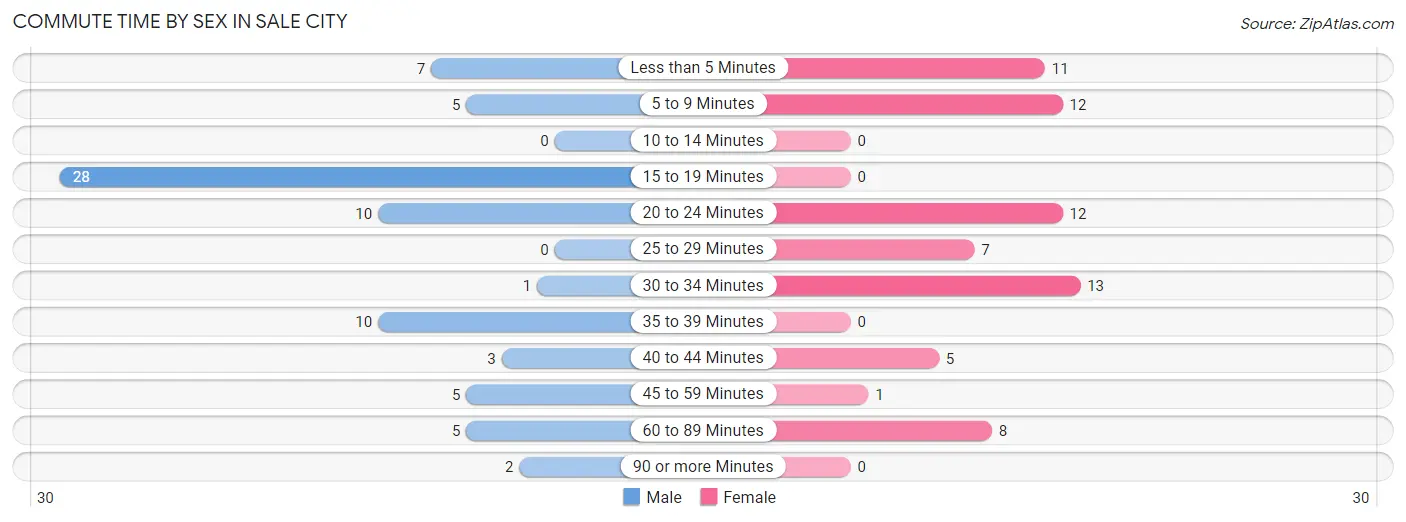
| Commute Time | Male | Female |
| Less than 5 Minutes | 7 (9.2%) | 11 (15.9%) |
| 5 to 9 Minutes | 5 (6.6%) | 12 (17.4%) |
| 10 to 14 Minutes | 0 (0.0%) | 0 (0.0%) |
| 15 to 19 Minutes | 28 (36.8%) | 0 (0.0%) |
| 20 to 24 Minutes | 10 (13.2%) | 12 (17.4%) |
| 25 to 29 Minutes | 0 (0.0%) | 7 (10.1%) |
| 30 to 34 Minutes | 1 (1.3%) | 13 (18.8%) |
| 35 to 39 Minutes | 10 (13.2%) | 0 (0.0%) |
| 40 to 44 Minutes | 3 (4.0%) | 5 (7.2%) |
| 45 to 59 Minutes | 5 (6.6%) | 1 (1.5%) |
| 60 to 89 Minutes | 5 (6.6%) | 8 (11.6%) |
| 90 or more Minutes | 2 (2.6%) | 0 (0.0%) |
Time of Departure to Work by Sex in Sale City
The most frequent times of departure to work in Sale City are 7:00 AM to 7:29 AM (18, 23.7%) for males and 7:00 AM to 7:29 AM (19, 27.5%) for females.
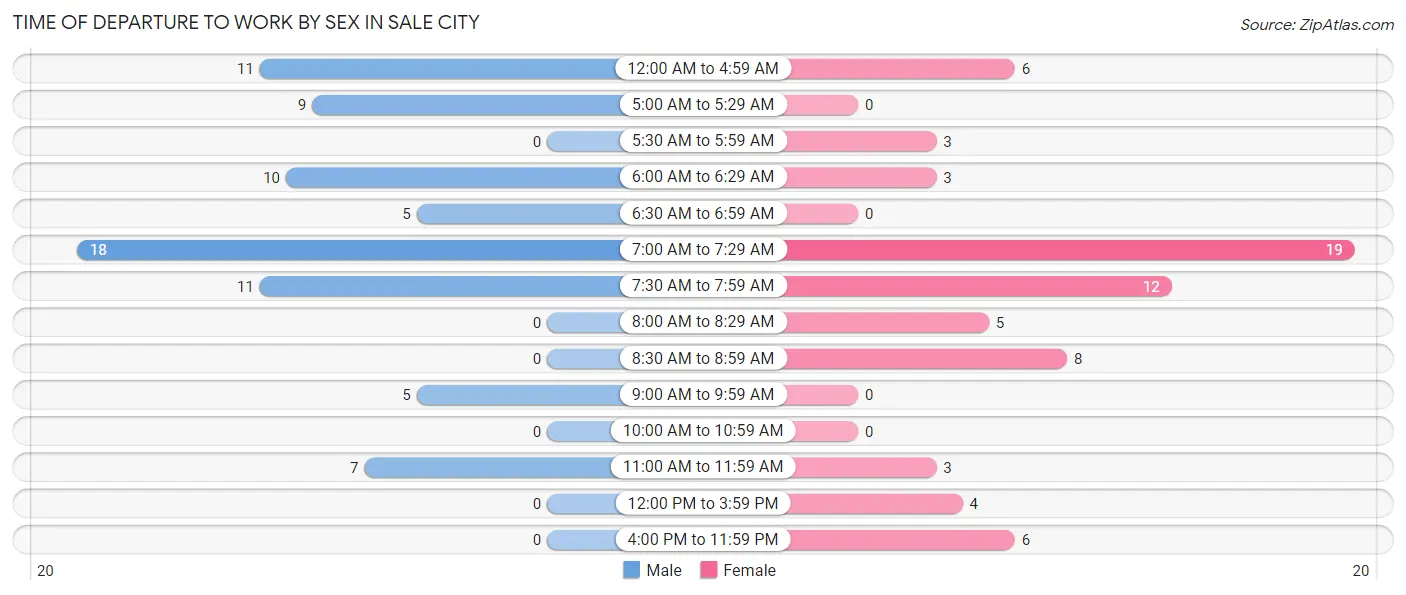
| Time of Departure | Male | Female |
| 12:00 AM to 4:59 AM | 11 (14.5%) | 6 (8.7%) |
| 5:00 AM to 5:29 AM | 9 (11.8%) | 0 (0.0%) |
| 5:30 AM to 5:59 AM | 0 (0.0%) | 3 (4.3%) |
| 6:00 AM to 6:29 AM | 10 (13.2%) | 3 (4.3%) |
| 6:30 AM to 6:59 AM | 5 (6.6%) | 0 (0.0%) |
| 7:00 AM to 7:29 AM | 18 (23.7%) | 19 (27.5%) |
| 7:30 AM to 7:59 AM | 11 (14.5%) | 12 (17.4%) |
| 8:00 AM to 8:29 AM | 0 (0.0%) | 5 (7.2%) |
| 8:30 AM to 8:59 AM | 0 (0.0%) | 8 (11.6%) |
| 9:00 AM to 9:59 AM | 5 (6.6%) | 0 (0.0%) |
| 10:00 AM to 10:59 AM | 0 (0.0%) | 0 (0.0%) |
| 11:00 AM to 11:59 AM | 7 (9.2%) | 3 (4.3%) |
| 12:00 PM to 3:59 PM | 0 (0.0%) | 4 (5.8%) |
| 4:00 PM to 11:59 PM | 0 (0.0%) | 6 (8.7%) |
| Total | 76 (100.0%) | 69 (100.0%) |
Housing Occupancy in Sale City
Occupancy by Ownership in Sale City
Of the total 158 dwellings in Sale City, owner-occupied units account for 124 (78.5%), while renter-occupied units make up 34 (21.5%).
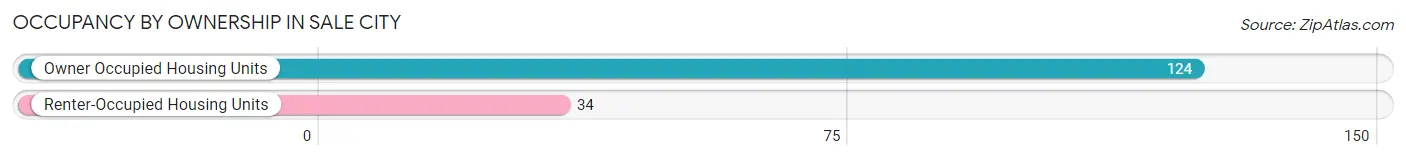
| Occupancy | # Housing Units | % Housing Units |
| Owner Occupied Housing Units | 124 | 78.5% |
| Renter-Occupied Housing Units | 34 | 21.5% |
| Total Occupied Housing Units | 158 | 100.0% |
Occupancy by Household Size in Sale City
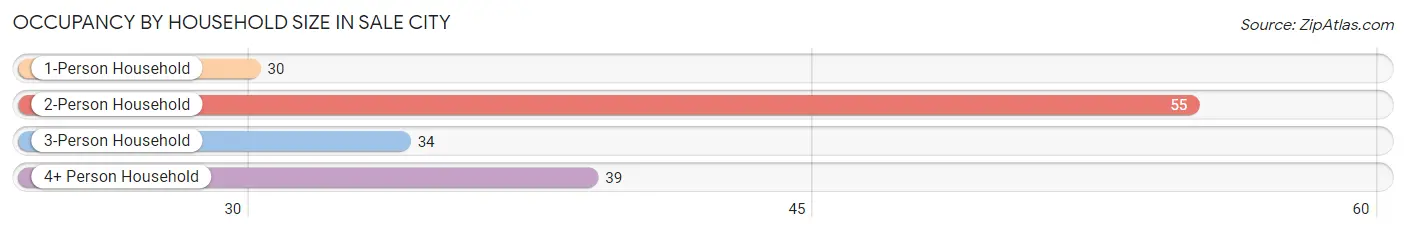
| Household Size | # Housing Units | % Housing Units |
| 1-Person Household | 30 | 19.0% |
| 2-Person Household | 55 | 34.8% |
| 3-Person Household | 34 | 21.5% |
| 4+ Person Household | 39 | 24.7% |
| Total Housing Units | 158 | 100.0% |
Occupancy by Ownership by Household Size in Sale City
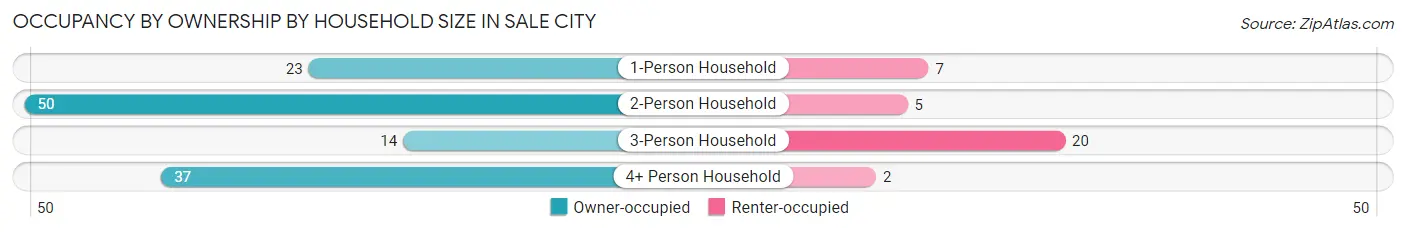
| Household Size | Owner-occupied | Renter-occupied |
| 1-Person Household | 23 (76.7%) | 7 (23.3%) |
| 2-Person Household | 50 (90.9%) | 5 (9.1%) |
| 3-Person Household | 14 (41.2%) | 20 (58.8%) |
| 4+ Person Household | 37 (94.9%) | 2 (5.1%) |
| Total Housing Units | 124 (78.5%) | 34 (21.5%) |
Occupancy by Educational Attainment in Sale City
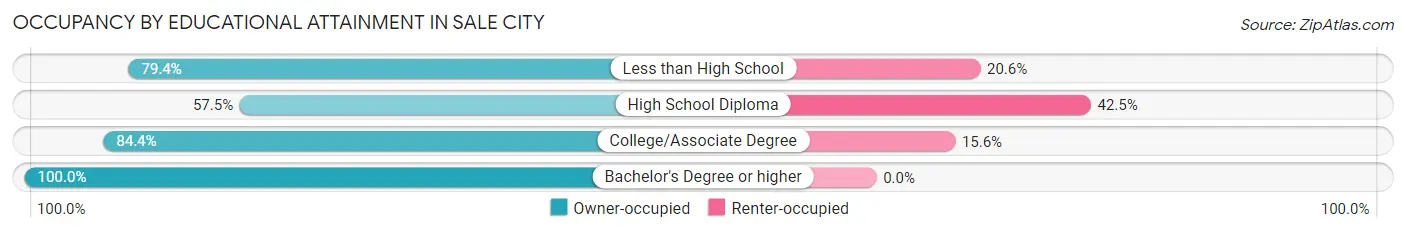
| Household Size | Owner-occupied | Renter-occupied |
| Less than High School | 27 (79.4%) | 7 (20.6%) |
| High School Diploma | 23 (57.5%) | 17 (42.5%) |
| College/Associate Degree | 54 (84.4%) | 10 (15.6%) |
| Bachelor's Degree or higher | 20 (100.0%) | 0 (0.0%) |
Occupancy by Age of Householder in Sale City
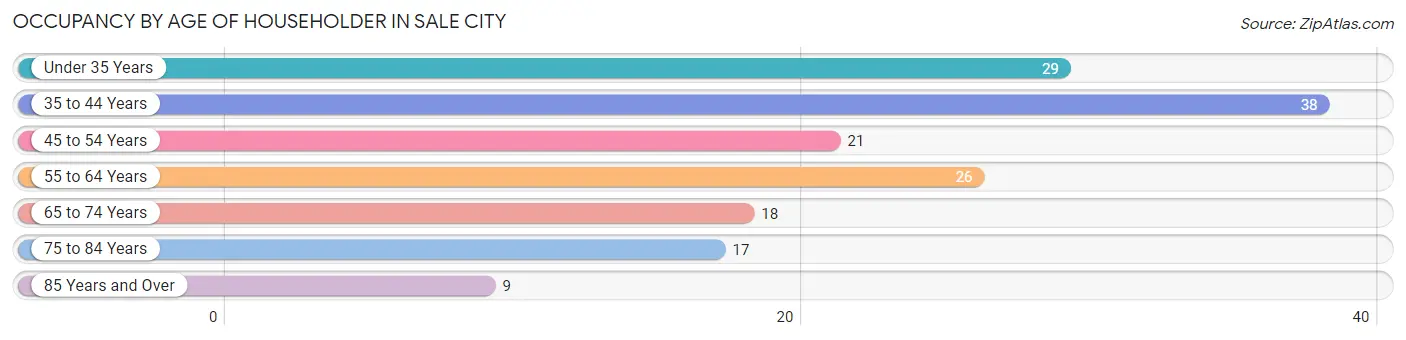
| Age Bracket | # Households | % Households |
| Under 35 Years | 29 | 18.3% |
| 35 to 44 Years | 38 | 24.0% |
| 45 to 54 Years | 21 | 13.3% |
| 55 to 64 Years | 26 | 16.5% |
| 65 to 74 Years | 18 | 11.4% |
| 75 to 84 Years | 17 | 10.8% |
| 85 Years and Over | 9 | 5.7% |
| Total | 158 | 100.0% |
Housing Finances in Sale City
Median Income by Occupancy in Sale City
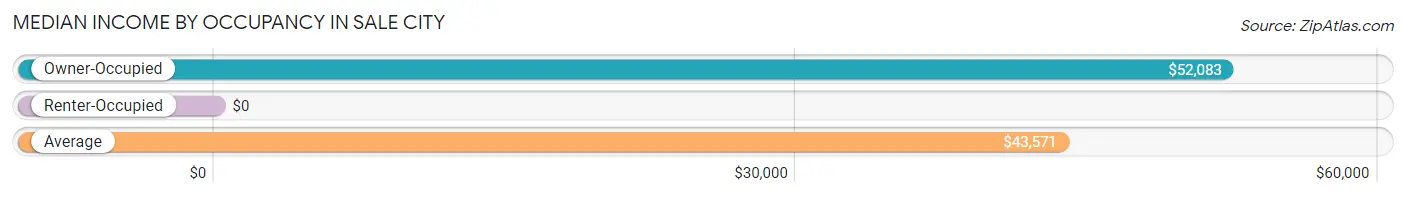
| Occupancy Type | # Households | Median Income |
| Owner-Occupied | 124 (78.5%) | $52,083 |
| Renter-Occupied | 34 (21.5%) | $0 |
| Average | 158 (100.0%) | $43,571 |
Occupancy by Householder Income Bracket in Sale City
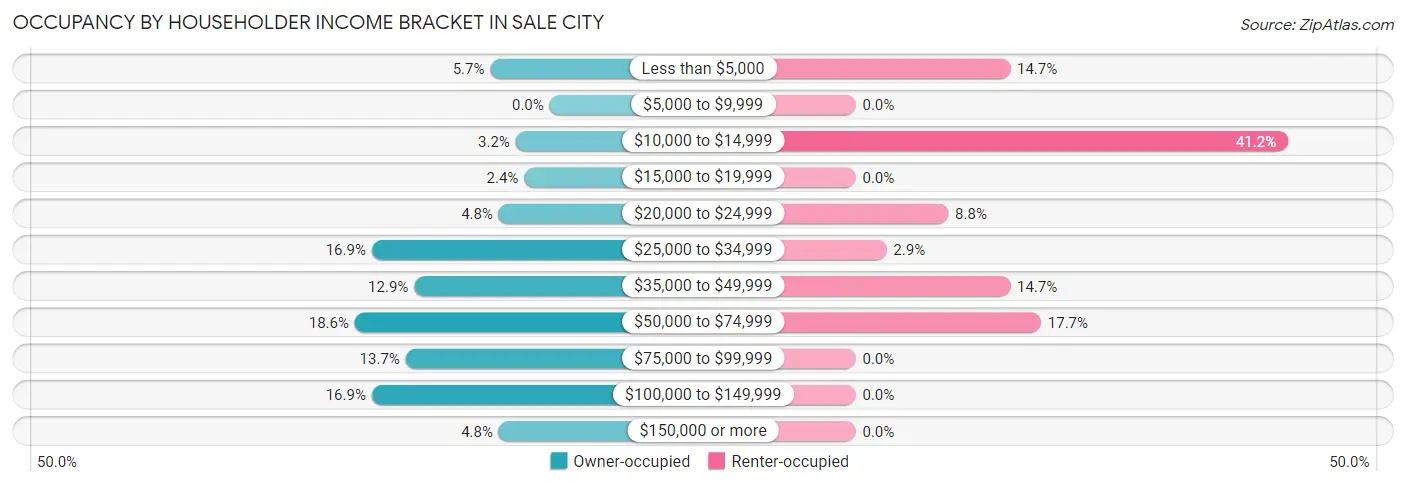
| Income Bracket | Owner-occupied | Renter-occupied |
| Less than $5,000 | 7 (5.7%) | 5 (14.7%) |
| $5,000 to $9,999 | 0 (0.0%) | 0 (0.0%) |
| $10,000 to $14,999 | 4 (3.2%) | 14 (41.2%) |
| $15,000 to $19,999 | 3 (2.4%) | 0 (0.0%) |
| $20,000 to $24,999 | 6 (4.8%) | 3 (8.8%) |
| $25,000 to $34,999 | 21 (16.9%) | 1 (2.9%) |
| $35,000 to $49,999 | 16 (12.9%) | 5 (14.7%) |
| $50,000 to $74,999 | 23 (18.5%) | 6 (17.6%) |
| $75,000 to $99,999 | 17 (13.7%) | 0 (0.0%) |
| $100,000 to $149,999 | 21 (16.9%) | 0 (0.0%) |
| $150,000 or more | 6 (4.8%) | 0 (0.0%) |
| Total | 124 (100.0%) | 34 (100.0%) |
Monthly Housing Cost Tiers in Sale City
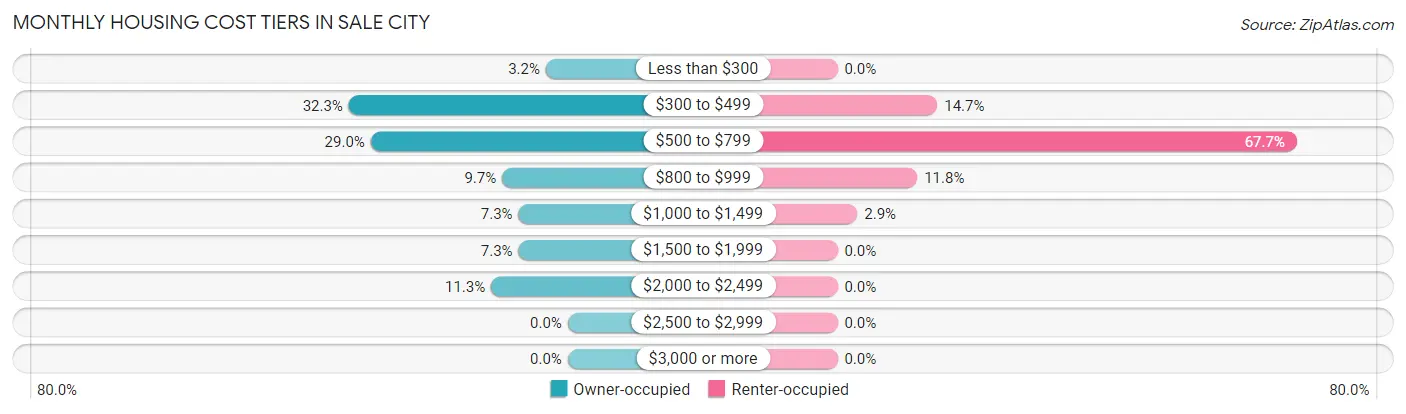
| Monthly Cost | Owner-occupied | Renter-occupied |
| Less than $300 | 4 (3.2%) | 0 (0.0%) |
| $300 to $499 | 40 (32.3%) | 5 (14.7%) |
| $500 to $799 | 36 (29.0%) | 23 (67.6%) |
| $800 to $999 | 12 (9.7%) | 4 (11.8%) |
| $1,000 to $1,499 | 9 (7.3%) | 1 (2.9%) |
| $1,500 to $1,999 | 9 (7.3%) | 0 (0.0%) |
| $2,000 to $2,499 | 14 (11.3%) | 0 (0.0%) |
| $2,500 to $2,999 | 0 (0.0%) | 0 (0.0%) |
| $3,000 or more | 0 (0.0%) | 0 (0.0%) |
| Total | 124 (100.0%) | 34 (100.0%) |
Physical Housing Characteristics in Sale City
Housing Structures in Sale City
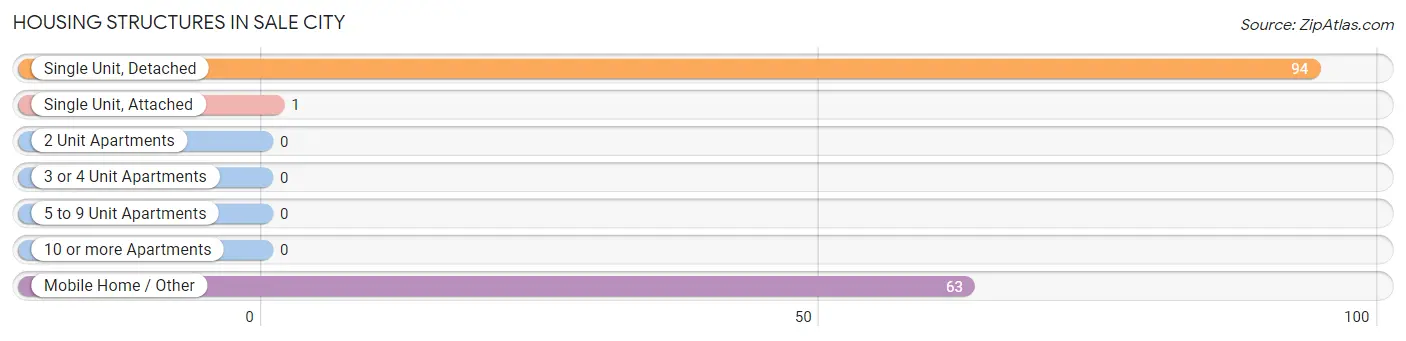
| Structure Type | # Housing Units | % Housing Units |
| Single Unit, Detached | 94 | 59.5% |
| Single Unit, Attached | 1 | 0.6% |
| 2 Unit Apartments | 0 | 0.0% |
| 3 or 4 Unit Apartments | 0 | 0.0% |
| 5 to 9 Unit Apartments | 0 | 0.0% |
| 10 or more Apartments | 0 | 0.0% |
| Mobile Home / Other | 63 | 39.9% |
| Total | 158 | 100.0% |
Housing Structures by Occupancy in Sale City
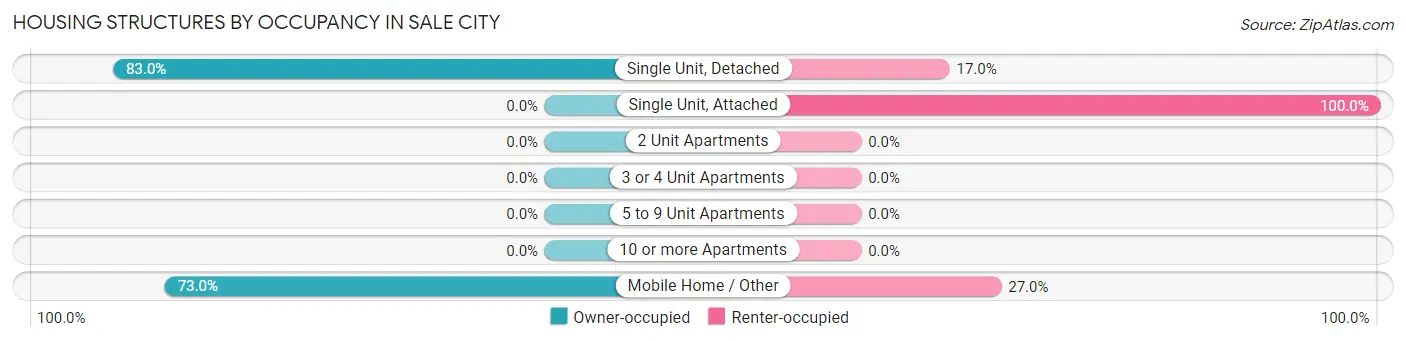
| Structure Type | Owner-occupied | Renter-occupied |
| Single Unit, Detached | 78 (83.0%) | 16 (17.0%) |
| Single Unit, Attached | 0 (0.0%) | 1 (100.0%) |
| 2 Unit Apartments | 0 (0.0%) | 0 (0.0%) |
| 3 or 4 Unit Apartments | 0 (0.0%) | 0 (0.0%) |
| 5 to 9 Unit Apartments | 0 (0.0%) | 0 (0.0%) |
| 10 or more Apartments | 0 (0.0%) | 0 (0.0%) |
| Mobile Home / Other | 46 (73.0%) | 17 (27.0%) |
| Total | 124 (78.5%) | 34 (21.5%) |
Housing Structures by Number of Rooms in Sale City
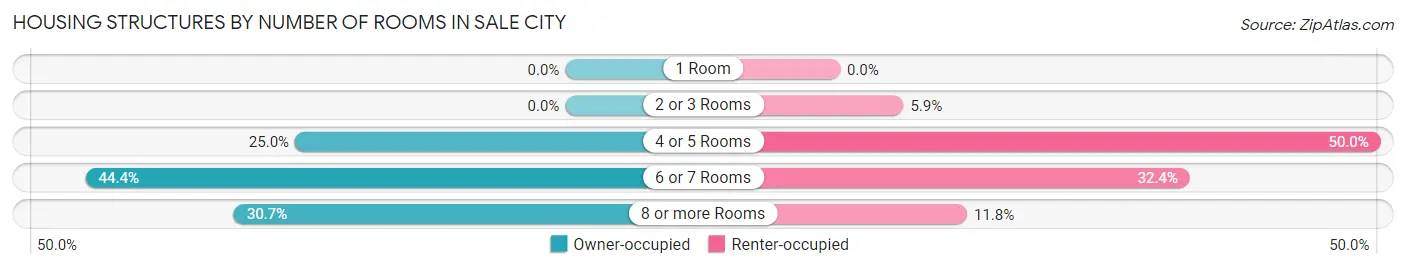
| Number of Rooms | Owner-occupied | Renter-occupied |
| 1 Room | 0 (0.0%) | 0 (0.0%) |
| 2 or 3 Rooms | 0 (0.0%) | 2 (5.9%) |
| 4 or 5 Rooms | 31 (25.0%) | 17 (50.0%) |
| 6 or 7 Rooms | 55 (44.4%) | 11 (32.4%) |
| 8 or more Rooms | 38 (30.6%) | 4 (11.8%) |
| Total | 124 (100.0%) | 34 (100.0%) |
Housing Structure by Heating Type in Sale City
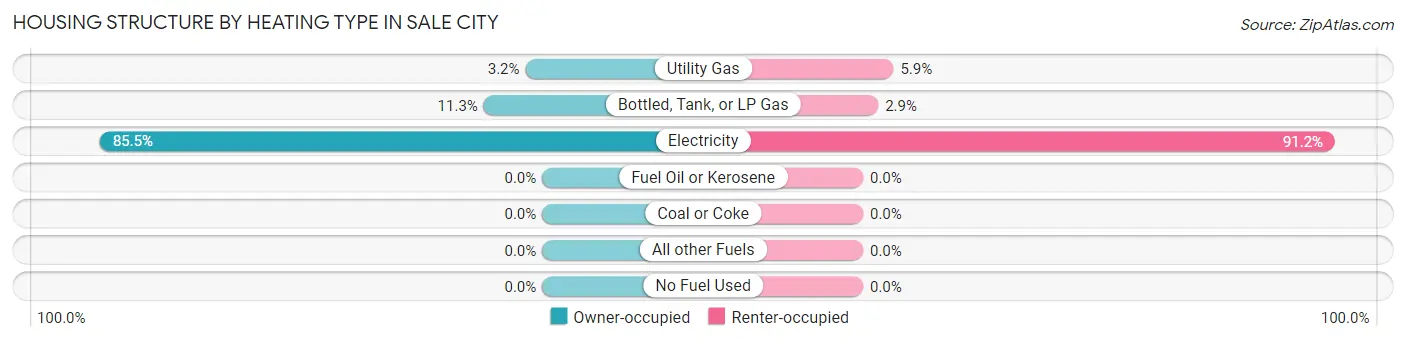
| Heating Type | Owner-occupied | Renter-occupied |
| Utility Gas | 4 (3.2%) | 2 (5.9%) |
| Bottled, Tank, or LP Gas | 14 (11.3%) | 1 (2.9%) |
| Electricity | 106 (85.5%) | 31 (91.2%) |
| Fuel Oil or Kerosene | 0 (0.0%) | 0 (0.0%) |
| Coal or Coke | 0 (0.0%) | 0 (0.0%) |
| All other Fuels | 0 (0.0%) | 0 (0.0%) |
| No Fuel Used | 0 (0.0%) | 0 (0.0%) |
| Total | 124 (100.0%) | 34 (100.0%) |
Household Vehicle Usage in Sale City
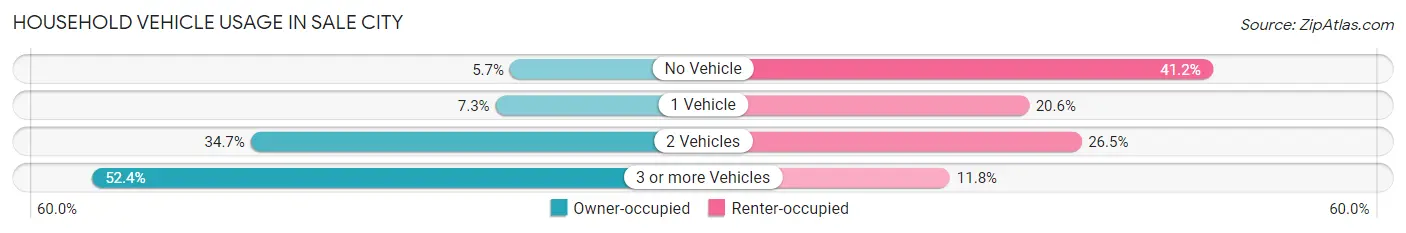
| Vehicles per Household | Owner-occupied | Renter-occupied |
| No Vehicle | 7 (5.7%) | 14 (41.2%) |
| 1 Vehicle | 9 (7.3%) | 7 (20.6%) |
| 2 Vehicles | 43 (34.7%) | 9 (26.5%) |
| 3 or more Vehicles | 65 (52.4%) | 4 (11.8%) |
| Total | 124 (100.0%) | 34 (100.0%) |
Real Estate & Mortgages in Sale City
Real Estate and Mortgage Overview in Sale City
| Characteristic | Without Mortgage | With Mortgage |
| Housing Units | 76 | 48 |
| Median Property Value | $73,800 | $176,800 |
| Median Household Income | $41,250 | $5 |
| Monthly Housing Costs | $475 | $0 |
| Real Estate Taxes | $1,088 | $3 |
Property Value by Mortgage Status in Sale City
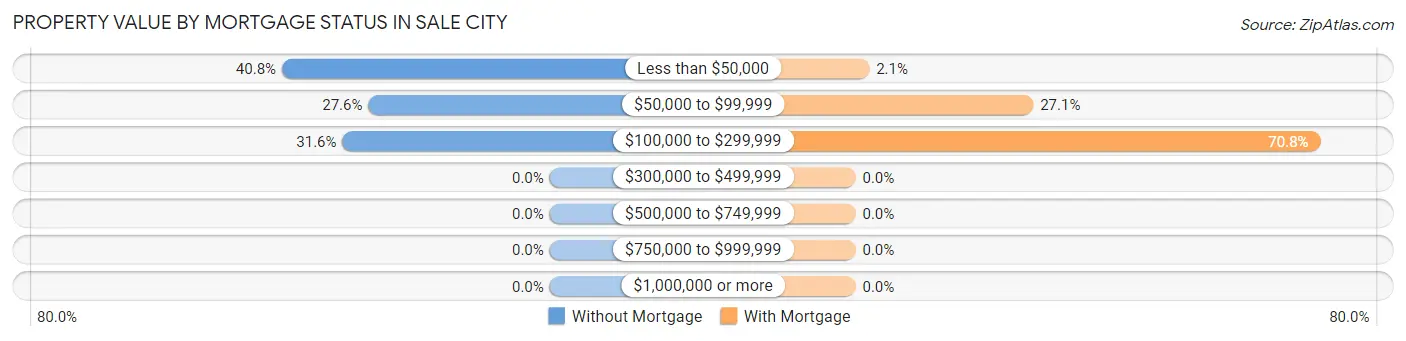
| Property Value | Without Mortgage | With Mortgage |
| Less than $50,000 | 31 (40.8%) | 1 (2.1%) |
| $50,000 to $99,999 | 21 (27.6%) | 13 (27.1%) |
| $100,000 to $299,999 | 24 (31.6%) | 34 (70.8%) |
| $300,000 to $499,999 | 0 (0.0%) | 0 (0.0%) |
| $500,000 to $749,999 | 0 (0.0%) | 0 (0.0%) |
| $750,000 to $999,999 | 0 (0.0%) | 0 (0.0%) |
| $1,000,000 or more | 0 (0.0%) | 0 (0.0%) |
| Total | 76 (100.0%) | 48 (100.0%) |
Household Income by Mortgage Status in Sale City
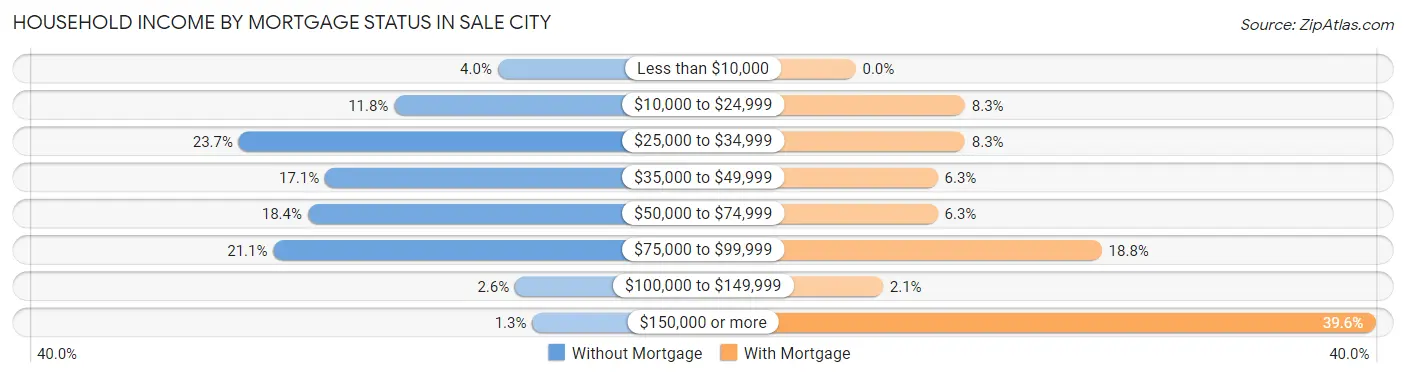
| Household Income | Without Mortgage | With Mortgage |
| Less than $10,000 | 3 (4.0%) | 0 (0.0%) |
| $10,000 to $24,999 | 9 (11.8%) | 4 (8.3%) |
| $25,000 to $34,999 | 18 (23.7%) | 4 (8.3%) |
| $35,000 to $49,999 | 13 (17.1%) | 3 (6.2%) |
| $50,000 to $74,999 | 14 (18.4%) | 3 (6.2%) |
| $75,000 to $99,999 | 16 (21.0%) | 9 (18.8%) |
| $100,000 to $149,999 | 2 (2.6%) | 1 (2.1%) |
| $150,000 or more | 1 (1.3%) | 19 (39.6%) |
| Total | 76 (100.0%) | 48 (100.0%) |
Property Value to Household Income Ratio in Sale City
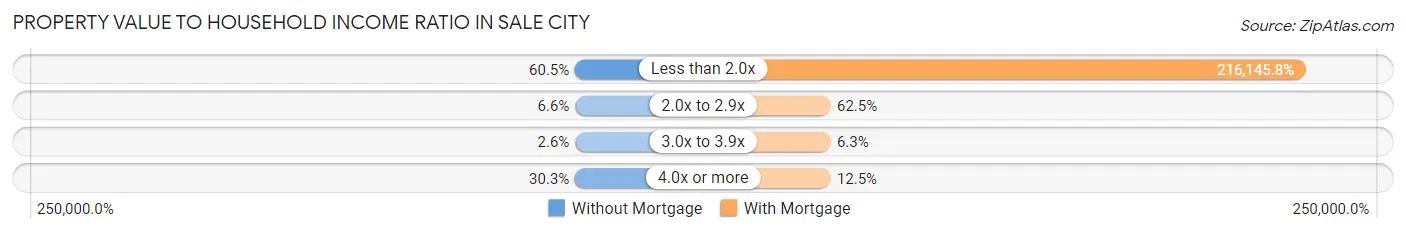
| Value-to-Income Ratio | Without Mortgage | With Mortgage |
| Less than 2.0x | 46 (60.5%) | 103,750 (216,145.8%) |
| 2.0x to 2.9x | 5 (6.6%) | 30 (62.5%) |
| 3.0x to 3.9x | 2 (2.6%) | 3 (6.2%) |
| 4.0x or more | 23 (30.3%) | 6 (12.5%) |
| Total | 76 (100.0%) | 48 (100.0%) |
Real Estate Taxes by Mortgage Status in Sale City
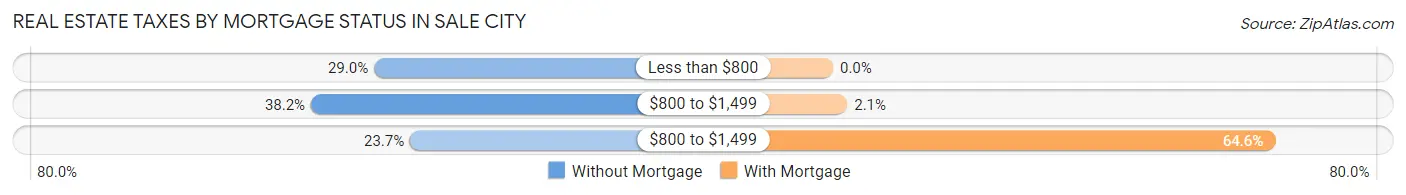
| Property Taxes | Without Mortgage | With Mortgage |
| Less than $800 | 22 (28.9%) | 0 (0.0%) |
| $800 to $1,499 | 29 (38.2%) | 1 (2.1%) |
| $800 to $1,499 | 18 (23.7%) | 31 (64.6%) |
| Total | 76 (100.0%) | 48 (100.0%) |
Health & Disability in Sale City
Health Insurance Coverage by Age in Sale City
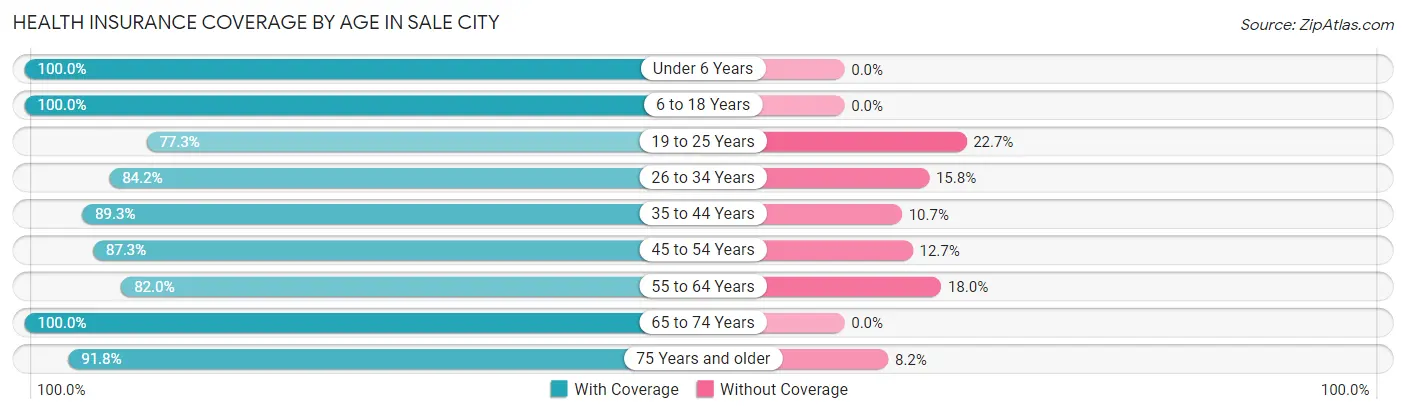
| Age Bracket | With Coverage | Without Coverage |
| Under 6 Years | 29 (100.0%) | 0 (0.0%) |
| 6 to 18 Years | 82 (100.0%) | 0 (0.0%) |
| 19 to 25 Years | 17 (77.3%) | 5 (22.7%) |
| 26 to 34 Years | 32 (84.2%) | 6 (15.8%) |
| 35 to 44 Years | 50 (89.3%) | 6 (10.7%) |
| 45 to 54 Years | 48 (87.3%) | 7 (12.7%) |
| 55 to 64 Years | 50 (82.0%) | 11 (18.0%) |
| 65 to 74 Years | 23 (100.0%) | 0 (0.0%) |
| 75 Years and older | 45 (91.8%) | 4 (8.2%) |
| Total | 376 (90.6%) | 39 (9.4%) |
Health Insurance Coverage by Citizenship Status in Sale City
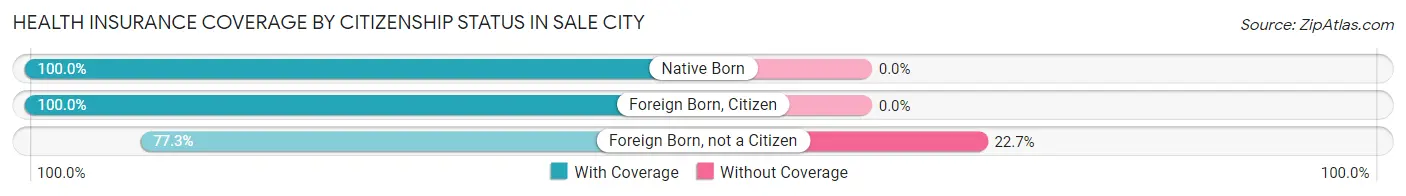
| Citizenship Status | With Coverage | Without Coverage |
| Native Born | 29 (100.0%) | 0 (0.0%) |
| Foreign Born, Citizen | 82 (100.0%) | 0 (0.0%) |
| Foreign Born, not a Citizen | 17 (77.3%) | 5 (22.7%) |
Health Insurance Coverage by Household Income in Sale City
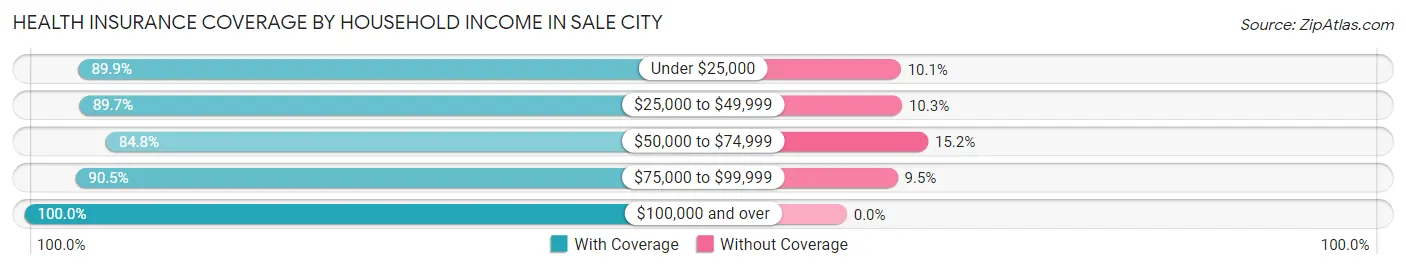
| Household Income | With Coverage | Without Coverage |
| Under $25,000 | 89 (89.9%) | 10 (10.1%) |
| $25,000 to $49,999 | 78 (89.7%) | 9 (10.3%) |
| $50,000 to $74,999 | 78 (84.8%) | 14 (15.2%) |
| $75,000 to $99,999 | 57 (90.5%) | 6 (9.5%) |
| $100,000 and over | 74 (100.0%) | 0 (0.0%) |
Public vs Private Health Insurance Coverage by Age in Sale City
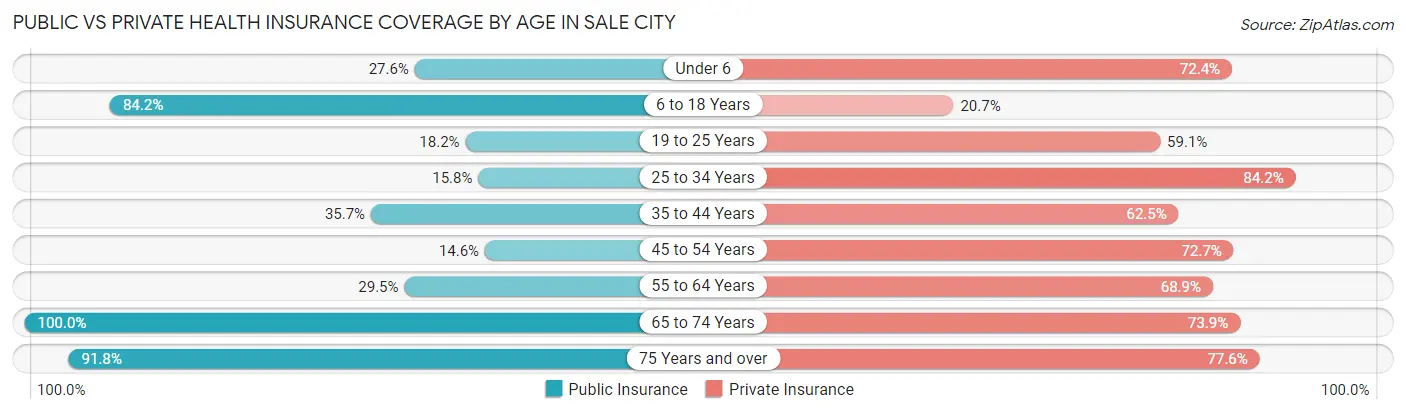
| Age Bracket | Public Insurance | Private Insurance |
| Under 6 | 8 (27.6%) | 21 (72.4%) |
| 6 to 18 Years | 69 (84.2%) | 17 (20.7%) |
| 19 to 25 Years | 4 (18.2%) | 13 (59.1%) |
| 25 to 34 Years | 6 (15.8%) | 32 (84.2%) |
| 35 to 44 Years | 20 (35.7%) | 35 (62.5%) |
| 45 to 54 Years | 8 (14.5%) | 40 (72.7%) |
| 55 to 64 Years | 18 (29.5%) | 42 (68.9%) |
| 65 to 74 Years | 23 (100.0%) | 17 (73.9%) |
| 75 Years and over | 45 (91.8%) | 38 (77.5%) |
| Total | 201 (48.4%) | 255 (61.5%) |
Disability Status by Sex by Age in Sale City
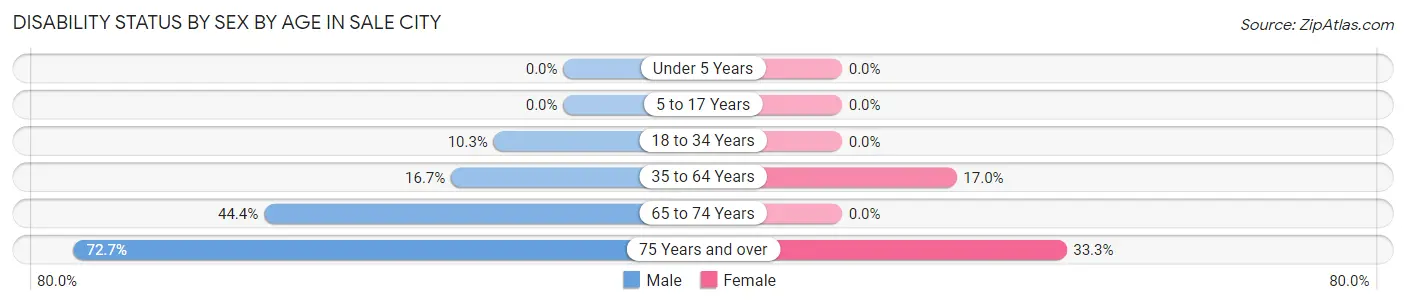
| Age Bracket | Male | Female |
| Under 5 Years | 0 (0.0%) | 0 (0.0%) |
| 5 to 17 Years | 0 (0.0%) | 0 (0.0%) |
| 18 to 34 Years | 3 (10.3%) | 0 (0.0%) |
| 35 to 64 Years | 13 (16.7%) | 16 (17.0%) |
| 65 to 74 Years | 8 (44.4%) | 0 (0.0%) |
| 75 Years and over | 16 (72.7%) | 9 (33.3%) |
Disability Class by Sex by Age in Sale City
Disability Class: Hearing Difficulty
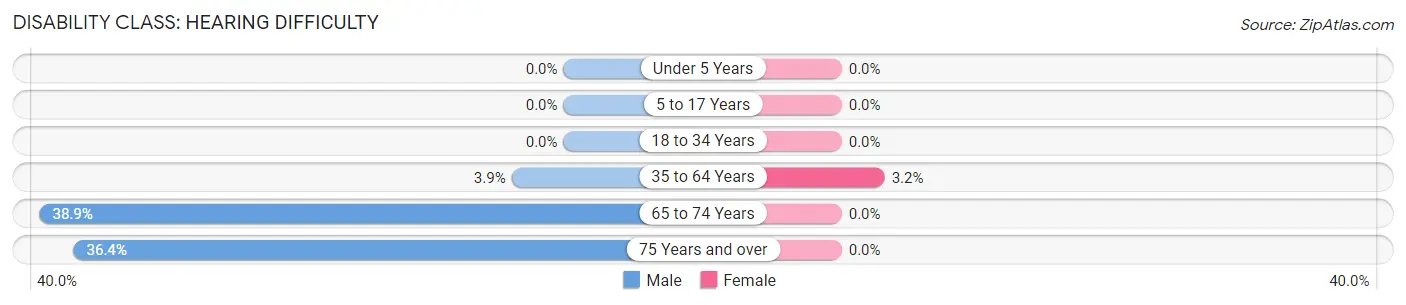
| Age Bracket | Male | Female |
| Under 5 Years | 0 (0.0%) | 0 (0.0%) |
| 5 to 17 Years | 0 (0.0%) | 0 (0.0%) |
| 18 to 34 Years | 0 (0.0%) | 0 (0.0%) |
| 35 to 64 Years | 3 (3.8%) | 3 (3.2%) |
| 65 to 74 Years | 7 (38.9%) | 0 (0.0%) |
| 75 Years and over | 8 (36.4%) | 0 (0.0%) |
Disability Class: Vision Difficulty
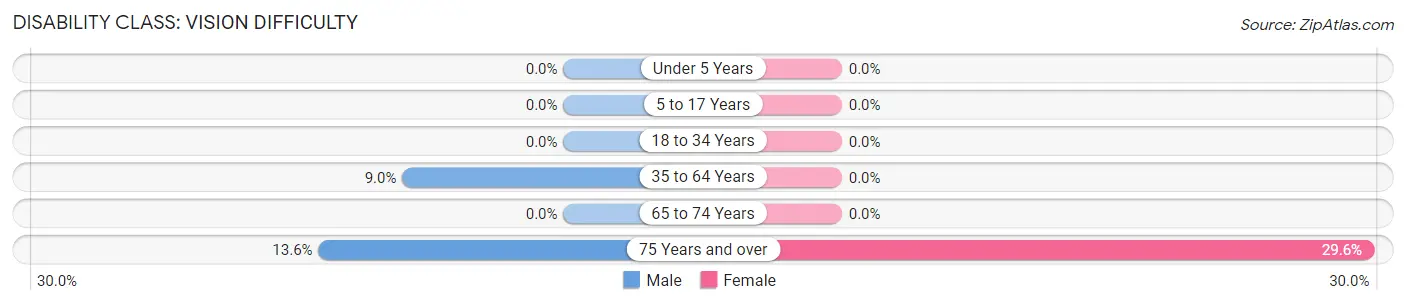
| Age Bracket | Male | Female |
| Under 5 Years | 0 (0.0%) | 0 (0.0%) |
| 5 to 17 Years | 0 (0.0%) | 0 (0.0%) |
| 18 to 34 Years | 0 (0.0%) | 0 (0.0%) |
| 35 to 64 Years | 7 (9.0%) | 0 (0.0%) |
| 65 to 74 Years | 0 (0.0%) | 0 (0.0%) |
| 75 Years and over | 3 (13.6%) | 8 (29.6%) |
Disability Class: Cognitive Difficulty
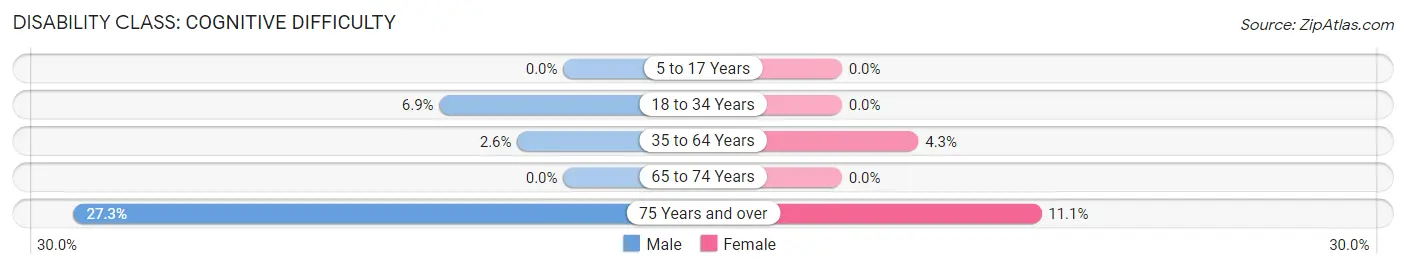
| Age Bracket | Male | Female |
| 5 to 17 Years | 0 (0.0%) | 0 (0.0%) |
| 18 to 34 Years | 2 (6.9%) | 0 (0.0%) |
| 35 to 64 Years | 2 (2.6%) | 4 (4.3%) |
| 65 to 74 Years | 0 (0.0%) | 0 (0.0%) |
| 75 Years and over | 6 (27.3%) | 3 (11.1%) |
Disability Class: Ambulatory Difficulty
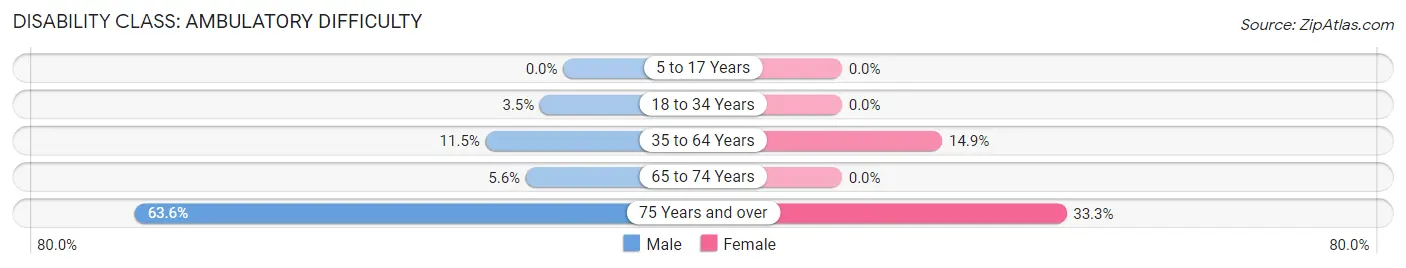
| Age Bracket | Male | Female |
| 5 to 17 Years | 0 (0.0%) | 0 (0.0%) |
| 18 to 34 Years | 1 (3.5%) | 0 (0.0%) |
| 35 to 64 Years | 9 (11.5%) | 14 (14.9%) |
| 65 to 74 Years | 1 (5.6%) | 0 (0.0%) |
| 75 Years and over | 14 (63.6%) | 9 (33.3%) |
Disability Class: Self-Care Difficulty
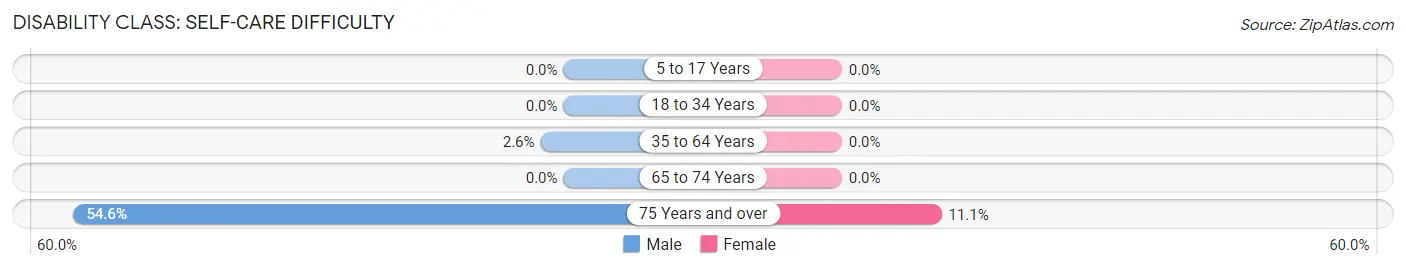
| Age Bracket | Male | Female |
| 5 to 17 Years | 0 (0.0%) | 0 (0.0%) |
| 18 to 34 Years | 0 (0.0%) | 0 (0.0%) |
| 35 to 64 Years | 2 (2.6%) | 0 (0.0%) |
| 65 to 74 Years | 0 (0.0%) | 0 (0.0%) |
| 75 Years and over | 12 (54.5%) | 3 (11.1%) |
Technology Access in Sale City
Computing Device Access in Sale City
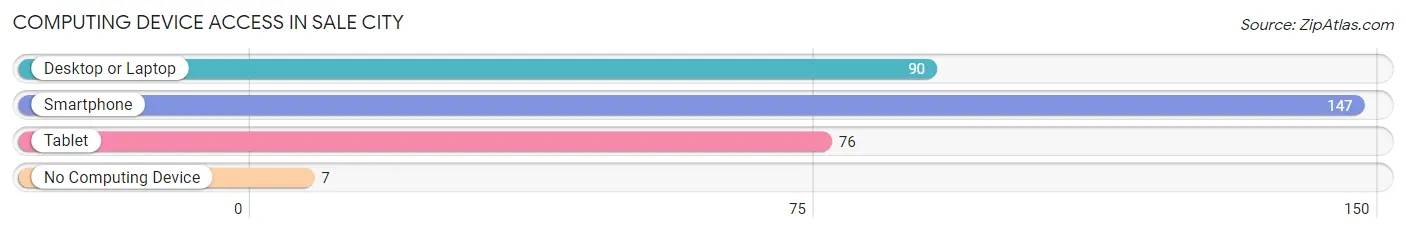
| Device Type | # Households | % Households |
| Desktop or Laptop | 90 | 57.0% |
| Smartphone | 147 | 93.0% |
| Tablet | 76 | 48.1% |
| No Computing Device | 7 | 4.4% |
| Total | 158 | 100.0% |
Internet Access in Sale City
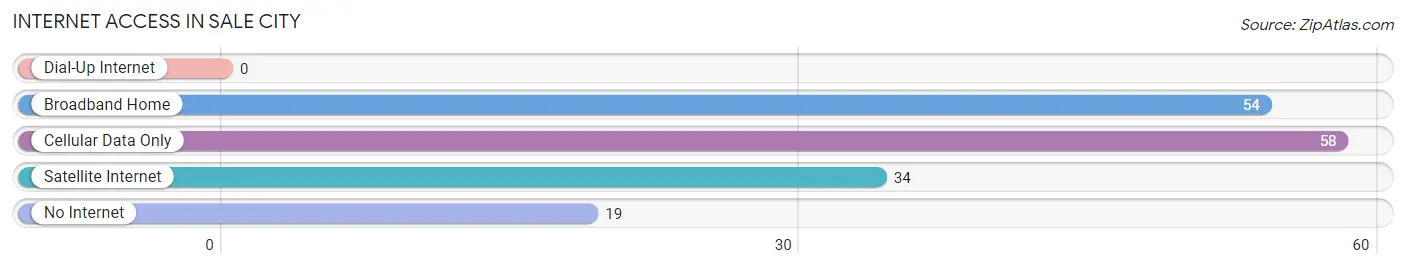
| Internet Type | # Households | % Households |
| Dial-Up Internet | 0 | 0.0% |
| Broadband Home | 54 | 34.2% |
| Cellular Data Only | 58 | 36.7% |
| Satellite Internet | 34 | 21.5% |
| No Internet | 19 | 12.0% |
| Total | 158 | 100.0% |
Sale City Summary
Sale City is a small town located in the southwestern corner of Georgia, United States. It is situated in the county of Decatur, and is part of the Albany metropolitan area. The town has a population of approximately 1,000 people, and is known for its rural charm and friendly atmosphere.
Geography
Sale City is located in the southwestern corner of Georgia, in Decatur County. It is situated at the intersection of US Highway 84 and Georgia State Route 33. The town is located approximately 20 miles from the city of Albany, and is surrounded by a number of small towns and rural communities. The terrain of the area is mostly flat, with some rolling hills and small streams. The climate is humid subtropical, with hot summers and mild winters.
Economy
Sale City’s economy is largely based on agriculture and forestry. The town is home to several farms, which produce a variety of crops, including cotton, corn, soybeans, and peanuts. The town also has a number of timber companies, which harvest and process timber for use in construction and other industries. In addition, Sale City is home to a number of small businesses, including restaurants, convenience stores, and auto repair shops.
Demographics
As of the 2010 census, Sale City had a population of 1,000 people. The racial makeup of the town was 79.2% White, 17.2% African American, 0.7% Native American, 0.3% Asian, and 2.6% from other races. The median household income was $25,000, and the median family income was $30,000. The per capita income was $14,000.
History
Sale City was founded in 1872 by a group of settlers from South Carolina. The town was named after a local creek, which was named after a prominent local family. The town grew slowly over the years, and by the early 1900s, it had become a thriving agricultural community. In the 1950s, the town began to experience a decline in population, as many of its residents moved away in search of better economic opportunities. However, in recent years, the town has seen a resurgence in population, as people have moved back to the area in search of a rural lifestyle.
Sale City is a small town with a rich history and a friendly atmosphere. It is a great place to live, work, and raise a family. The town is home to a number of small businesses, farms, and timber companies, and offers a variety of recreational activities. With its rural charm and friendly atmosphere, Sale City is a great place to call home.
Common Questions
What is Per Capita Income in Sale City?
Per Capita income in Sale City is $19,684.
What is the Median Family Income in Sale City?
Median Family Income in Sale City is $60,208.
What is the Median Household income in Sale City?
Median Household Income in Sale City is $43,571.
What is Income or Wage Gap in Sale City?
Income or Wage Gap in Sale City is 13.0%.
Women in Sale City earn 87.0 cents for every dollar earned by a man.
What is Inequality or Gini Index in Sale City?
Inequality or Gini Index in Sale City is 0.42.
What is the Total Population of Sale City?
Total Population of Sale City is 415.
What is the Total Male Population of Sale City?
Total Male Population of Sale City is 172.
What is the Total Female Population of Sale City?
Total Female Population of Sale City is 243.
What is the Ratio of Males per 100 Females in Sale City?
There are 70.78 Males per 100 Females in Sale City.
What is the Ratio of Females per 100 Males in Sale City?
There are 141.28 Females per 100 Males in Sale City.
What is the Median Population Age in Sale City?
Median Population Age in Sale City is 43.0 Years.
What is the Average Family Size in Sale City
Average Family Size in Sale City is 3.0 People.
What is the Average Household Size in Sale City
Average Household Size in Sale City is 2.6 People.
How Large is the Labor Force in Sale City?
There are 166 People in the Labor Forcein in Sale City.
What is the Percentage of People in the Labor Force in Sale City?
54.2% of People are in the Labor Force in Sale City.
What is the Unemployment Rate in Sale City?
Unemployment Rate in Sale City is 4.8%.