Lenox, GA Map & Demographics
Lenox Map
Lenox Overview
$20,232
PER CAPITA INCOME
$41,250
AVG FAMILY INCOME
$28,977
AVG HOUSEHOLD INCOME
$5,838
FAMILY INCOME DEFICIT
0.42
INEQUALITY / GINI INDEX
887
TOTAL POPULATION
502
MALE POPULATION
385
FEMALE POPULATION
130.39
MALES / 100 FEMALES
76.69
FEMALES / 100 MALES
32.3
MEDIAN AGE
3.4
AVG FAMILY SIZE
2.5
AVG HOUSEHOLD SIZE
453
LABOR FORCE [ PEOPLE ]
58.5%
PERCENT IN LABOR FORCE
6.4%
UNEMPLOYMENT RATE
Lenox Zip Codes
Lenox Area Codes
Income in Lenox
Income Overview in Lenox
Per Capita Income in Lenox is $20,232, while median incomes of families and households are $41,250 and $28,977 respectively.
| Characteristic | Number | Measure |
| Per Capita Income | 887 | $20,232 |
| Median Family Income | 216 | $41,250 |
| Mean Family Income | 216 | $54,848 |
| Median Household Income | 348 | $28,977 |
| Mean Household Income | 348 | $45,711 |
| Income Deficit | 216 | $5,838 |
| Wage / Income Gap (%) | 887 | 0.00% |
| Wage / Income Gap ($) | 887 | 100.00¢ per $1 |
| Gini / Inequality Index | 887 | 0.42 |
Earnings by Sex in Lenox
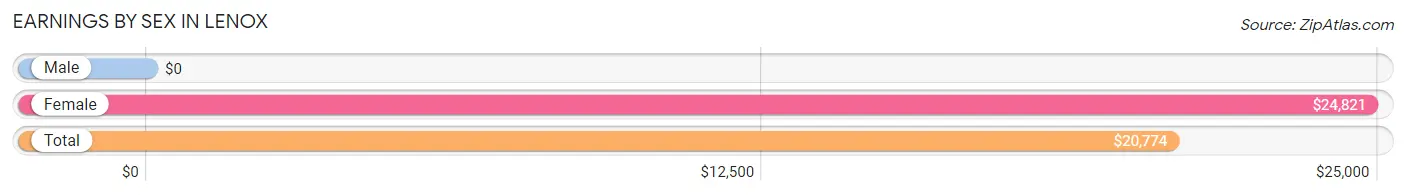
| Sex | Number | Average Earnings |
| Male | 286 (63.7%) | $0 |
| Female | 163 (36.3%) | $24,821 |
| Total | 449 (100.0%) | $20,774 |
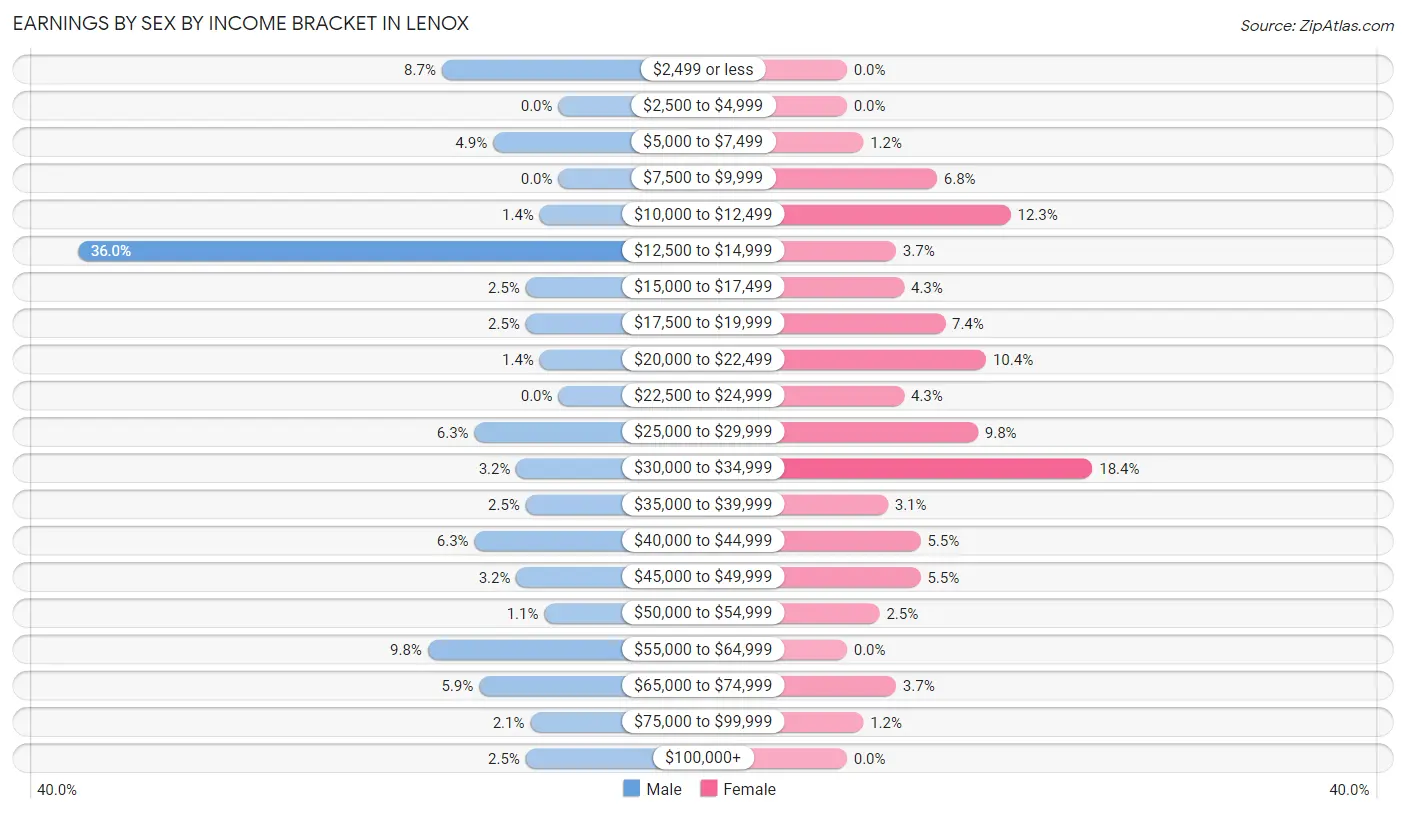
Earnings by Sex by Income Bracket in Lenox
The most common earnings brackets in Lenox are $12,500 to $14,999 for men (103 | 36.0%) and $30,000 to $34,999 for women (30 | 18.4%).
| Income | Male | Female |
| $2,499 or less | 25 (8.7%) | 0 (0.0%) |
| $2,500 to $4,999 | 0 (0.0%) | 0 (0.0%) |
| $5,000 to $7,499 | 14 (4.9%) | 2 (1.2%) |
| $7,500 to $9,999 | 0 (0.0%) | 11 (6.8%) |
| $10,000 to $12,499 | 4 (1.4%) | 20 (12.3%) |
| $12,500 to $14,999 | 103 (36.0%) | 6 (3.7%) |
| $15,000 to $17,499 | 7 (2.5%) | 7 (4.3%) |
| $17,500 to $19,999 | 7 (2.5%) | 12 (7.4%) |
| $20,000 to $22,499 | 4 (1.4%) | 17 (10.4%) |
| $22,500 to $24,999 | 0 (0.0%) | 7 (4.3%) |
| $25,000 to $29,999 | 18 (6.3%) | 16 (9.8%) |
| $30,000 to $34,999 | 9 (3.2%) | 30 (18.4%) |
| $35,000 to $39,999 | 7 (2.5%) | 5 (3.1%) |
| $40,000 to $44,999 | 18 (6.3%) | 9 (5.5%) |
| $45,000 to $49,999 | 9 (3.2%) | 9 (5.5%) |
| $50,000 to $54,999 | 3 (1.1%) | 4 (2.5%) |
| $55,000 to $64,999 | 28 (9.8%) | 0 (0.0%) |
| $65,000 to $74,999 | 17 (5.9%) | 6 (3.7%) |
| $75,000 to $99,999 | 6 (2.1%) | 2 (1.2%) |
| $100,000+ | 7 (2.5%) | 0 (0.0%) |
| Total | 286 (100.0%) | 163 (100.0%) |
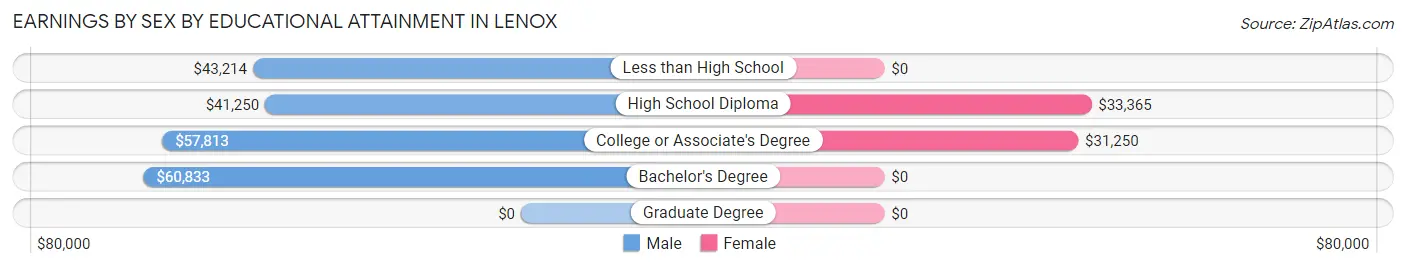
Earnings by Sex by Educational Attainment in Lenox
Average earnings in Lenox are $43,295 for men and $27,109 for women, a difference of 37.4%. Men with an educational attainment of bachelor's degree enjoy the highest average annual earnings of $60,833, while those with high school diploma education earn the least with $41,250. Women with an educational attainment of high school diploma earn the most with the average annual earnings of $33,365, while those with college or associate's degree education have the smallest earnings of $31,250.
| Educational Attainment | Male Income | Female Income |
| Less than High School | $43,214 | $0 |
| High School Diploma | $41,250 | $33,365 |
| College or Associate's Degree | $57,813 | $31,250 |
| Bachelor's Degree | $60,833 | $0 |
| Graduate Degree | - | - |
| Total | $43,295 | $27,109 |
Family Income in Lenox
Family Income Brackets in Lenox
According to the Lenox family income data, there are 58 families falling into the $25,000 to $34,999 income range, which is the most common income bracket and makes up 26.9% of all families.
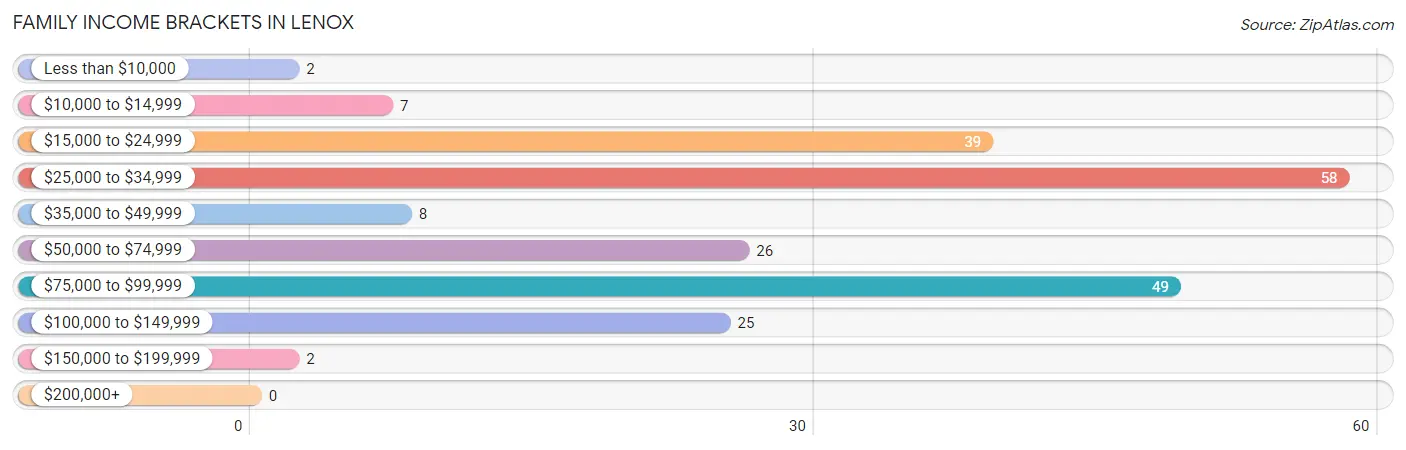
| Income Bracket | # Families | % Families |
| Less than $10,000 | 2 | 0.9% |
| $10,000 to $14,999 | 7 | 3.2% |
| $15,000 to $24,999 | 39 | 18.1% |
| $25,000 to $34,999 | 58 | 26.9% |
| $35,000 to $49,999 | 8 | 3.7% |
| $50,000 to $74,999 | 26 | 12.0% |
| $75,000 to $99,999 | 49 | 22.7% |
| $100,000 to $149,999 | 25 | 11.6% |
| $150,000 to $199,999 | 2 | 0.9% |
| $200,000+ | 0 | 0.0% |
Family Income by Famaliy Size in Lenox
3-person families (45 | 20.8%) account for the highest median family income in Lenox with $77,750 per family, while 3-person families (45 | 20.8%) have the highest median income of $25,917 per family member.
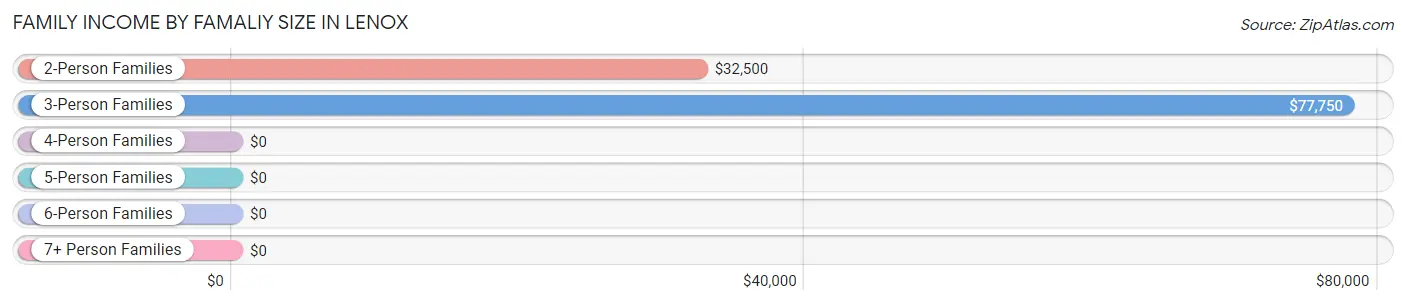
| Income Bracket | # Families | Median Income |
| 2-Person Families | 126 (58.3%) | $32,500 |
| 3-Person Families | 45 (20.8%) | $77,750 |
| 4-Person Families | 40 (18.5%) | $0 |
| 5-Person Families | 2 (0.9%) | $0 |
| 6-Person Families | 3 (1.4%) | $0 |
| 7+ Person Families | 0 (0.0%) | $0 |
| Total | 216 (100.0%) | $41,250 |
Family Income by Number of Earners in Lenox
The median family income in Lenox is $41,250, with families comprising 3+ earners (12) having the highest median family income of $108,750, while families with no earners (38) have the lowest median family income of $24,643, accounting for 5.6% and 17.6% of families, respectively.
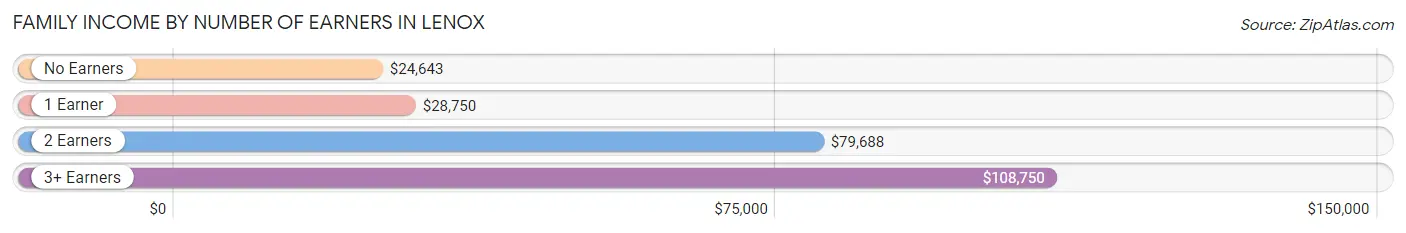
| Number of Earners | # Families | Median Income |
| No Earners | 38 (17.6%) | $24,643 |
| 1 Earner | 93 (43.1%) | $28,750 |
| 2 Earners | 73 (33.8%) | $79,688 |
| 3+ Earners | 12 (5.6%) | $108,750 |
| Total | 216 (100.0%) | $41,250 |
Household Income in Lenox
Household Income Brackets in Lenox
With 76 households falling in the category, the $15,000 to $24,999 income range is the most frequent in Lenox, accounting for 21.8% of all households.
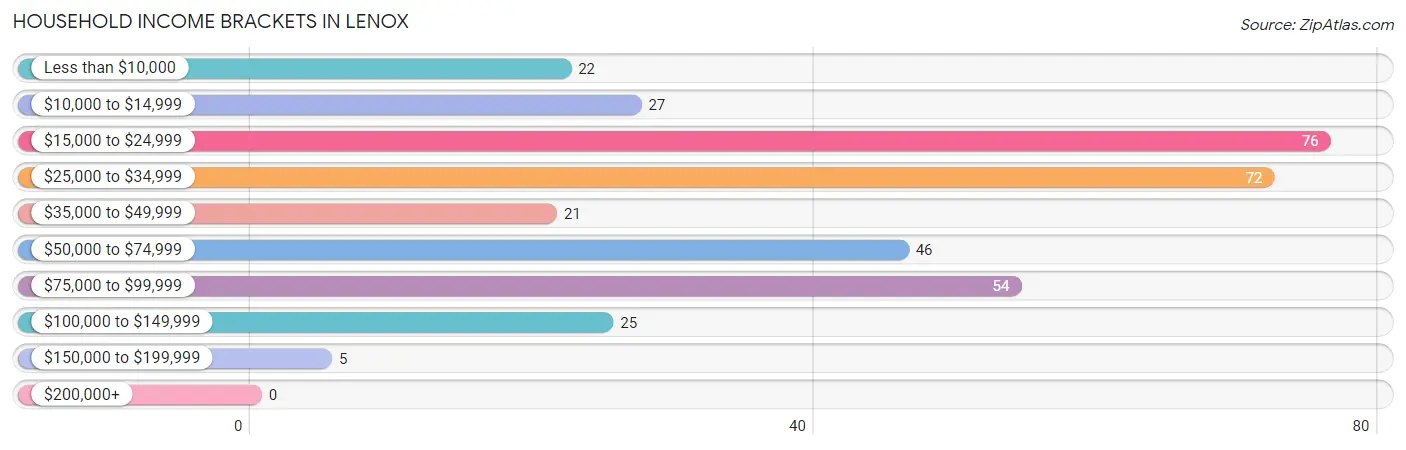
| Income Bracket | # Households | % Households |
| Less than $10,000 | 22 | 6.3% |
| $10,000 to $14,999 | 27 | 7.8% |
| $15,000 to $24,999 | 76 | 21.8% |
| $25,000 to $34,999 | 72 | 20.7% |
| $35,000 to $49,999 | 21 | 6.0% |
| $50,000 to $74,999 | 46 | 13.2% |
| $75,000 to $99,999 | 54 | 15.5% |
| $100,000 to $149,999 | 25 | 7.2% |
| $150,000 to $199,999 | 5 | 1.4% |
| $200,000+ | 0 | 0.0% |
Household Income by Householder Age in Lenox
The median household income in Lenox is $28,977, with the highest median household income of $41,607 found in the 25 to 44 years age bracket for the primary householder. A total of 105 households (30.2%) fall into this category.
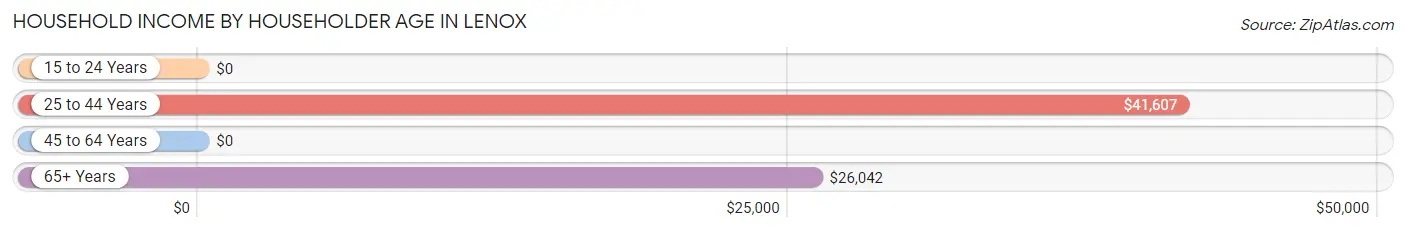
| Income Bracket | # Households | Median Income |
| 15 to 24 Years | 0 (0.0%) | $0 |
| 25 to 44 Years | 105 (30.2%) | $41,607 |
| 45 to 64 Years | 100 (28.7%) | $0 |
| 65+ Years | 143 (41.1%) | $26,042 |
| Total | 348 (100.0%) | $28,977 |
Poverty in Lenox
Income Below Poverty by Sex and Age in Lenox
With 14.7% poverty level for males and 27.5% for females among the residents of Lenox, 12 to 14 year old males and 16 and 17 year old females are the most vulnerable to poverty, with 6 males (100.0%) and 13 females (76.5%) in their respective age groups living below the poverty level.
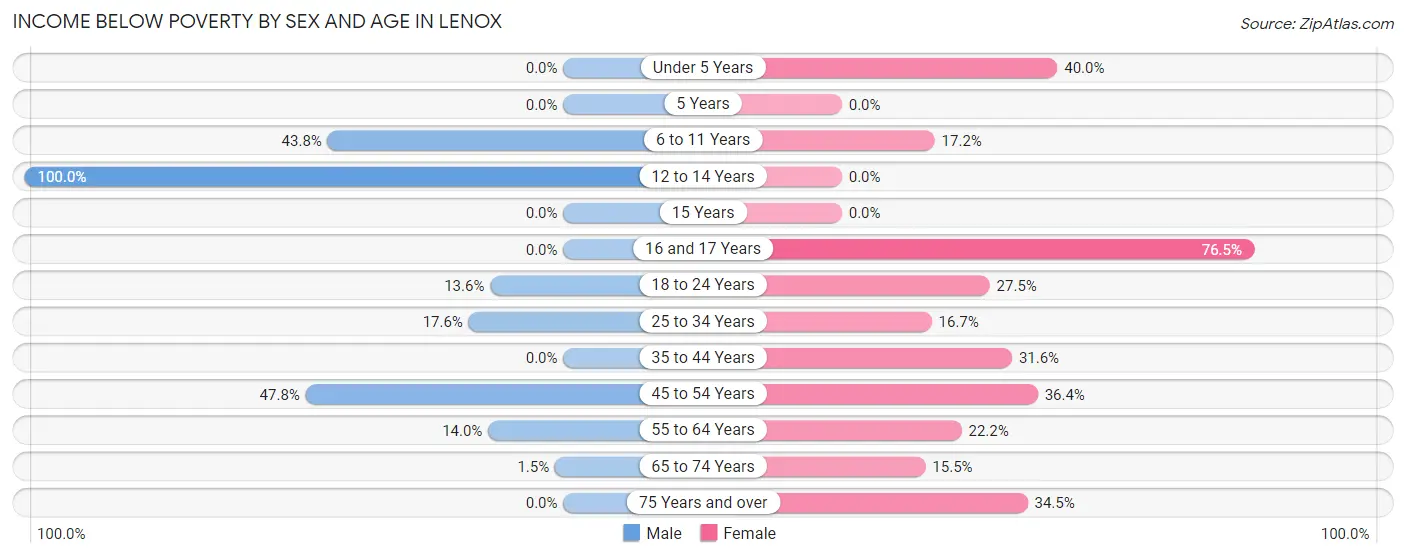
| Age Bracket | Male | Female |
| Under 5 Years | 0 (0.0%) | 6 (40.0%) |
| 5 Years | 0 (0.0%) | 0 (0.0%) |
| 6 to 11 Years | 7 (43.8%) | 5 (17.2%) |
| 12 to 14 Years | 6 (100.0%) | 0 (0.0%) |
| 15 Years | 0 (0.0%) | 0 (0.0%) |
| 16 and 17 Years | 0 (0.0%) | 13 (76.5%) |
| 18 to 24 Years | 19 (13.6%) | 14 (27.5%) |
| 25 to 34 Years | 13 (17.6%) | 11 (16.7%) |
| 35 to 44 Years | 0 (0.0%) | 12 (31.6%) |
| 45 to 54 Years | 22 (47.8%) | 20 (36.4%) |
| 55 to 64 Years | 6 (14.0%) | 6 (22.2%) |
| 65 to 74 Years | 1 (1.5%) | 9 (15.5%) |
| 75 Years and over | 0 (0.0%) | 10 (34.5%) |
| Total | 74 (14.7%) | 106 (27.5%) |
Income Above Poverty by Sex and Age in Lenox
According to the poverty statistics in Lenox, males aged under 5 years and females aged 65 to 74 years are the age groups that are most secure financially, with 100.0% of males and 84.5% of females in these age groups living above the poverty line.
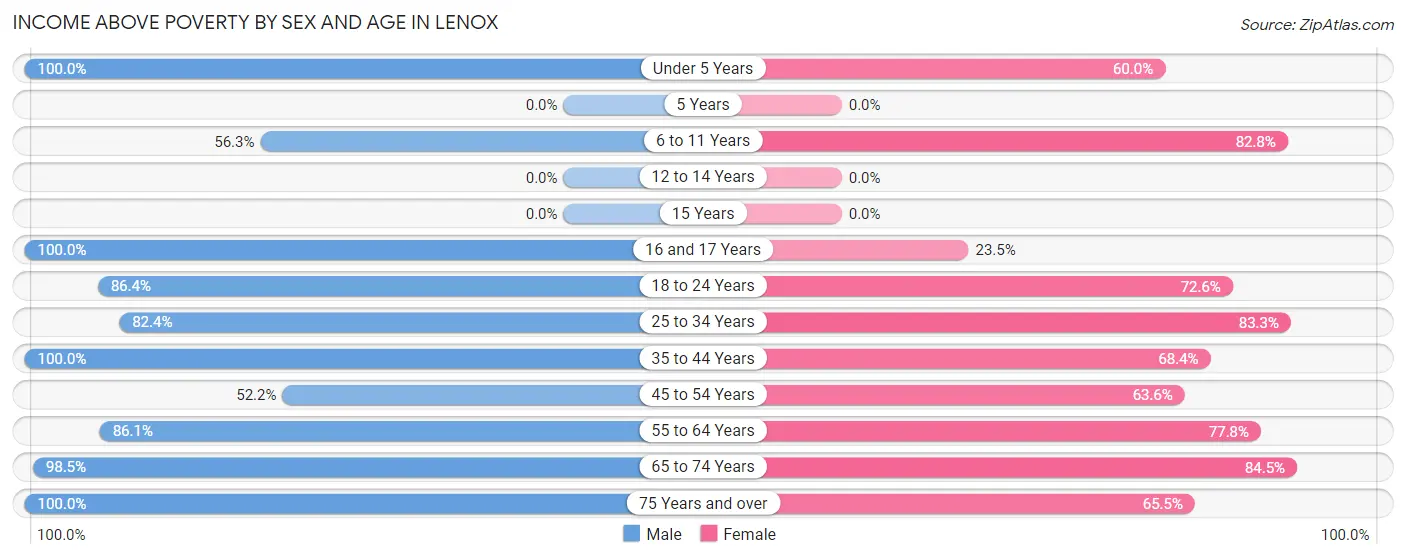
| Age Bracket | Male | Female |
| Under 5 Years | 46 (100.0%) | 9 (60.0%) |
| 5 Years | 0 (0.0%) | 0 (0.0%) |
| 6 to 11 Years | 9 (56.2%) | 24 (82.8%) |
| 12 to 14 Years | 0 (0.0%) | 0 (0.0%) |
| 15 Years | 0 (0.0%) | 0 (0.0%) |
| 16 and 17 Years | 6 (100.0%) | 4 (23.5%) |
| 18 to 24 Years | 121 (86.4%) | 37 (72.6%) |
| 25 to 34 Years | 61 (82.4%) | 55 (83.3%) |
| 35 to 44 Years | 20 (100.0%) | 26 (68.4%) |
| 45 to 54 Years | 24 (52.2%) | 35 (63.6%) |
| 55 to 64 Years | 37 (86.1%) | 21 (77.8%) |
| 65 to 74 Years | 64 (98.5%) | 49 (84.5%) |
| 75 Years and over | 40 (100.0%) | 19 (65.5%) |
| Total | 428 (85.3%) | 279 (72.5%) |
Income Below Poverty Among Married-Couple Families in Lenox
The poverty statistics for married-couple families in Lenox show that 16.3% or 20 of the total 123 families live below the poverty line. Families with 1 or 2 children have the highest poverty rate of 25.6%, comprising of 11 families. On the other hand, families with 3 or 4 children have the lowest poverty rate of 0.0%, which includes 0 families.
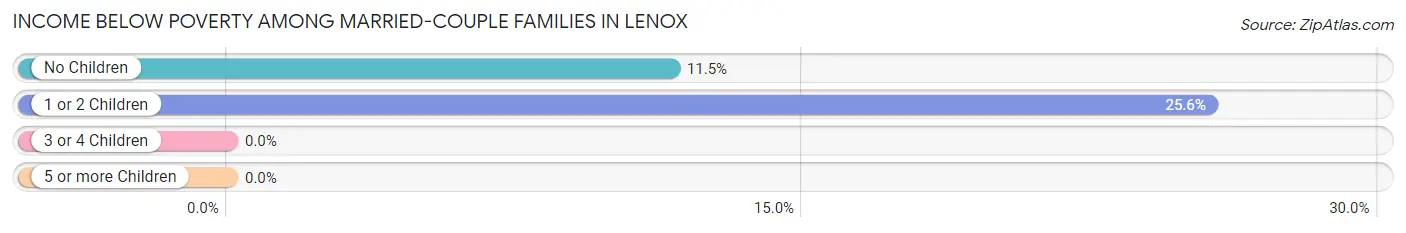
| Children | Above Poverty | Below Poverty |
| No Children | 69 (88.5%) | 9 (11.5%) |
| 1 or 2 Children | 32 (74.4%) | 11 (25.6%) |
| 3 or 4 Children | 2 (100.0%) | 0 (0.0%) |
| 5 or more Children | 0 (0.0%) | 0 (0.0%) |
| Total | 103 (83.7%) | 20 (16.3%) |
Income Below Poverty Among Single-Parent Households in Lenox
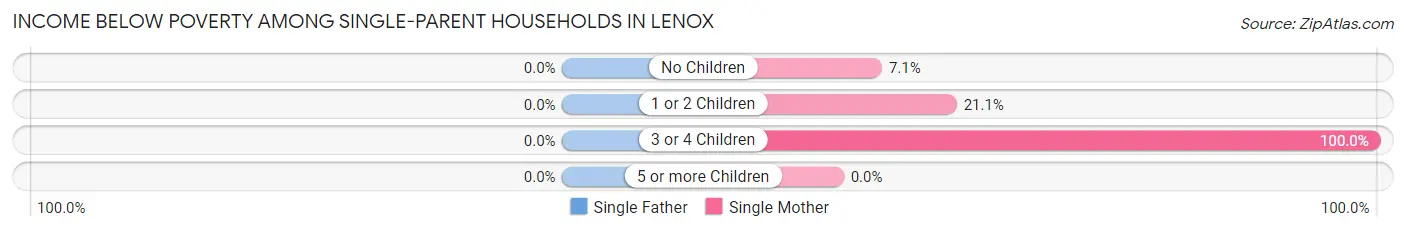
| Children | Single Father | Single Mother |
| No Children | 0 (0.0%) | 2 (7.1%) |
| 1 or 2 Children | 0 (0.0%) | 4 (21.0%) |
| 3 or 4 Children | 0 (0.0%) | 6 (100.0%) |
| 5 or more Children | 0 (0.0%) | 0 (0.0%) |
| Total | 0 (0.0%) | 12 (22.6%) |
Income Below Poverty Among Married-Couple vs Single-Parent Households in Lenox
The poverty data for Lenox shows that 20 of the married-couple family households (16.3%) and 12 of the single-parent households (12.9%) are living below the poverty level. Within the married-couple family households, those with 1 or 2 children have the highest poverty rate, with 11 households (25.6%) falling below the poverty line. Among the single-parent households, those with 3 or 4 children have the highest poverty rate, with 6 household (100.0%) living below poverty.
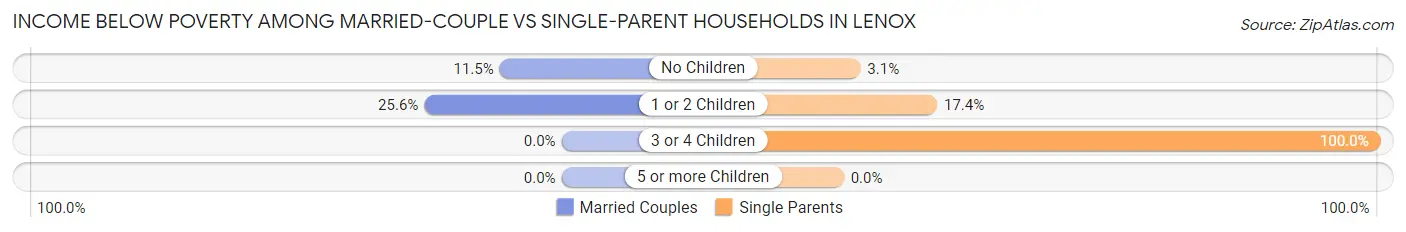
| Children | Married-Couple Families | Single-Parent Households |
| No Children | 9 (11.5%) | 2 (3.1%) |
| 1 or 2 Children | 11 (25.6%) | 4 (17.4%) |
| 3 or 4 Children | 0 (0.0%) | 6 (100.0%) |
| 5 or more Children | 0 (0.0%) | 0 (0.0%) |
| Total | 20 (16.3%) | 12 (12.9%) |
Race in Lenox
The most populous races in Lenox are White / Caucasian (583 | 65.7%), Black / African American (295 | 33.3%), and Hispanic or Latino (55 | 6.2%).
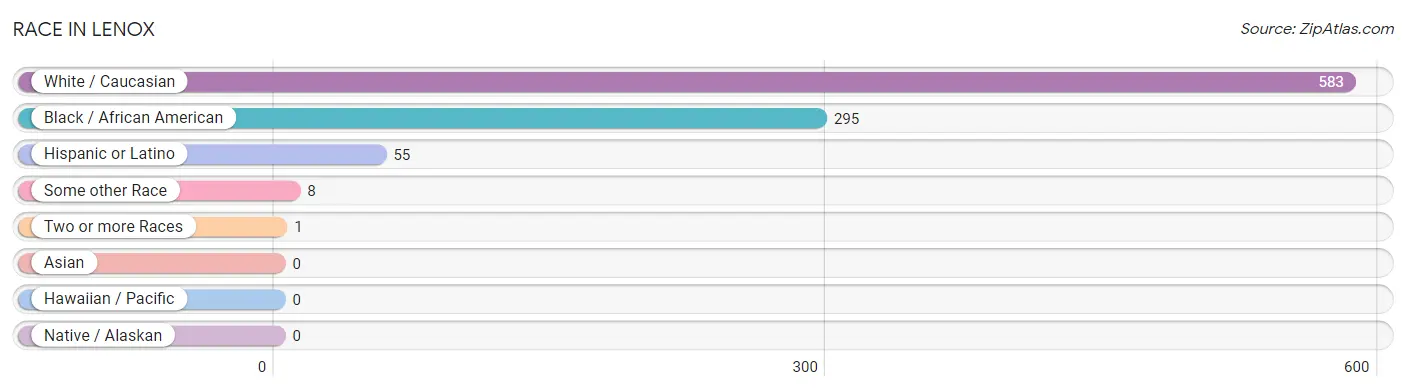
| Race | # Population | % Population |
| Asian | 0 | 0.0% |
| Black / African American | 295 | 33.3% |
| Hawaiian / Pacific | 0 | 0.0% |
| Hispanic or Latino | 55 | 6.2% |
| Native / Alaskan | 0 | 0.0% |
| White / Caucasian | 583 | 65.7% |
| Two or more Races | 1 | 0.1% |
| Some other Race | 8 | 0.9% |
| Total | 887 | 100.0% |
Ancestry in Lenox
The most populous ancestries reported in Lenox are American (71 | 8.0%), Irish (50 | 5.6%), German (33 | 3.7%), Puerto Rican (33 | 3.7%), and English (28 | 3.2%), together accounting for 24.2% of all Lenox residents.
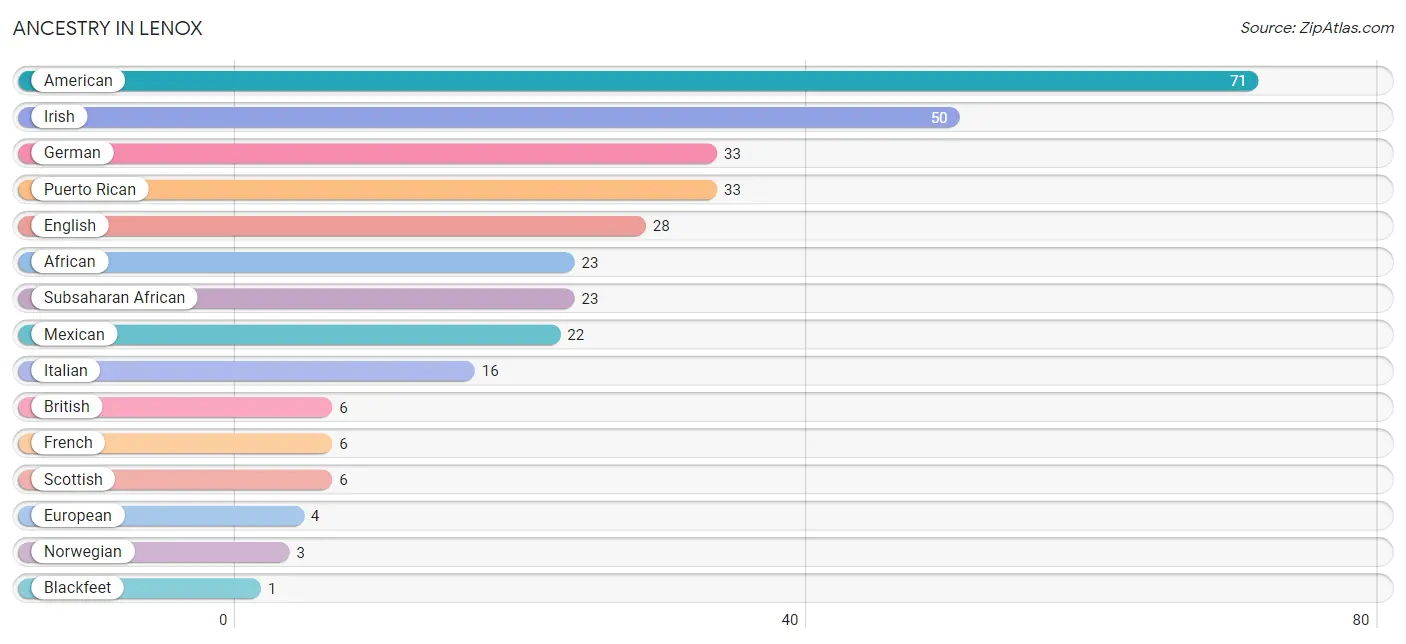
| Ancestry | # Population | % Population |
| African | 23 | 2.6% |
| American | 71 | 8.0% |
| Blackfeet | 1 | 0.1% |
| British | 6 | 0.7% |
| English | 28 | 3.2% |
| European | 4 | 0.4% |
| French | 6 | 0.7% |
| German | 33 | 3.7% |
| Irish | 50 | 5.6% |
| Italian | 16 | 1.8% |
| Mexican | 22 | 2.5% |
| Norwegian | 3 | 0.3% |
| Puerto Rican | 33 | 3.7% |
| Scottish | 6 | 0.7% |
| Subsaharan African | 23 | 2.6% | View All 15 Rows |
Immigrants in Lenox
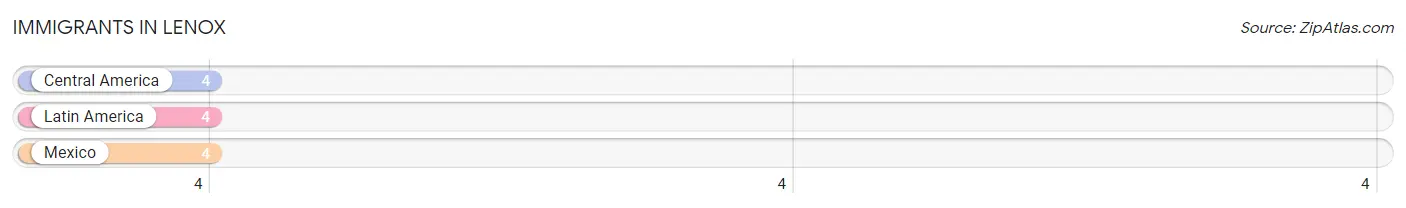
The most numerous immigrant groups reported in Lenox came from Central America (4 | 0.4%), Latin America (4 | 0.4%), and Mexico (4 | 0.4%), together accounting for 1.3% of all Lenox residents.
| Immigration Origin | # Population | % Population |
| Central America | 4 | 0.4% |
| Latin America | 4 | 0.4% |
| Mexico | 4 | 0.4% | View All 3 Rows |
Sex and Age in Lenox
Sex and Age in Lenox
The most populous age groups in Lenox are 20 to 24 Years (125 | 24.9%) for men and 25 to 29 Years (50 | 13.0%) for women.

| Age Bracket | Male | Female |
| Under 5 Years | 46 (9.2%) | 15 (3.9%) |
| 5 to 9 Years | 9 (1.8%) | 23 (6.0%) |
| 10 to 14 Years | 13 (2.6%) | 6 (1.6%) |
| 15 to 19 Years | 21 (4.2%) | 24 (6.2%) |
| 20 to 24 Years | 125 (24.9%) | 44 (11.4%) |
| 25 to 29 Years | 44 (8.8%) | 50 (13.0%) |
| 30 to 34 Years | 30 (6.0%) | 16 (4.2%) |
| 35 to 39 Years | 17 (3.4%) | 10 (2.6%) |
| 40 to 44 Years | 3 (0.6%) | 28 (7.3%) |
| 45 to 49 Years | 17 (3.4%) | 29 (7.5%) |
| 50 to 54 Years | 29 (5.8%) | 26 (6.8%) |
| 55 to 59 Years | 25 (5.0%) | 18 (4.7%) |
| 60 to 64 Years | 18 (3.6%) | 9 (2.3%) |
| 65 to 69 Years | 15 (3.0%) | 42 (10.9%) |
| 70 to 74 Years | 50 (10.0%) | 16 (4.2%) |
| 75 to 79 Years | 32 (6.4%) | 12 (3.1%) |
| 80 to 84 Years | 7 (1.4%) | 10 (2.6%) |
| 85 Years and over | 1 (0.2%) | 7 (1.8%) |
| Total | 502 (100.0%) | 385 (100.0%) |
Families and Households in Lenox
Median Family Size in Lenox
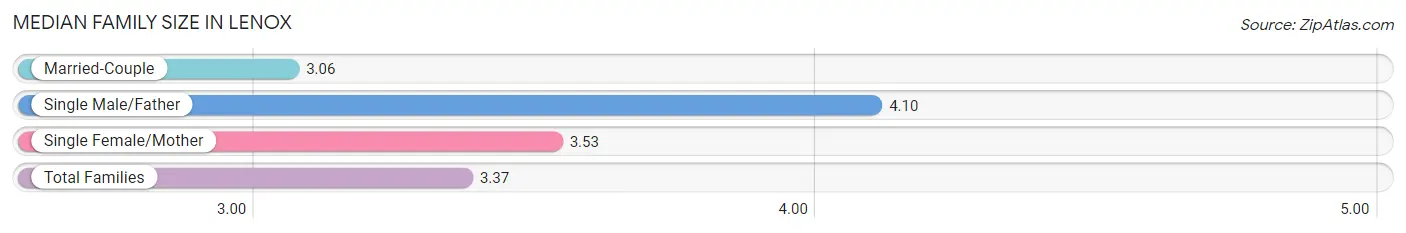
The median family size in Lenox is 3.37 persons per family, with single male/father families (40 | 18.5%) accounting for the largest median family size of 4.1 persons per family. On the other hand, married-couple families (123 | 56.9%) represent the smallest median family size with 3.06 persons per family.
| Family Type | # Families | Family Size |
| Married-Couple | 123 (56.9%) | 3.06 |
| Single Male/Father | 40 (18.5%) | 4.10 |
| Single Female/Mother | 53 (24.5%) | 3.53 |
| Total Families | 216 (100.0%) | 3.37 |
Median Household Size in Lenox
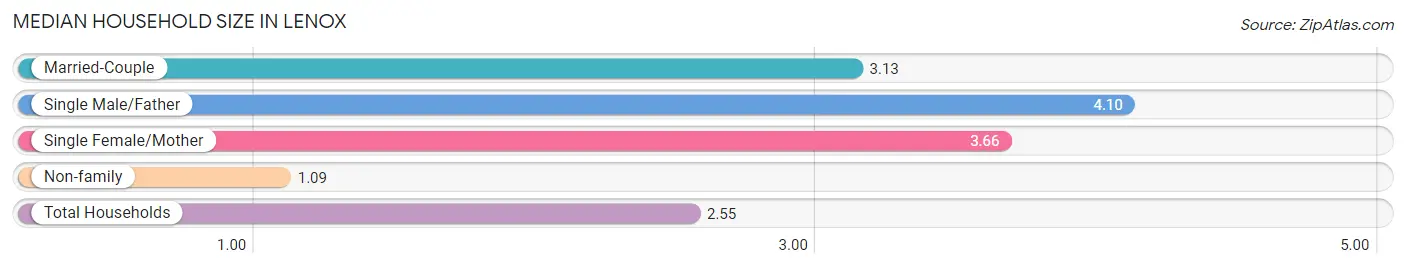
The median household size in Lenox is 2.55 persons per household, with single male/father households (40 | 11.5%) accounting for the largest median household size of 4.1 persons per household. non-family households (132 | 37.9%) represent the smallest median household size with 1.09 persons per household.
| Household Type | # Households | Household Size |
| Married-Couple | 123 (35.3%) | 3.13 |
| Single Male/Father | 40 (11.5%) | 4.10 |
| Single Female/Mother | 53 (15.2%) | 3.66 |
| Non-family | 132 (37.9%) | 1.09 |
| Total Households | 348 (100.0%) | 2.55 |
Household Size by Marriage Status in Lenox
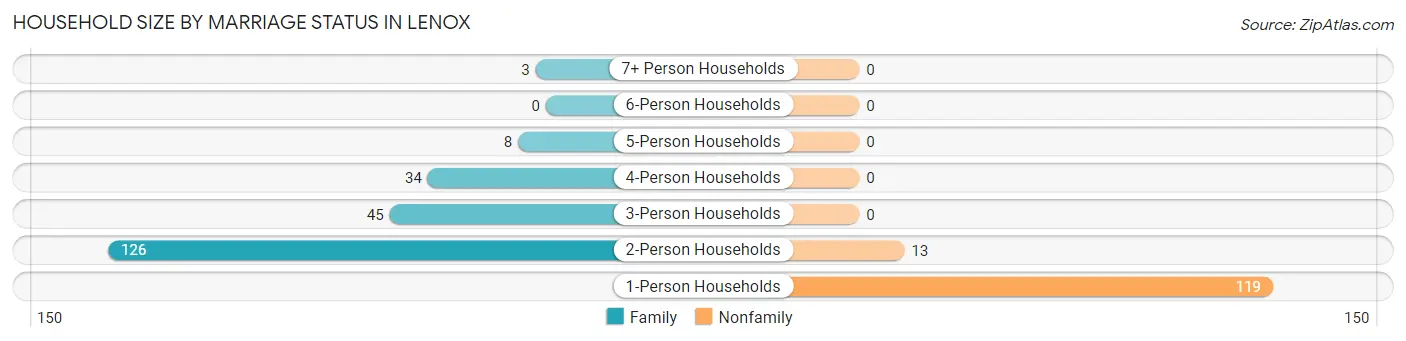
Out of a total of 348 households in Lenox, 216 (62.1%) are family households, while 132 (37.9%) are nonfamily households. The most numerous type of family households are 2-person households, comprising 126, and the most common type of nonfamily households are 1-person households, comprising 119.
| Household Size | Family Households | Nonfamily Households |
| 1-Person Households | - | 119 (34.2%) |
| 2-Person Households | 126 (36.2%) | 13 (3.7%) |
| 3-Person Households | 45 (12.9%) | 0 (0.0%) |
| 4-Person Households | 34 (9.8%) | 0 (0.0%) |
| 5-Person Households | 8 (2.3%) | 0 (0.0%) |
| 6-Person Households | 0 (0.0%) | 0 (0.0%) |
| 7+ Person Households | 3 (0.9%) | 0 (0.0%) |
| Total | 216 (62.1%) | 132 (37.9%) |
Female Fertility in Lenox
Fertility by Age in Lenox
Average fertility rate in Lenox is 95.0 births per 1,000 women. Women in the age bracket of 20 to 34 years have the highest fertility rate with 173.0 births per 1,000 women. Women in the age bracket of 20 to 34 years acount for 100.0% of all women with births.
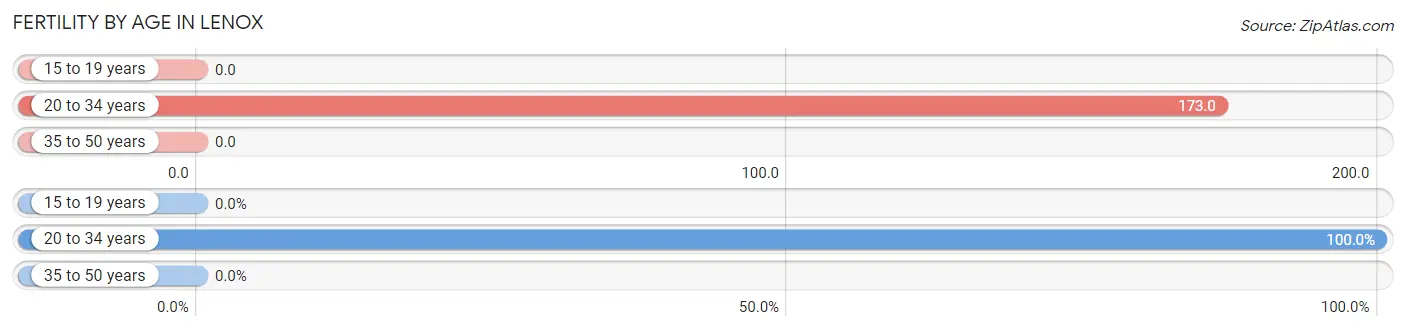
| Age Bracket | Women with Births | Births / 1,000 Women |
| 15 to 19 years | 0 (0.0%) | 0.0 |
| 20 to 34 years | 19 (100.0%) | 173.0 |
| 35 to 50 years | 0 (0.0%) | 0.0 |
| Total | 19 (100.0%) | 95.0 |
Fertility by Age by Marriage Status in Lenox
57.9% of women with births (19) in Lenox are married. The highest percentage of unmarried women with births falls into 20 to 34 years age bracket with 42.1% of them unmarried at the time of birth, while the lowest percentage of unmarried women with births belong to 20 to 34 years age bracket with 42.1% of them unmarried.
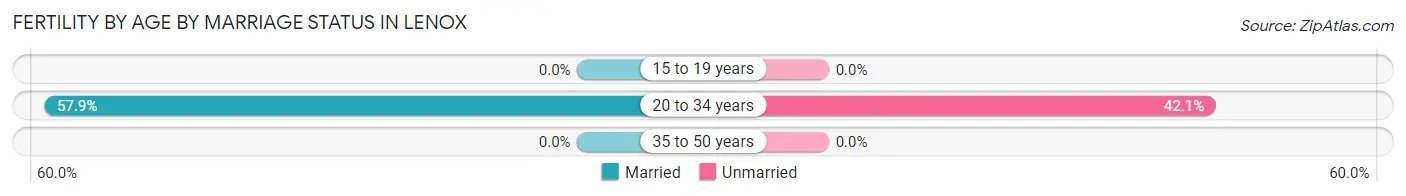
| Age Bracket | Married | Unmarried |
| 15 to 19 years | 0 (0.0%) | 0 (0.0%) |
| 20 to 34 years | 11 (57.9%) | 8 (42.1%) |
| 35 to 50 years | 0 (0.0%) | 0 (0.0%) |
| Total | 11 (57.9%) | 8 (42.1%) |
Fertility by Education in Lenox
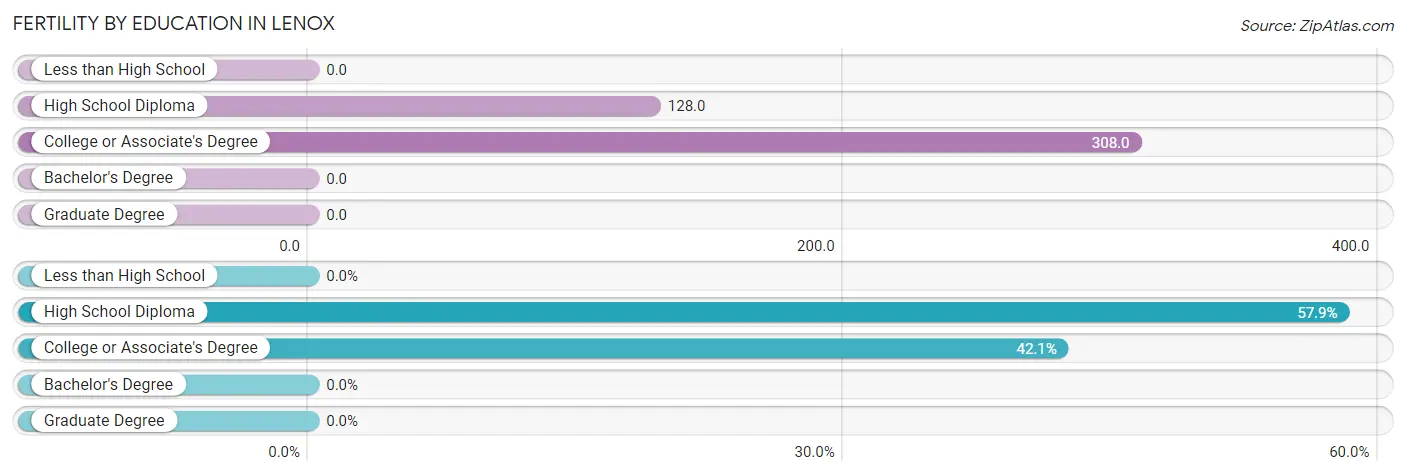
| Educational Attainment | Women with Births | Births / 1,000 Women |
| Less than High School | 0 (0.0%) | 0.0 |
| High School Diploma | 11 (57.9%) | 128.0 |
| College or Associate's Degree | 8 (42.1%) | 308.0 |
| Bachelor's Degree | 0 (0.0%) | 0.0 |
| Graduate Degree | 0 (0.0%) | 0.0 |
| Total | 19 (100.0%) | 95.0 |
Fertility by Education by Marriage Status in Lenox
42.1% of women with births in Lenox are unmarried. Women with the educational attainment of high school diploma are most likely to be married with 100.0% of them married at childbirth, while women with the educational attainment of college or associate's degree are least likely to be married with 100.0% of them unmarried at childbirth.
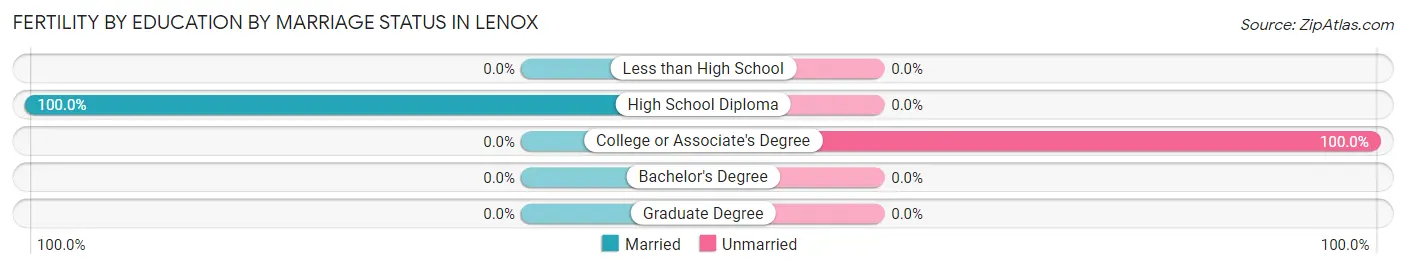
| Educational Attainment | Married | Unmarried |
| Less than High School | 0 (0.0%) | 0 (0.0%) |
| High School Diploma | 11 (100.0%) | 0 (0.0%) |
| College or Associate's Degree | 0 (0.0%) | 8 (100.0%) |
| Bachelor's Degree | 0 (0.0%) | 0 (0.0%) |
| Graduate Degree | 0 (0.0%) | 0 (0.0%) |
| Total | 11 (57.9%) | 8 (42.1%) |
Employment Characteristics in Lenox
Employment by Class of Employer in Lenox
Among the 410 employed individuals in Lenox, private company employees (340 | 82.9%), not-for-profit organizations (37 | 9.0%), and local government employees (11 | 2.7%) make up the most common classes of employment.
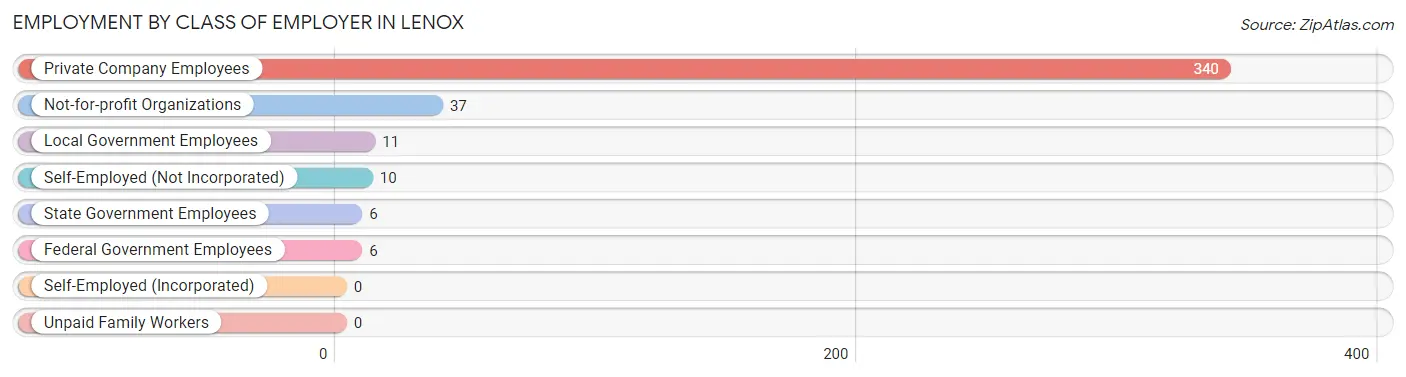
| Employer Class | # Employees | % Employees |
| Private Company Employees | 340 | 82.9% |
| Self-Employed (Incorporated) | 0 | 0.0% |
| Self-Employed (Not Incorporated) | 10 | 2.4% |
| Not-for-profit Organizations | 37 | 9.0% |
| Local Government Employees | 11 | 2.7% |
| State Government Employees | 6 | 1.5% |
| Federal Government Employees | 6 | 1.5% |
| Unpaid Family Workers | 0 | 0.0% |
| Total | 410 | 100.0% |
Employment Status by Age in Lenox
According to the labor force statistics for Lenox, out of the total population over 16 years of age (775), 58.5% or 453 individuals are in the labor force, with 6.4% or 29 of them unemployed. The age group with the highest labor force participation rate is 30 to 34 years, with 100.0% or 46 individuals in the labor force. Within the labor force, the 16 to 19 years age range has the highest percentage of unemployed individuals, with 68.2% or 15 of them being unemployed.
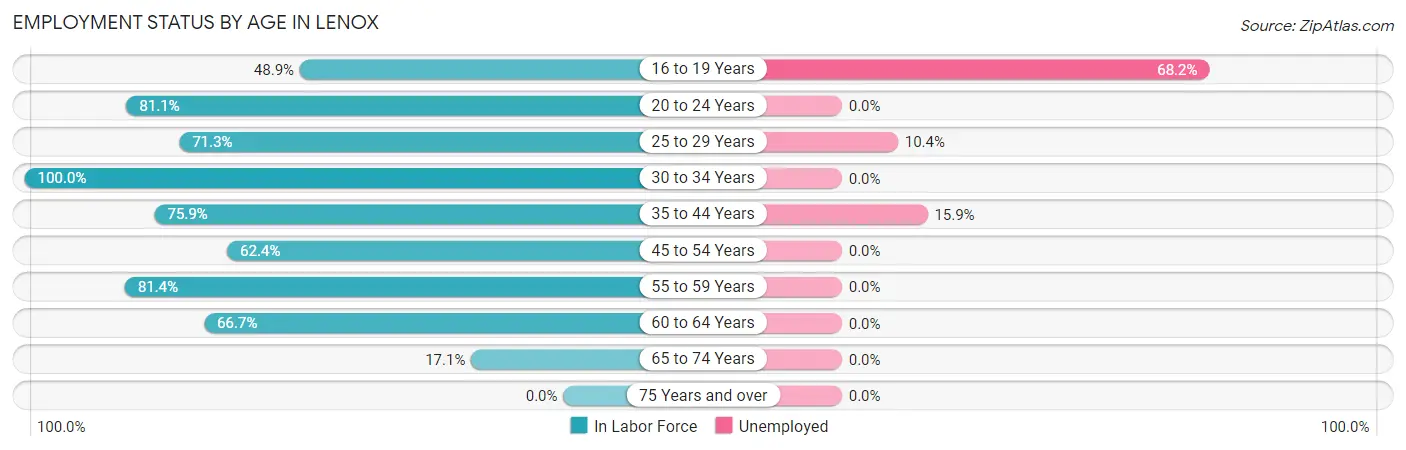
| Age Bracket | In Labor Force | Unemployed |
| 16 to 19 Years | 22 (48.9%) | 15 (68.2%) |
| 20 to 24 Years | 137 (81.1%) | 0 (0.0%) |
| 25 to 29 Years | 67 (71.3%) | 7 (10.4%) |
| 30 to 34 Years | 46 (100.0%) | 0 (0.0%) |
| 35 to 44 Years | 44 (75.9%) | 7 (15.9%) |
| 45 to 54 Years | 63 (62.4%) | 0 (0.0%) |
| 55 to 59 Years | 35 (81.4%) | 0 (0.0%) |
| 60 to 64 Years | 18 (66.7%) | 0 (0.0%) |
| 65 to 74 Years | 21 (17.1%) | 0 (0.0%) |
| 75 Years and over | 0 (0.0%) | 0 (0.0%) |
| Total | 453 (58.5%) | 29 (6.4%) |
Employment Status by Educational Attainment in Lenox
According to labor force statistics for Lenox, 74.0% of individuals (273) out of the total population between 25 and 64 years of age (369) are in the labor force, with 5.1% or 14 of them being unemployed. The group with the highest labor force participation rate are those with the educational attainment of college / associate degree, with 100.0% or 50 individuals in the labor force. Within the labor force, individuals with less than high school education have the highest percentage of unemployment, with 8.9% or 4 of them being unemployed.
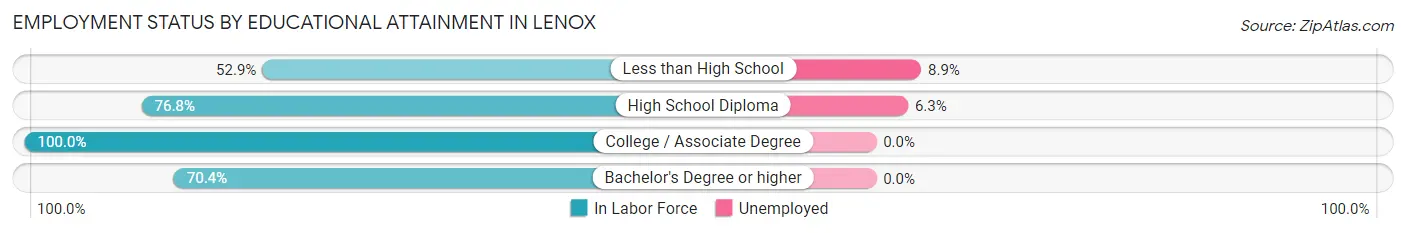
| Educational Attainment | In Labor Force | Unemployed |
| Less than High School | 45 (52.9%) | 8 (8.9%) |
| High School Diploma | 159 (76.8%) | 13 (6.3%) |
| College / Associate Degree | 50 (100.0%) | 0 (0.0%) |
| Bachelor's Degree or higher | 19 (70.4%) | 0 (0.0%) |
| Total | 273 (74.0%) | 19 (5.1%) |
Employment Occupations by Sex in Lenox
Management, Business, Science and Arts Occupations
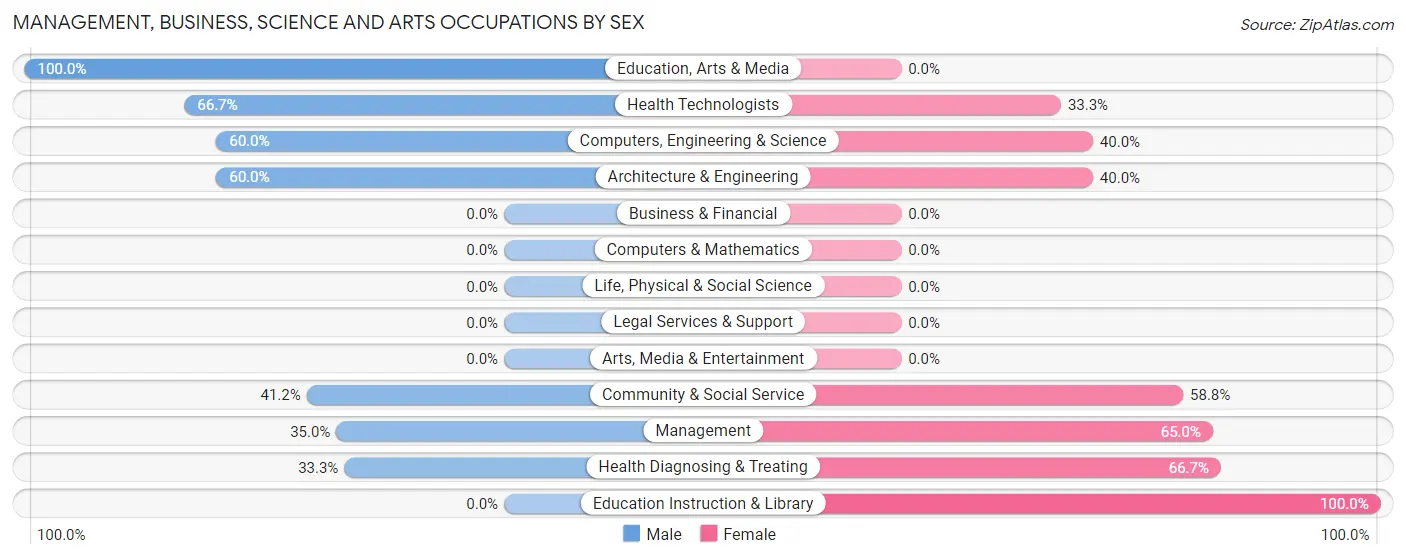
The most common Management, Business, Science and Arts occupations in Lenox are Management (20 | 4.7%), Community & Social Service (17 | 4.0%), Health Diagnosing & Treating (12 | 2.8%), Education Instruction & Library (10 | 2.4%), and Education, Arts & Media (7 | 1.7%).
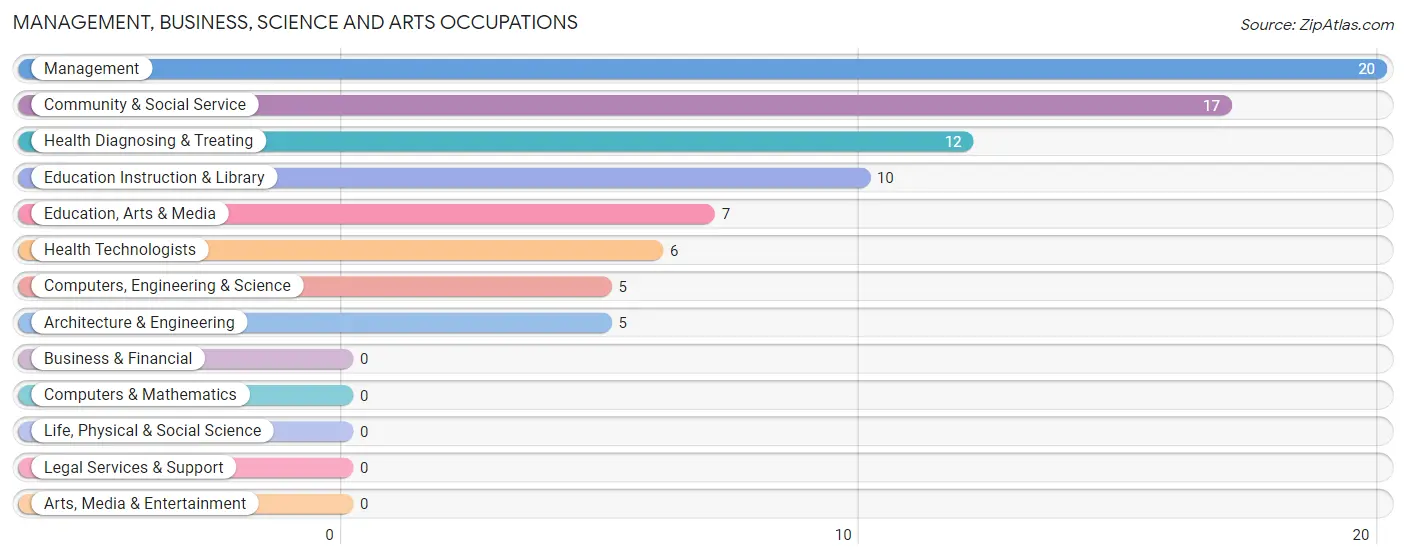
Management, Business, Science and Arts Occupations by Sex
Within the Management, Business, Science and Arts occupations in Lenox, the most male-oriented occupations are Education, Arts & Media (100.0%), Health Technologists (66.7%), and Computers, Engineering & Science (60.0%), while the most female-oriented occupations are Education Instruction & Library (100.0%), Health Diagnosing & Treating (66.7%), and Management (65.0%).
| Occupation | Male | Female |
| Management | 7 (35.0%) | 13 (65.0%) |
| Business & Financial | 0 (0.0%) | 0 (0.0%) |
| Computers, Engineering & Science | 3 (60.0%) | 2 (40.0%) |
| Computers & Mathematics | 0 (0.0%) | 0 (0.0%) |
| Architecture & Engineering | 3 (60.0%) | 2 (40.0%) |
| Life, Physical & Social Science | 0 (0.0%) | 0 (0.0%) |
| Community & Social Service | 7 (41.2%) | 10 (58.8%) |
| Education, Arts & Media | 7 (100.0%) | 0 (0.0%) |
| Legal Services & Support | 0 (0.0%) | 0 (0.0%) |
| Education Instruction & Library | 0 (0.0%) | 10 (100.0%) |
| Arts, Media & Entertainment | 0 (0.0%) | 0 (0.0%) |
| Health Diagnosing & Treating | 4 (33.3%) | 8 (66.7%) |
| Health Technologists | 4 (66.7%) | 2 (33.3%) |
| Total (Category) | 21 (38.9%) | 33 (61.1%) |
| Total (Overall) | 261 (61.6%) | 163 (38.4%) |
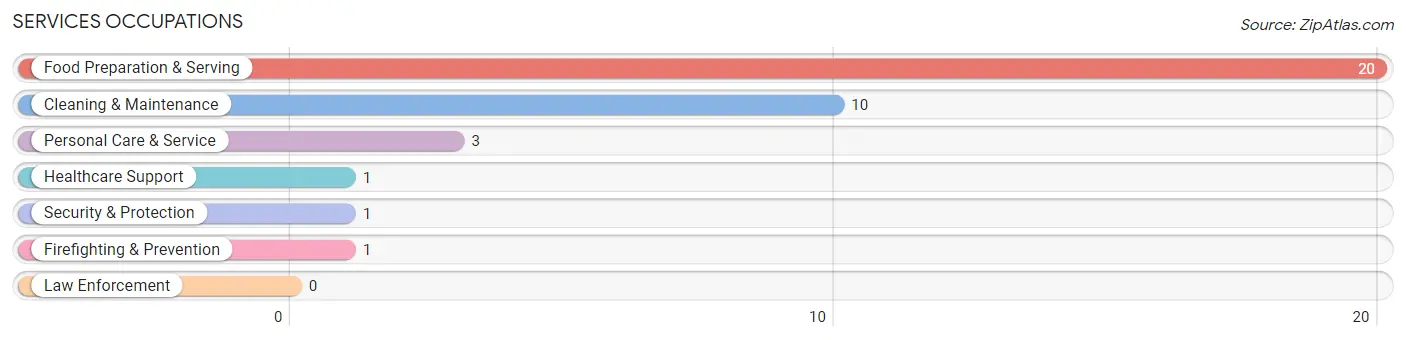
Services Occupations
The most common Services occupations in Lenox are Food Preparation & Serving (20 | 4.7%), Cleaning & Maintenance (10 | 2.4%), Personal Care & Service (3 | 0.7%), Healthcare Support (1 | 0.2%), and Security & Protection (1 | 0.2%).
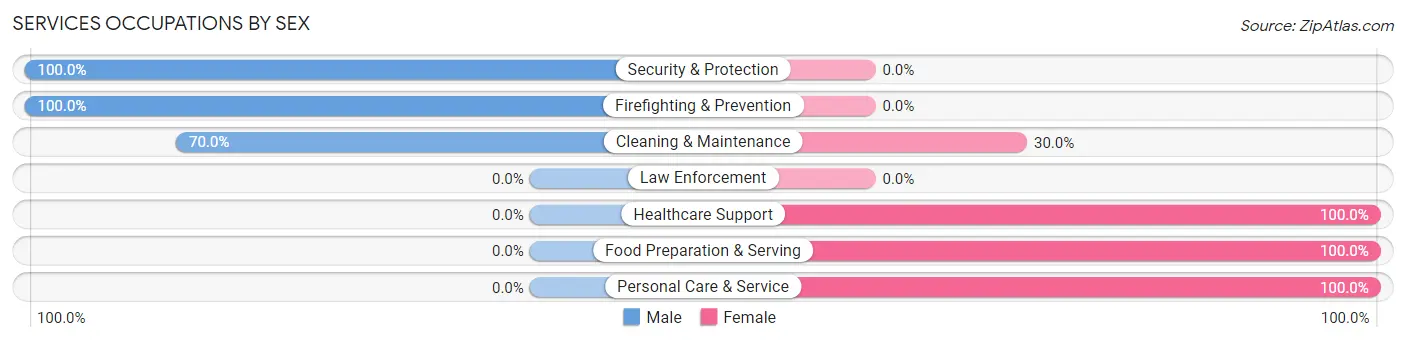
Services Occupations by Sex
Within the Services occupations in Lenox, the most male-oriented occupations are Security & Protection (100.0%), Firefighting & Prevention (100.0%), and Cleaning & Maintenance (70.0%), while the most female-oriented occupations are Healthcare Support (100.0%), Food Preparation & Serving (100.0%), and Personal Care & Service (100.0%).
| Occupation | Male | Female |
| Healthcare Support | 0 (0.0%) | 1 (100.0%) |
| Security & Protection | 1 (100.0%) | 0 (0.0%) |
| Firefighting & Prevention | 1 (100.0%) | 0 (0.0%) |
| Law Enforcement | 0 (0.0%) | 0 (0.0%) |
| Food Preparation & Serving | 0 (0.0%) | 20 (100.0%) |
| Cleaning & Maintenance | 7 (70.0%) | 3 (30.0%) |
| Personal Care & Service | 0 (0.0%) | 3 (100.0%) |
| Total (Category) | 8 (22.9%) | 27 (77.1%) |
| Total (Overall) | 261 (61.6%) | 163 (38.4%) |
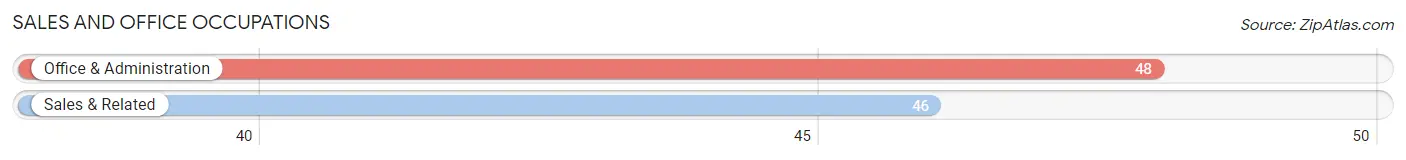
Sales and Office Occupations
The most common Sales and Office occupations in Lenox are Office & Administration (48 | 11.3%), and Sales & Related (46 | 10.8%).
Sales and Office Occupations by Sex
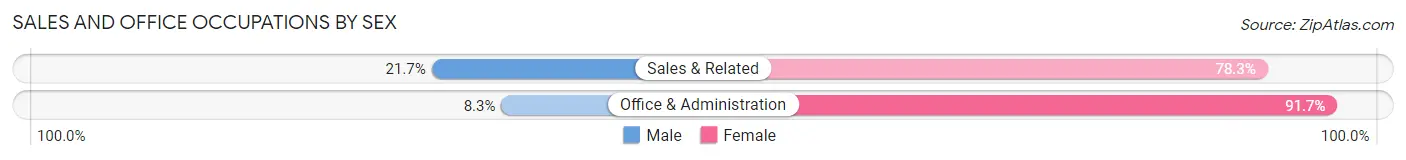
| Occupation | Male | Female |
| Sales & Related | 10 (21.7%) | 36 (78.3%) |
| Office & Administration | 4 (8.3%) | 44 (91.7%) |
| Total (Category) | 14 (14.9%) | 80 (85.1%) |
| Total (Overall) | 261 (61.6%) | 163 (38.4%) |
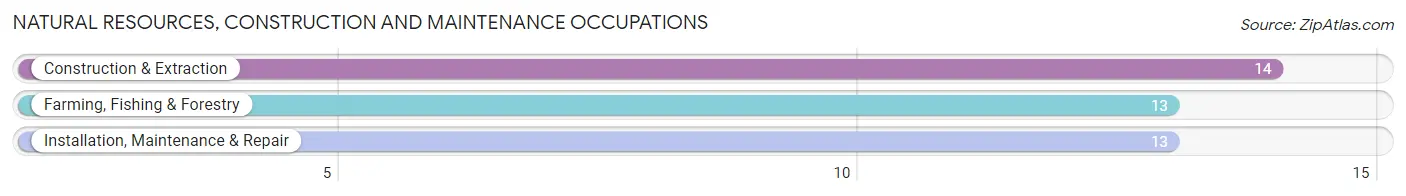
Natural Resources, Construction and Maintenance Occupations
The most common Natural Resources, Construction and Maintenance occupations in Lenox are Construction & Extraction (14 | 3.3%), Farming, Fishing & Forestry (13 | 3.1%), and Installation, Maintenance & Repair (13 | 3.1%).
Natural Resources, Construction and Maintenance Occupations by Sex
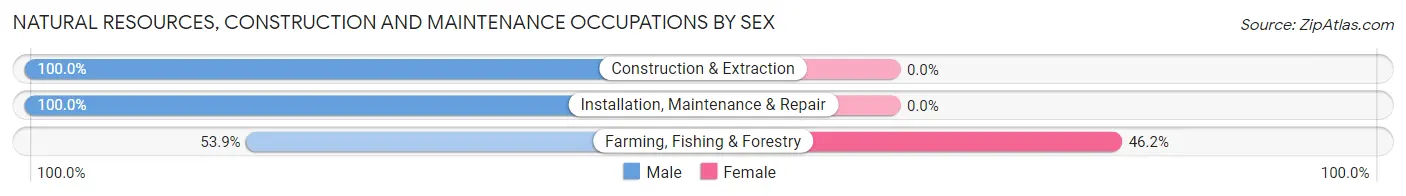
| Occupation | Male | Female |
| Farming, Fishing & Forestry | 7 (53.8%) | 6 (46.2%) |
| Construction & Extraction | 14 (100.0%) | 0 (0.0%) |
| Installation, Maintenance & Repair | 13 (100.0%) | 0 (0.0%) |
| Total (Category) | 34 (85.0%) | 6 (15.0%) |
| Total (Overall) | 261 (61.6%) | 163 (38.4%) |
Production, Transportation and Moving Occupations
The most common Production, Transportation and Moving occupations in Lenox are Production (141 | 33.3%), Transportation (32 | 7.5%), and Material Moving (28 | 6.6%).
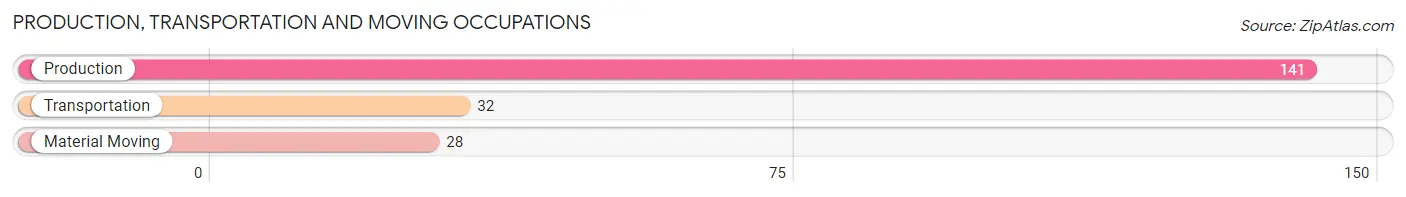
Production, Transportation and Moving Occupations by Sex
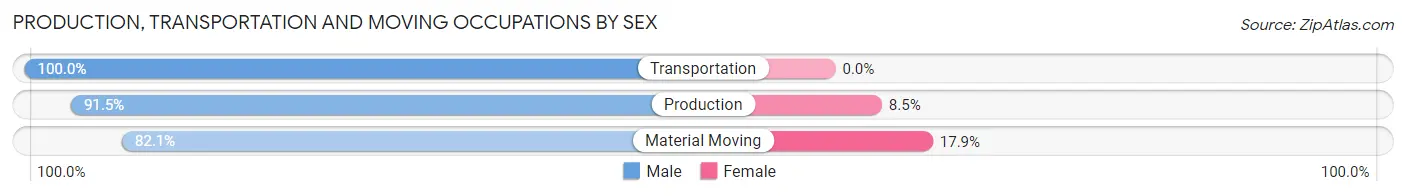
| Occupation | Male | Female |
| Production | 129 (91.5%) | 12 (8.5%) |
| Transportation | 32 (100.0%) | 0 (0.0%) |
| Material Moving | 23 (82.1%) | 5 (17.9%) |
| Total (Category) | 184 (91.5%) | 17 (8.5%) |
| Total (Overall) | 261 (61.6%) | 163 (38.4%) |
Employment Industries by Sex in Lenox
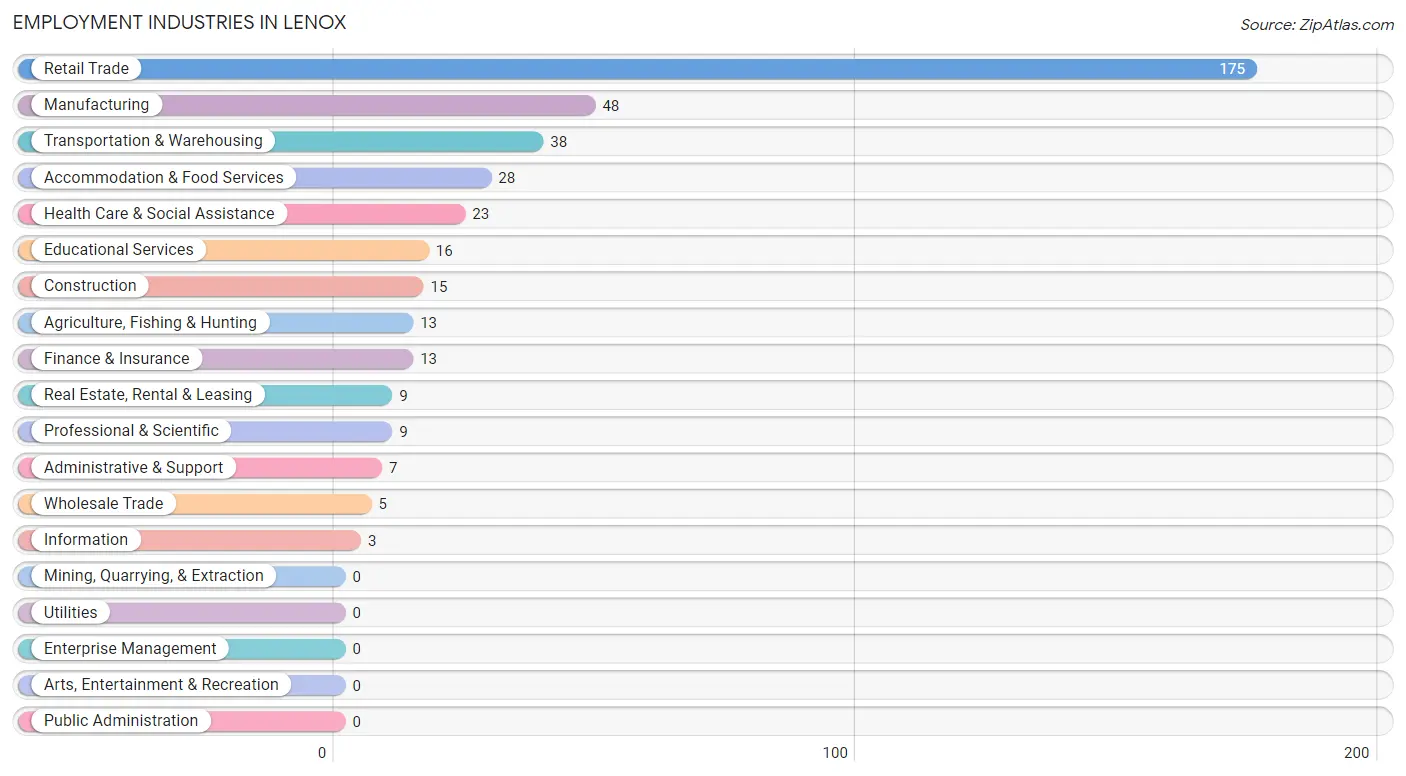
Employment Industries in Lenox
The major employment industries in Lenox include Retail Trade (175 | 41.3%), Manufacturing (48 | 11.3%), Transportation & Warehousing (38 | 9.0%), Accommodation & Food Services (28 | 6.6%), and Health Care & Social Assistance (23 | 5.4%).
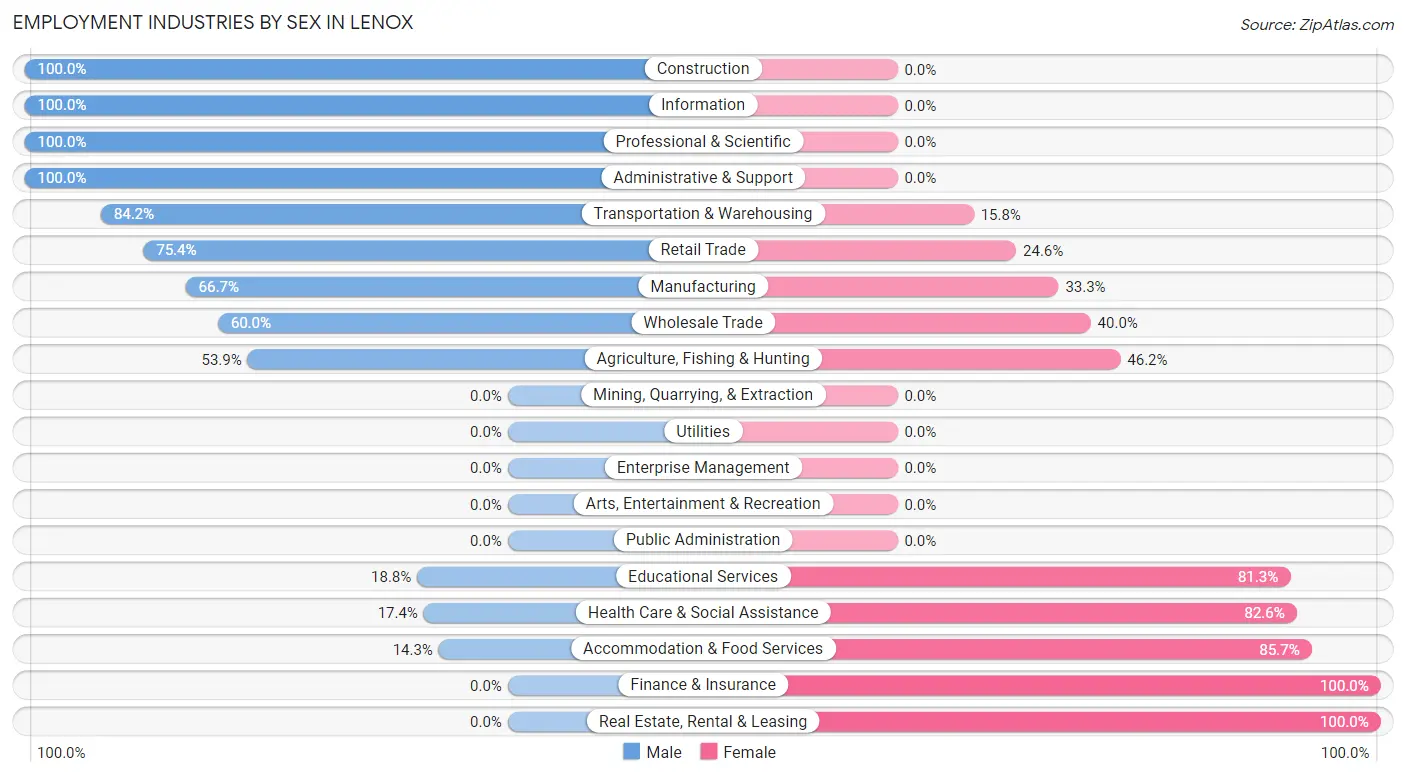
Employment Industries by Sex in Lenox
The Lenox industries that see more men than women are Construction (100.0%), Information (100.0%), and Professional & Scientific (100.0%), whereas the industries that tend to have a higher number of women are Finance & Insurance (100.0%), Real Estate, Rental & Leasing (100.0%), and Accommodation & Food Services (85.7%).
| Industry | Male | Female |
| Agriculture, Fishing & Hunting | 7 (53.8%) | 6 (46.2%) |
| Mining, Quarrying, & Extraction | 0 (0.0%) | 0 (0.0%) |
| Construction | 15 (100.0%) | 0 (0.0%) |
| Manufacturing | 32 (66.7%) | 16 (33.3%) |
| Wholesale Trade | 3 (60.0%) | 2 (40.0%) |
| Retail Trade | 132 (75.4%) | 43 (24.6%) |
| Transportation & Warehousing | 32 (84.2%) | 6 (15.8%) |
| Utilities | 0 (0.0%) | 0 (0.0%) |
| Information | 3 (100.0%) | 0 (0.0%) |
| Finance & Insurance | 0 (0.0%) | 13 (100.0%) |
| Real Estate, Rental & Leasing | 0 (0.0%) | 9 (100.0%) |
| Professional & Scientific | 9 (100.0%) | 0 (0.0%) |
| Enterprise Management | 0 (0.0%) | 0 (0.0%) |
| Administrative & Support | 7 (100.0%) | 0 (0.0%) |
| Educational Services | 3 (18.8%) | 13 (81.2%) |
| Health Care & Social Assistance | 4 (17.4%) | 19 (82.6%) |
| Arts, Entertainment & Recreation | 0 (0.0%) | 0 (0.0%) |
| Accommodation & Food Services | 4 (14.3%) | 24 (85.7%) |
| Public Administration | 0 (0.0%) | 0 (0.0%) |
| Total | 261 (61.6%) | 163 (38.4%) |
Education in Lenox
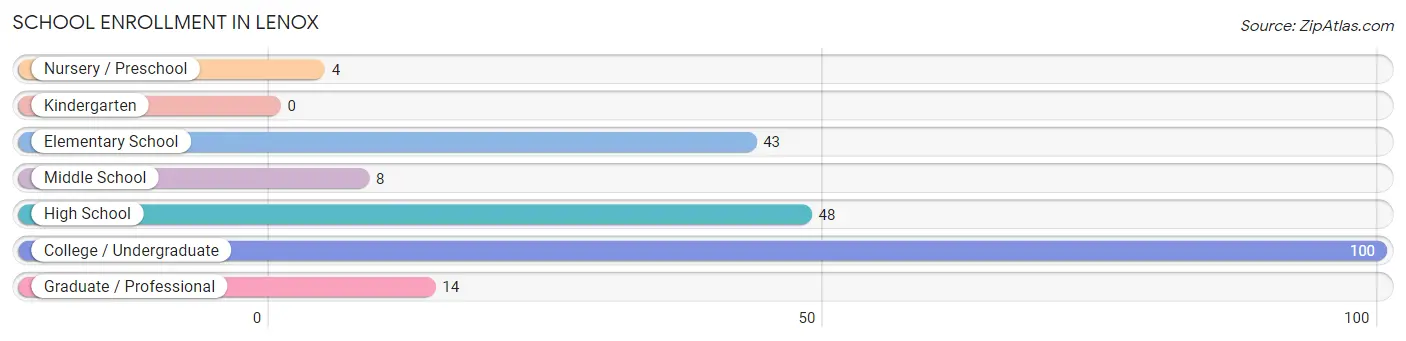
School Enrollment in Lenox
The most common levels of schooling among the 217 students in Lenox are college / undergraduate (100 | 46.1%), high school (48 | 22.1%), and elementary school (43 | 19.8%).
| School Level | # Students | % Students |
| Nursery / Preschool | 4 | 1.8% |
| Kindergarten | 0 | 0.0% |
| Elementary School | 43 | 19.8% |
| Middle School | 8 | 3.7% |
| High School | 48 | 22.1% |
| College / Undergraduate | 100 | 46.1% |
| Graduate / Professional | 14 | 6.5% |
| Total | 217 | 100.0% |
School Enrollment by Age by Funding Source in Lenox
Out of a total of 217 students who are enrolled in schools in Lenox, 16 (7.4%) attend a private institution, while the remaining 201 (92.6%) are enrolled in public schools. The age group of 3 to 4 year olds has the highest likelihood of being enrolled in private schools, with 4 (100.0% in the age bracket) enrolled. Conversely, the age group of 5 to 9 year old has the lowest likelihood of being enrolled in a private school, with 32 (100.0% in the age bracket) attending a public institution.
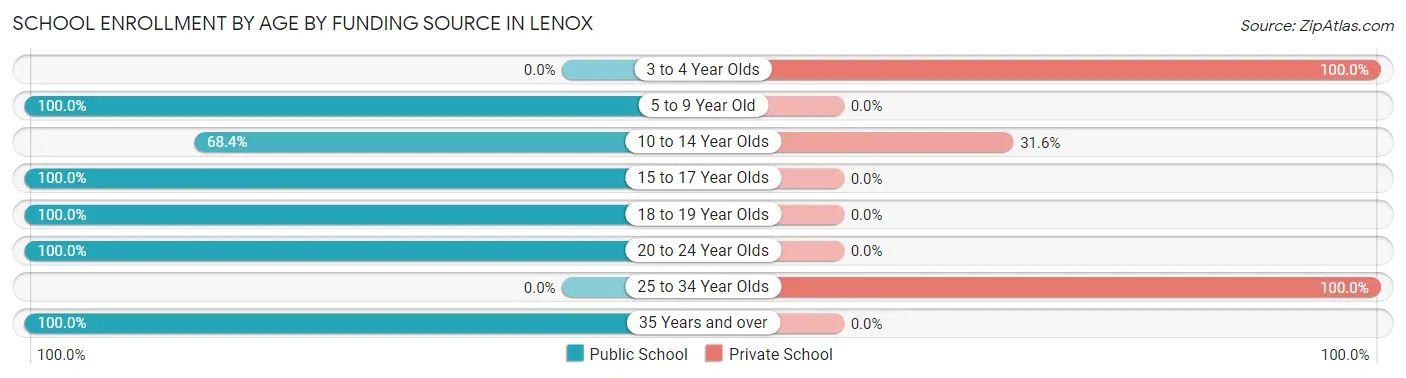
| Age Bracket | Public School | Private School |
| 3 to 4 Year Olds | 0 (0.0%) | 4 (100.0%) |
| 5 to 9 Year Old | 32 (100.0%) | 0 (0.0%) |
| 10 to 14 Year Olds | 13 (68.4%) | 6 (31.6%) |
| 15 to 17 Year Olds | 23 (100.0%) | 0 (0.0%) |
| 18 to 19 Year Olds | 15 (100.0%) | 0 (0.0%) |
| 20 to 24 Year Olds | 104 (100.0%) | 0 (0.0%) |
| 25 to 34 Year Olds | 0 (0.0%) | 6 (100.0%) |
| 35 Years and over | 14 (100.0%) | 0 (0.0%) |
| Total | 201 (92.6%) | 16 (7.4%) |
Educational Attainment by Field of Study in Lenox
Computers & mathematics (8 | 26.7%), business (7 | 23.3%), liberal arts & history (7 | 23.3%), education (5 | 16.7%), and arts & humanities (3 | 10.0%) are the most common fields of study among 30 individuals in Lenox who have obtained a bachelor's degree or higher.
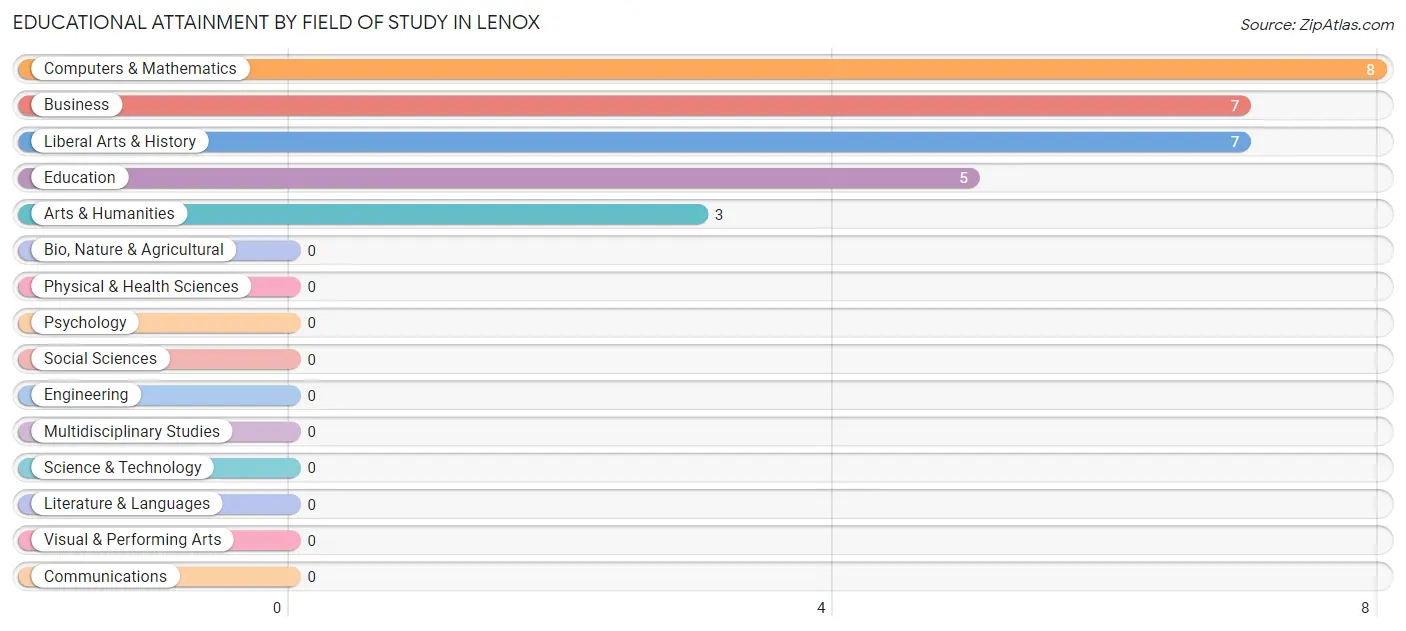
| Field of Study | # Graduates | % Graduates |
| Computers & Mathematics | 8 | 26.7% |
| Bio, Nature & Agricultural | 0 | 0.0% |
| Physical & Health Sciences | 0 | 0.0% |
| Psychology | 0 | 0.0% |
| Social Sciences | 0 | 0.0% |
| Engineering | 0 | 0.0% |
| Multidisciplinary Studies | 0 | 0.0% |
| Science & Technology | 0 | 0.0% |
| Business | 7 | 23.3% |
| Education | 5 | 16.7% |
| Literature & Languages | 0 | 0.0% |
| Liberal Arts & History | 7 | 23.3% |
| Visual & Performing Arts | 0 | 0.0% |
| Communications | 0 | 0.0% |
| Arts & Humanities | 3 | 10.0% |
| Total | 30 | 100.0% |
Transportation & Commute in Lenox
Vehicle Availability by Sex in Lenox
The most prevalent vehicle ownership categories in Lenox are males with 2 vehicles (187, accounting for 75.7%) and females with 2 vehicles (98, making up 114.7%).
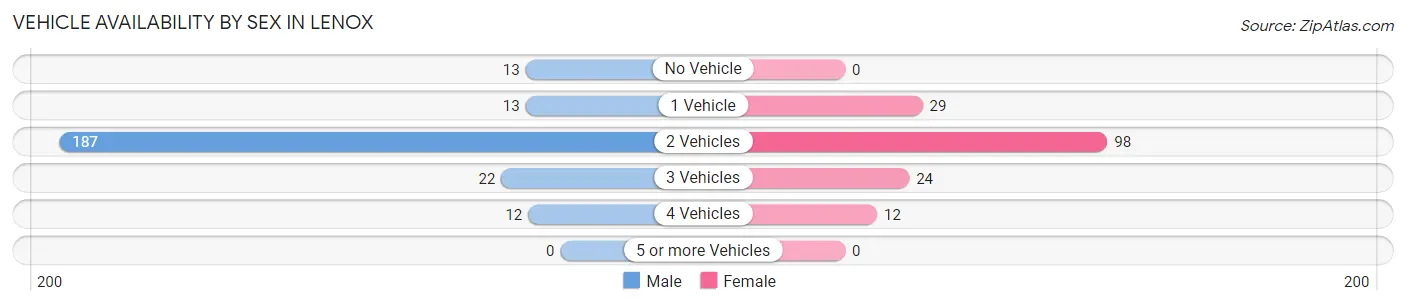
| Vehicles Available | Male | Female |
| No Vehicle | 13 (5.3%) | 0 (0.0%) |
| 1 Vehicle | 13 (5.3%) | 29 (17.8%) |
| 2 Vehicles | 187 (75.7%) | 98 (60.1%) |
| 3 Vehicles | 22 (8.9%) | 24 (14.7%) |
| 4 Vehicles | 12 (4.9%) | 12 (7.4%) |
| 5 or more Vehicles | 0 (0.0%) | 0 (0.0%) |
| Total | 247 (100.0%) | 163 (100.0%) |
Commute Time in Lenox
The most frequently occuring commute durations in Lenox are 45 to 59 minutes (111 commuters, 27.3%), 15 to 19 minutes (86 commuters, 21.1%), and 20 to 24 minutes (50 commuters, 12.3%).
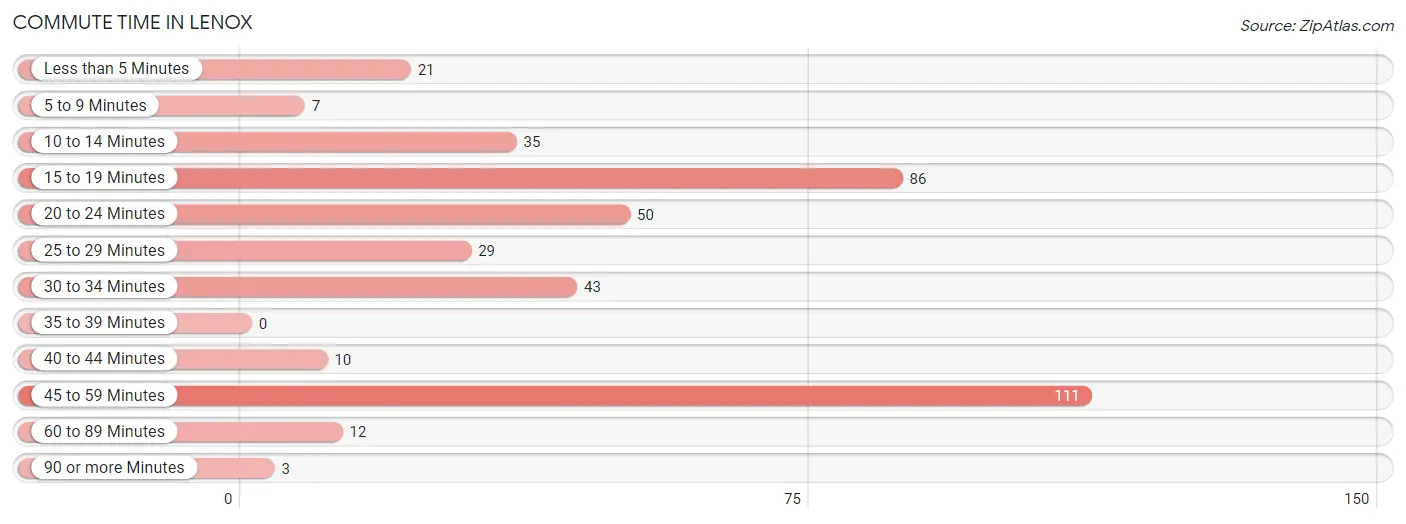
| Commute Time | # Commuters | % Commuters |
| Less than 5 Minutes | 21 | 5.2% |
| 5 to 9 Minutes | 7 | 1.7% |
| 10 to 14 Minutes | 35 | 8.6% |
| 15 to 19 Minutes | 86 | 21.1% |
| 20 to 24 Minutes | 50 | 12.3% |
| 25 to 29 Minutes | 29 | 7.1% |
| 30 to 34 Minutes | 43 | 10.6% |
| 35 to 39 Minutes | 0 | 0.0% |
| 40 to 44 Minutes | 10 | 2.5% |
| 45 to 59 Minutes | 111 | 27.3% |
| 60 to 89 Minutes | 12 | 2.9% |
| 90 or more Minutes | 3 | 0.7% |
Commute Time by Sex in Lenox
The most common commute times in Lenox are 45 to 59 minutes (106 commuters, 42.9%) for males and 30 to 34 minutes (37 commuters, 23.1%) for females.
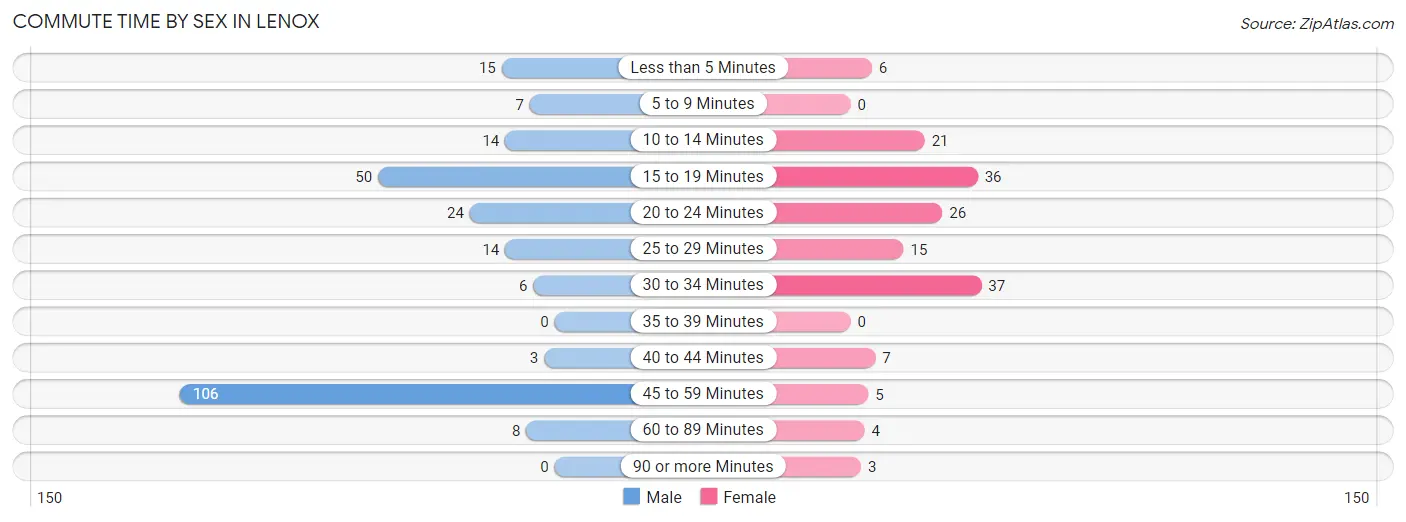
| Commute Time | Male | Female |
| Less than 5 Minutes | 15 (6.1%) | 6 (3.7%) |
| 5 to 9 Minutes | 7 (2.8%) | 0 (0.0%) |
| 10 to 14 Minutes | 14 (5.7%) | 21 (13.1%) |
| 15 to 19 Minutes | 50 (20.2%) | 36 (22.5%) |
| 20 to 24 Minutes | 24 (9.7%) | 26 (16.3%) |
| 25 to 29 Minutes | 14 (5.7%) | 15 (9.4%) |
| 30 to 34 Minutes | 6 (2.4%) | 37 (23.1%) |
| 35 to 39 Minutes | 0 (0.0%) | 0 (0.0%) |
| 40 to 44 Minutes | 3 (1.2%) | 7 (4.4%) |
| 45 to 59 Minutes | 106 (42.9%) | 5 (3.1%) |
| 60 to 89 Minutes | 8 (3.2%) | 4 (2.5%) |
| 90 or more Minutes | 0 (0.0%) | 3 (1.9%) |
Time of Departure to Work by Sex in Lenox
The most frequent times of departure to work in Lenox are 4:00 PM to 11:59 PM (117, 47.4%) for males and 7:30 AM to 7:59 AM (42, 26.3%) for females.
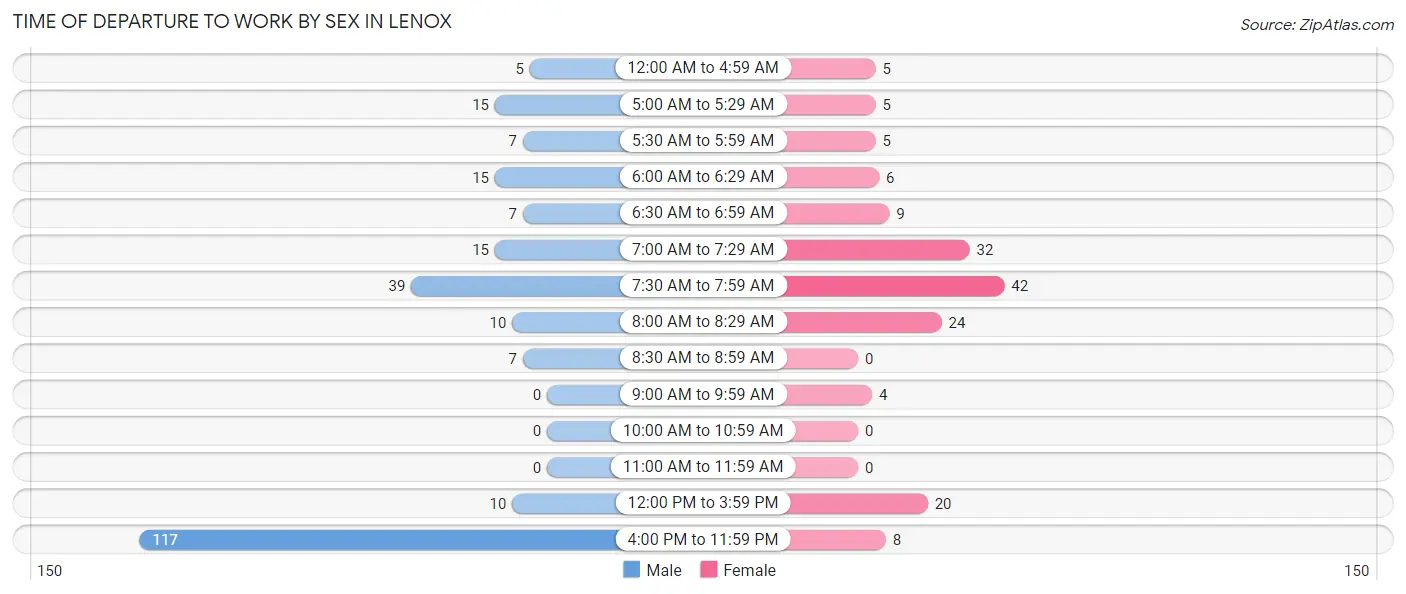
| Time of Departure | Male | Female |
| 12:00 AM to 4:59 AM | 5 (2.0%) | 5 (3.1%) |
| 5:00 AM to 5:29 AM | 15 (6.1%) | 5 (3.1%) |
| 5:30 AM to 5:59 AM | 7 (2.8%) | 5 (3.1%) |
| 6:00 AM to 6:29 AM | 15 (6.1%) | 6 (3.7%) |
| 6:30 AM to 6:59 AM | 7 (2.8%) | 9 (5.6%) |
| 7:00 AM to 7:29 AM | 15 (6.1%) | 32 (20.0%) |
| 7:30 AM to 7:59 AM | 39 (15.8%) | 42 (26.3%) |
| 8:00 AM to 8:29 AM | 10 (4.1%) | 24 (15.0%) |
| 8:30 AM to 8:59 AM | 7 (2.8%) | 0 (0.0%) |
| 9:00 AM to 9:59 AM | 0 (0.0%) | 4 (2.5%) |
| 10:00 AM to 10:59 AM | 0 (0.0%) | 0 (0.0%) |
| 11:00 AM to 11:59 AM | 0 (0.0%) | 0 (0.0%) |
| 12:00 PM to 3:59 PM | 10 (4.1%) | 20 (12.5%) |
| 4:00 PM to 11:59 PM | 117 (47.4%) | 8 (5.0%) |
| Total | 247 (100.0%) | 160 (100.0%) |
Housing Occupancy in Lenox
Occupancy by Ownership in Lenox
Of the total 348 dwellings in Lenox, owner-occupied units account for 209 (60.1%), while renter-occupied units make up 139 (39.9%).
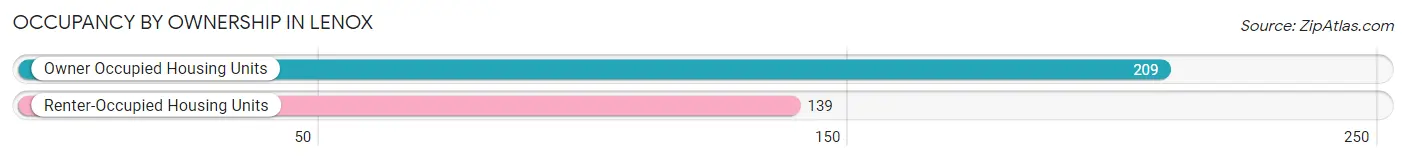
| Occupancy | # Housing Units | % Housing Units |
| Owner Occupied Housing Units | 209 | 60.1% |
| Renter-Occupied Housing Units | 139 | 39.9% |
| Total Occupied Housing Units | 348 | 100.0% |
Occupancy by Household Size in Lenox
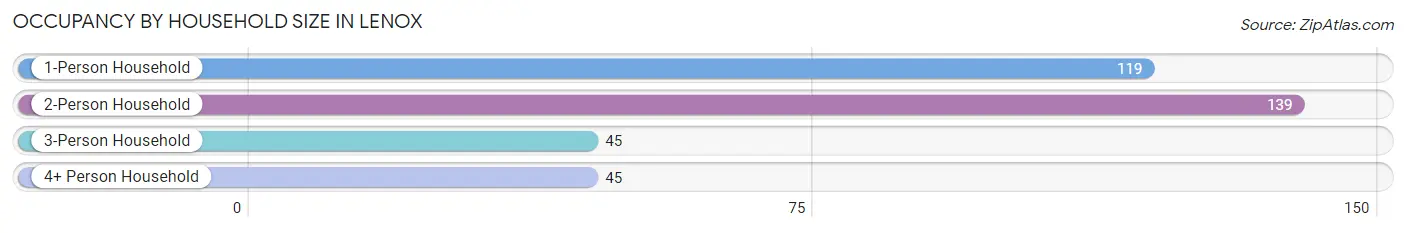
| Household Size | # Housing Units | % Housing Units |
| 1-Person Household | 119 | 34.2% |
| 2-Person Household | 139 | 39.9% |
| 3-Person Household | 45 | 12.9% |
| 4+ Person Household | 45 | 12.9% |
| Total Housing Units | 348 | 100.0% |
Occupancy by Ownership by Household Size in Lenox
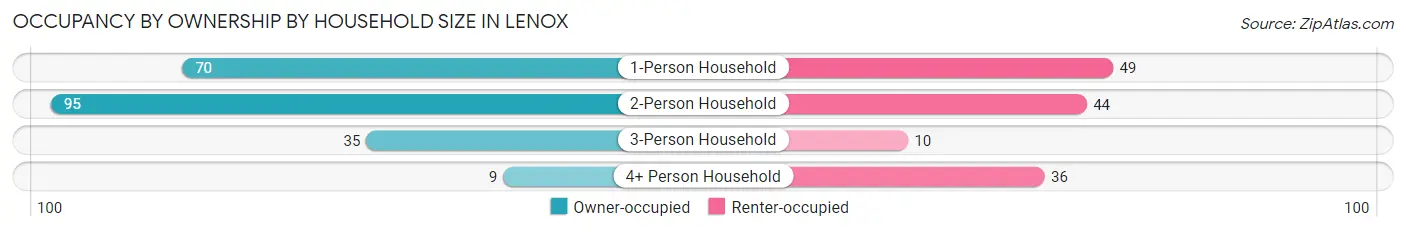
| Household Size | Owner-occupied | Renter-occupied |
| 1-Person Household | 70 (58.8%) | 49 (41.2%) |
| 2-Person Household | 95 (68.3%) | 44 (31.7%) |
| 3-Person Household | 35 (77.8%) | 10 (22.2%) |
| 4+ Person Household | 9 (20.0%) | 36 (80.0%) |
| Total Housing Units | 209 (60.1%) | 139 (39.9%) |
Occupancy by Educational Attainment in Lenox
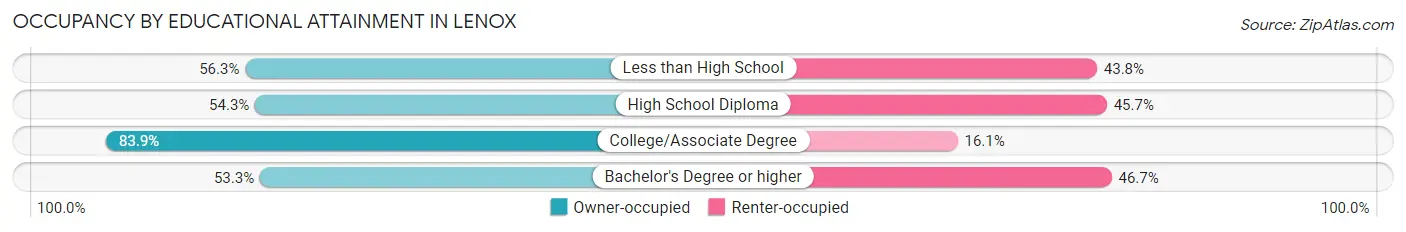
| Household Size | Owner-occupied | Renter-occupied |
| Less than High School | 54 (56.2%) | 42 (43.8%) |
| High School Diploma | 95 (54.3%) | 80 (45.7%) |
| College/Associate Degree | 52 (83.9%) | 10 (16.1%) |
| Bachelor's Degree or higher | 8 (53.3%) | 7 (46.7%) |
Occupancy by Age of Householder in Lenox
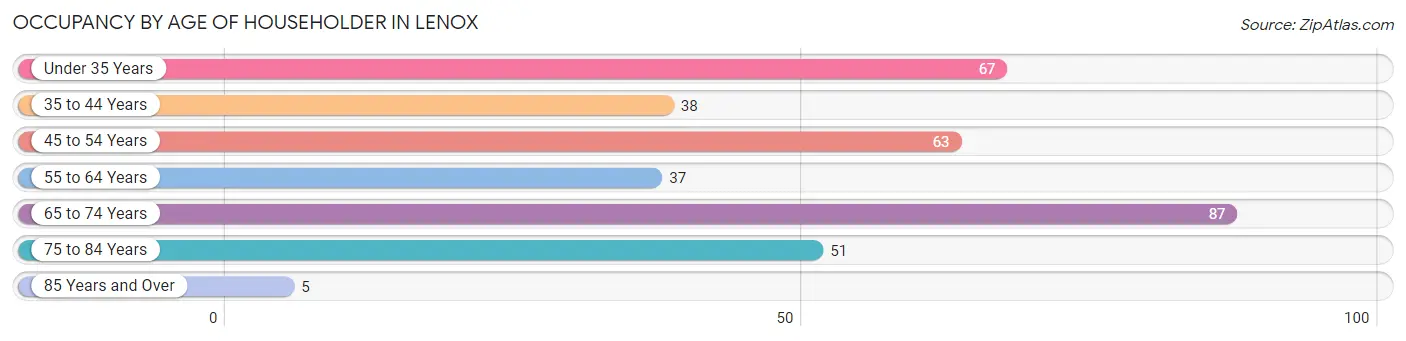
| Age Bracket | # Households | % Households |
| Under 35 Years | 67 | 19.3% |
| 35 to 44 Years | 38 | 10.9% |
| 45 to 54 Years | 63 | 18.1% |
| 55 to 64 Years | 37 | 10.6% |
| 65 to 74 Years | 87 | 25.0% |
| 75 to 84 Years | 51 | 14.7% |
| 85 Years and Over | 5 | 1.4% |
| Total | 348 | 100.0% |
Housing Finances in Lenox
Median Income by Occupancy in Lenox
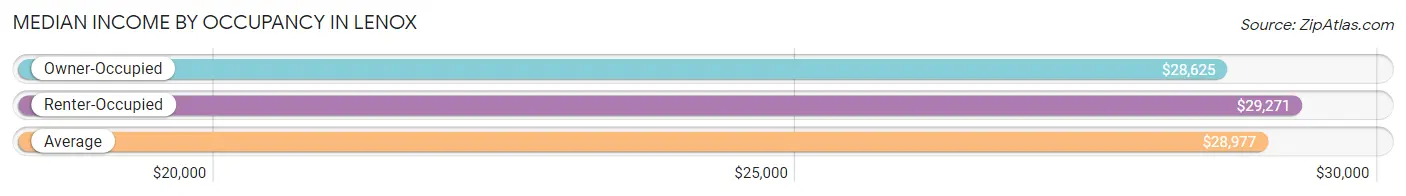
| Occupancy Type | # Households | Median Income |
| Owner-Occupied | 209 (60.1%) | $28,625 |
| Renter-Occupied | 139 (39.9%) | $29,271 |
| Average | 348 (100.0%) | $28,977 |
Occupancy by Householder Income Bracket in Lenox
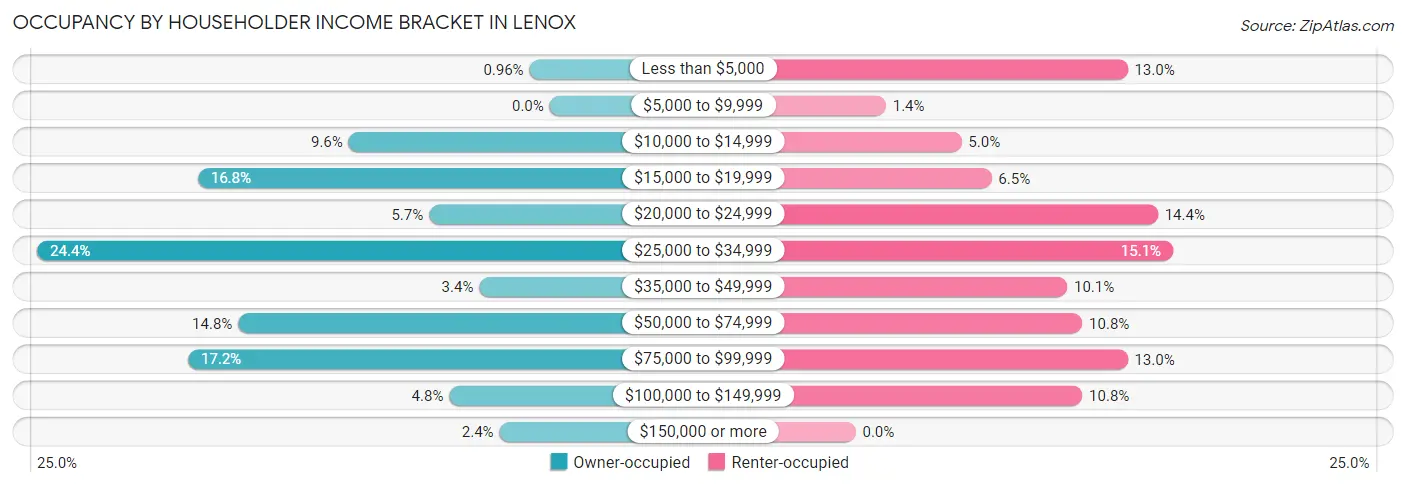
| Income Bracket | Owner-occupied | Renter-occupied |
| Less than $5,000 | 2 (1.0%) | 18 (13.0%) |
| $5,000 to $9,999 | 0 (0.0%) | 2 (1.4%) |
| $10,000 to $14,999 | 20 (9.6%) | 7 (5.0%) |
| $15,000 to $19,999 | 35 (16.8%) | 9 (6.5%) |
| $20,000 to $24,999 | 12 (5.7%) | 20 (14.4%) |
| $25,000 to $34,999 | 51 (24.4%) | 21 (15.1%) |
| $35,000 to $49,999 | 7 (3.4%) | 14 (10.1%) |
| $50,000 to $74,999 | 31 (14.8%) | 15 (10.8%) |
| $75,000 to $99,999 | 36 (17.2%) | 18 (13.0%) |
| $100,000 to $149,999 | 10 (4.8%) | 15 (10.8%) |
| $150,000 or more | 5 (2.4%) | 0 (0.0%) |
| Total | 209 (100.0%) | 139 (100.0%) |
Monthly Housing Cost Tiers in Lenox
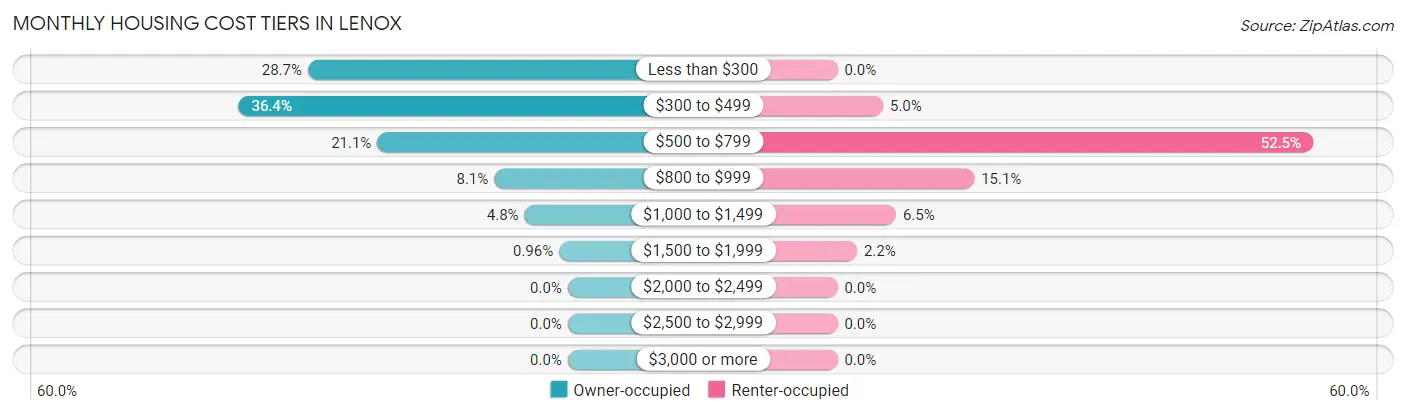
| Monthly Cost | Owner-occupied | Renter-occupied |
| Less than $300 | 60 (28.7%) | 0 (0.0%) |
| $300 to $499 | 76 (36.4%) | 7 (5.0%) |
| $500 to $799 | 44 (21.0%) | 73 (52.5%) |
| $800 to $999 | 17 (8.1%) | 21 (15.1%) |
| $1,000 to $1,499 | 10 (4.8%) | 9 (6.5%) |
| $1,500 to $1,999 | 2 (1.0%) | 3 (2.2%) |
| $2,000 to $2,499 | 0 (0.0%) | 0 (0.0%) |
| $2,500 to $2,999 | 0 (0.0%) | 0 (0.0%) |
| $3,000 or more | 0 (0.0%) | 0 (0.0%) |
| Total | 209 (100.0%) | 139 (100.0%) |
Physical Housing Characteristics in Lenox
Housing Structures in Lenox
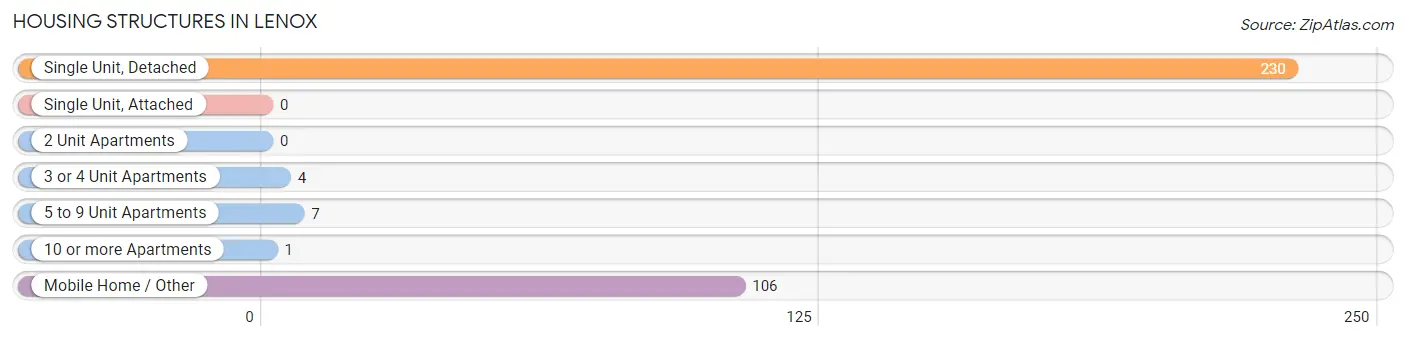
| Structure Type | # Housing Units | % Housing Units |
| Single Unit, Detached | 230 | 66.1% |
| Single Unit, Attached | 0 | 0.0% |
| 2 Unit Apartments | 0 | 0.0% |
| 3 or 4 Unit Apartments | 4 | 1.1% |
| 5 to 9 Unit Apartments | 7 | 2.0% |
| 10 or more Apartments | 1 | 0.3% |
| Mobile Home / Other | 106 | 30.5% |
| Total | 348 | 100.0% |
Housing Structures by Occupancy in Lenox
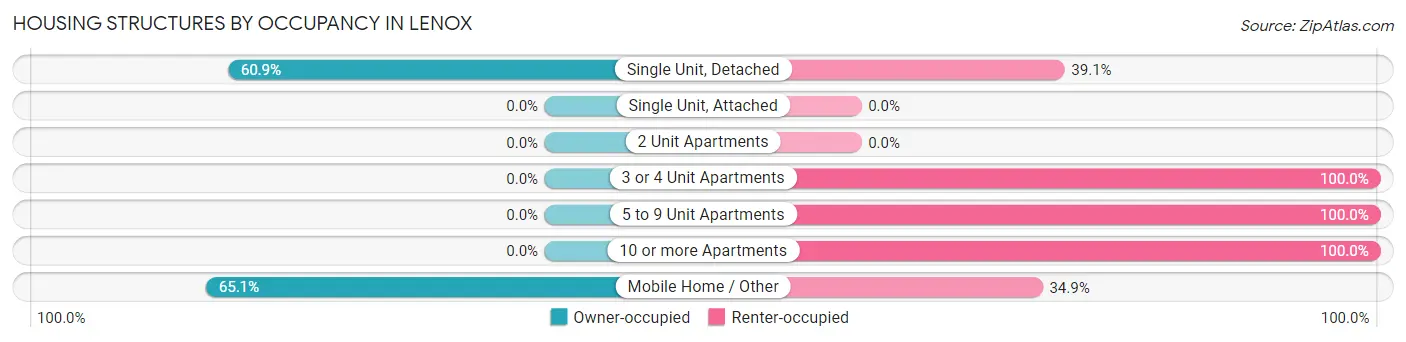
| Structure Type | Owner-occupied | Renter-occupied |
| Single Unit, Detached | 140 (60.9%) | 90 (39.1%) |
| Single Unit, Attached | 0 (0.0%) | 0 (0.0%) |
| 2 Unit Apartments | 0 (0.0%) | 0 (0.0%) |
| 3 or 4 Unit Apartments | 0 (0.0%) | 4 (100.0%) |
| 5 to 9 Unit Apartments | 0 (0.0%) | 7 (100.0%) |
| 10 or more Apartments | 0 (0.0%) | 1 (100.0%) |
| Mobile Home / Other | 69 (65.1%) | 37 (34.9%) |
| Total | 209 (60.1%) | 139 (39.9%) |
Housing Structures by Number of Rooms in Lenox
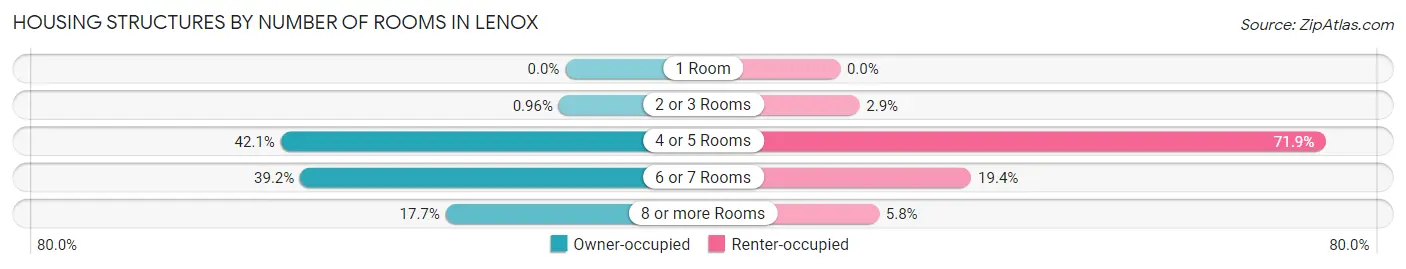
| Number of Rooms | Owner-occupied | Renter-occupied |
| 1 Room | 0 (0.0%) | 0 (0.0%) |
| 2 or 3 Rooms | 2 (1.0%) | 4 (2.9%) |
| 4 or 5 Rooms | 88 (42.1%) | 100 (71.9%) |
| 6 or 7 Rooms | 82 (39.2%) | 27 (19.4%) |
| 8 or more Rooms | 37 (17.7%) | 8 (5.8%) |
| Total | 209 (100.0%) | 139 (100.0%) |
Housing Structure by Heating Type in Lenox
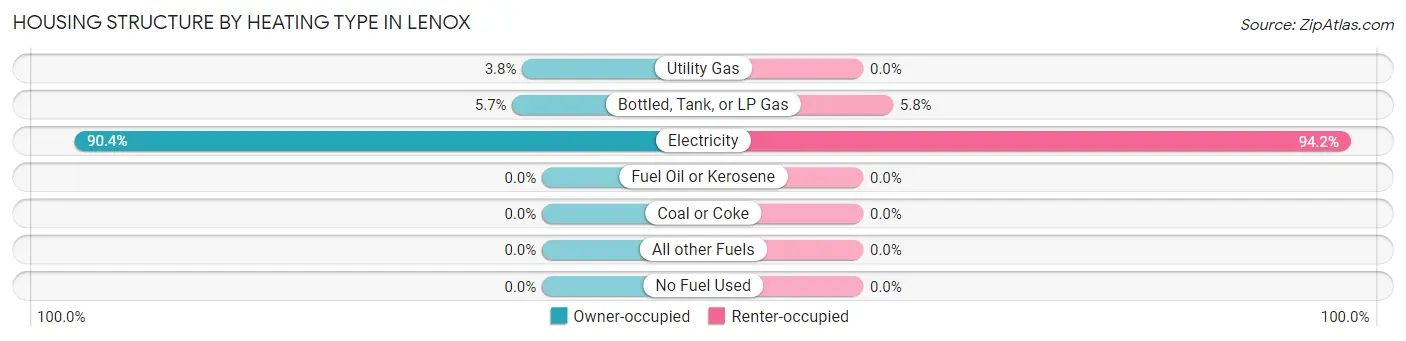
| Heating Type | Owner-occupied | Renter-occupied |
| Utility Gas | 8 (3.8%) | 0 (0.0%) |
| Bottled, Tank, or LP Gas | 12 (5.7%) | 8 (5.8%) |
| Electricity | 189 (90.4%) | 131 (94.2%) |
| Fuel Oil or Kerosene | 0 (0.0%) | 0 (0.0%) |
| Coal or Coke | 0 (0.0%) | 0 (0.0%) |
| All other Fuels | 0 (0.0%) | 0 (0.0%) |
| No Fuel Used | 0 (0.0%) | 0 (0.0%) |
| Total | 209 (100.0%) | 139 (100.0%) |
Household Vehicle Usage in Lenox
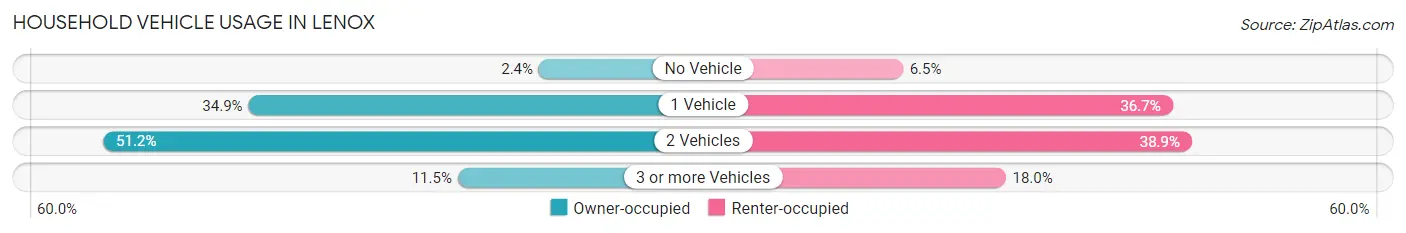
| Vehicles per Household | Owner-occupied | Renter-occupied |
| No Vehicle | 5 (2.4%) | 9 (6.5%) |
| 1 Vehicle | 73 (34.9%) | 51 (36.7%) |
| 2 Vehicles | 107 (51.2%) | 54 (38.9%) |
| 3 or more Vehicles | 24 (11.5%) | 25 (18.0%) |
| Total | 209 (100.0%) | 139 (100.0%) |
Real Estate & Mortgages in Lenox
Real Estate and Mortgage Overview in Lenox
| Characteristic | Without Mortgage | With Mortgage |
| Housing Units | 173 | 36 |
| Median Property Value | $72,800 | $87,100 |
| Median Household Income | $26,976 | $3 |
| Monthly Housing Costs | $347 | $0 |
| Real Estate Taxes | $473 | $0 |
Property Value by Mortgage Status in Lenox
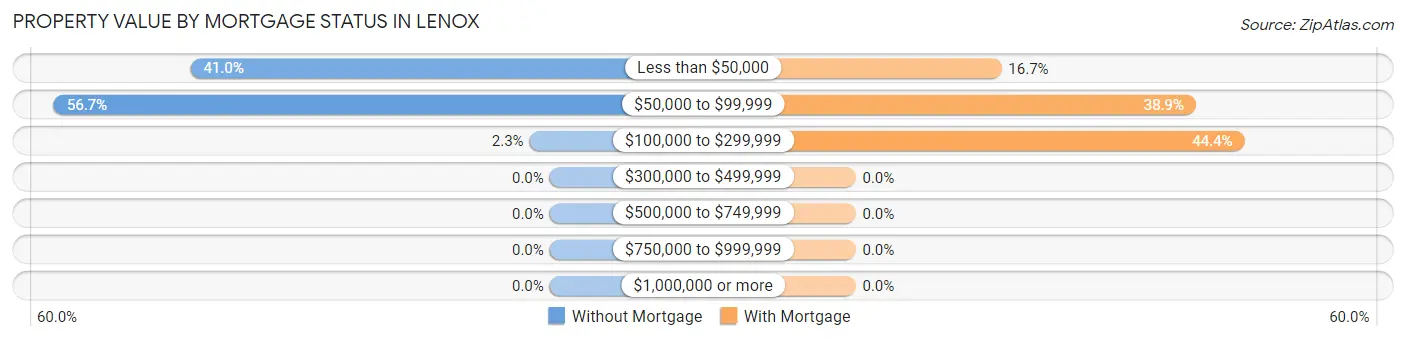
| Property Value | Without Mortgage | With Mortgage |
| Less than $50,000 | 71 (41.0%) | 6 (16.7%) |
| $50,000 to $99,999 | 98 (56.7%) | 14 (38.9%) |
| $100,000 to $299,999 | 4 (2.3%) | 16 (44.4%) |
| $300,000 to $499,999 | 0 (0.0%) | 0 (0.0%) |
| $500,000 to $749,999 | 0 (0.0%) | 0 (0.0%) |
| $750,000 to $999,999 | 0 (0.0%) | 0 (0.0%) |
| $1,000,000 or more | 0 (0.0%) | 0 (0.0%) |
| Total | 173 (100.0%) | 36 (100.0%) |
Household Income by Mortgage Status in Lenox
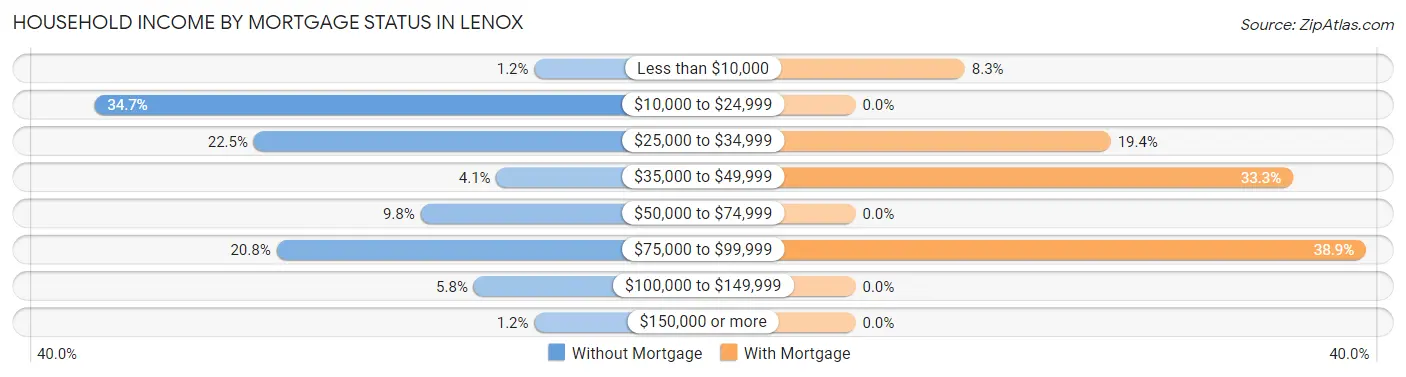
| Household Income | Without Mortgage | With Mortgage |
| Less than $10,000 | 2 (1.2%) | 3 (8.3%) |
| $10,000 to $24,999 | 60 (34.7%) | 0 (0.0%) |
| $25,000 to $34,999 | 39 (22.5%) | 7 (19.4%) |
| $35,000 to $49,999 | 7 (4.1%) | 12 (33.3%) |
| $50,000 to $74,999 | 17 (9.8%) | 0 (0.0%) |
| $75,000 to $99,999 | 36 (20.8%) | 14 (38.9%) |
| $100,000 to $149,999 | 10 (5.8%) | 0 (0.0%) |
| $150,000 or more | 2 (1.2%) | 0 (0.0%) |
| Total | 173 (100.0%) | 36 (100.0%) |
Property Value to Household Income Ratio in Lenox
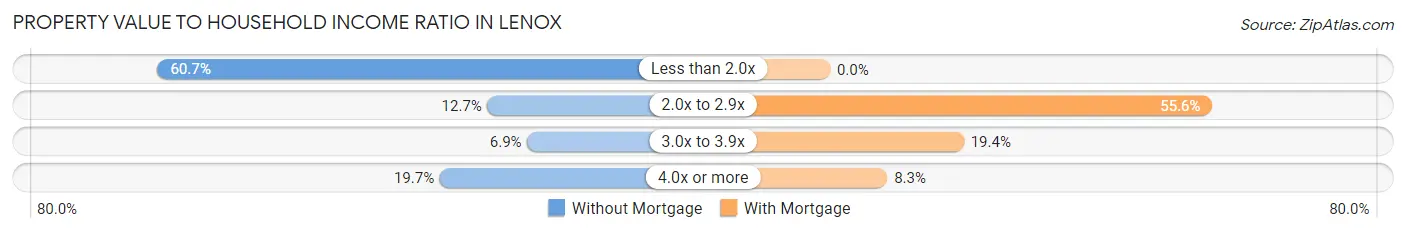
| Value-to-Income Ratio | Without Mortgage | With Mortgage |
| Less than 2.0x | 105 (60.7%) | 0 (0.0%) |
| 2.0x to 2.9x | 22 (12.7%) | 20 (55.6%) |
| 3.0x to 3.9x | 12 (6.9%) | 7 (19.4%) |
| 4.0x or more | 34 (19.7%) | 3 (8.3%) |
| Total | 173 (100.0%) | 36 (100.0%) |
Real Estate Taxes by Mortgage Status in Lenox
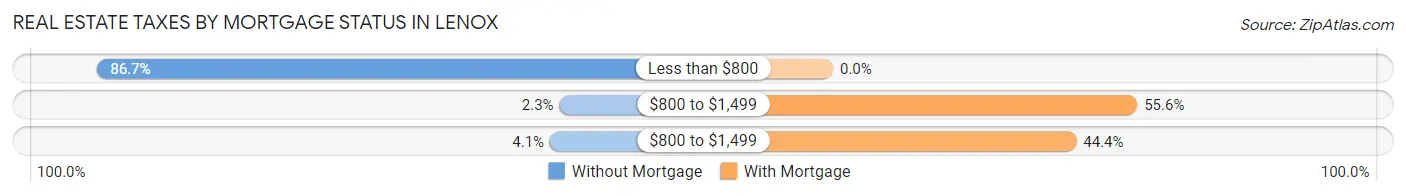
| Property Taxes | Without Mortgage | With Mortgage |
| Less than $800 | 150 (86.7%) | 0 (0.0%) |
| $800 to $1,499 | 4 (2.3%) | 20 (55.6%) |
| $800 to $1,499 | 7 (4.1%) | 16 (44.4%) |
| Total | 173 (100.0%) | 36 (100.0%) |
Health & Disability in Lenox
Health Insurance Coverage by Age in Lenox
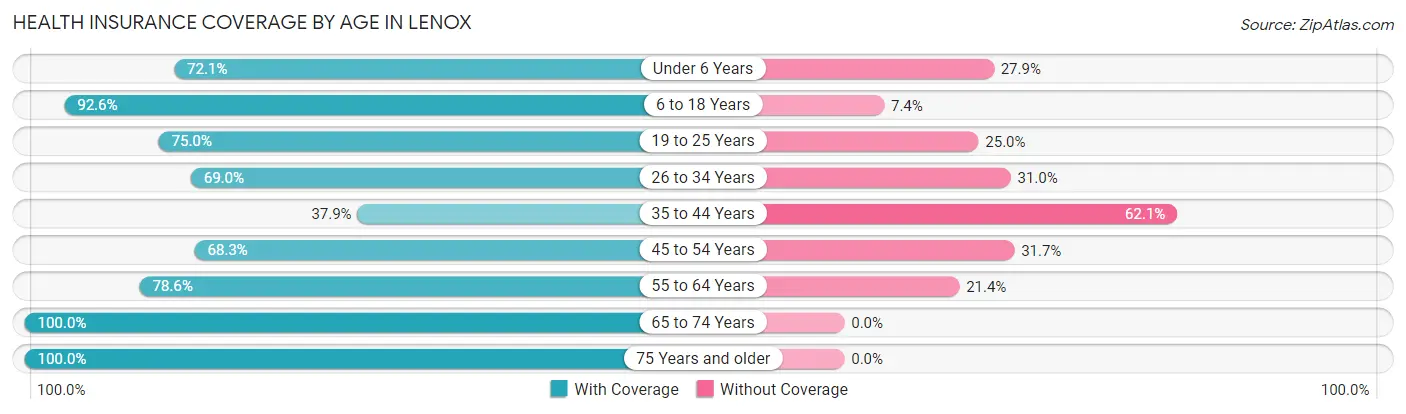
| Age Bracket | With Coverage | Without Coverage |
| Under 6 Years | 44 (72.1%) | 17 (27.9%) |
| 6 to 18 Years | 75 (92.6%) | 6 (7.4%) |
| 19 to 25 Years | 168 (75.0%) | 56 (25.0%) |
| 26 to 34 Years | 69 (69.0%) | 31 (31.0%) |
| 35 to 44 Years | 22 (37.9%) | 36 (62.1%) |
| 45 to 54 Years | 69 (68.3%) | 32 (31.7%) |
| 55 to 64 Years | 55 (78.6%) | 15 (21.4%) |
| 65 to 74 Years | 123 (100.0%) | 0 (0.0%) |
| 75 Years and older | 69 (100.0%) | 0 (0.0%) |
| Total | 694 (78.2%) | 193 (21.8%) |
Health Insurance Coverage by Citizenship Status in Lenox
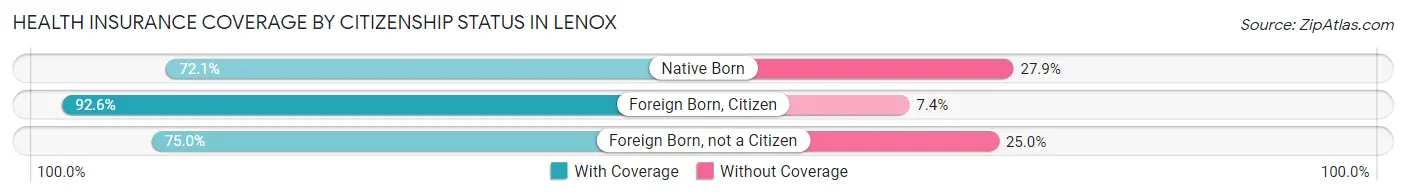
| Citizenship Status | With Coverage | Without Coverage |
| Native Born | 44 (72.1%) | 17 (27.9%) |
| Foreign Born, Citizen | 75 (92.6%) | 6 (7.4%) |
| Foreign Born, not a Citizen | 168 (75.0%) | 56 (25.0%) |
Health Insurance Coverage by Household Income in Lenox
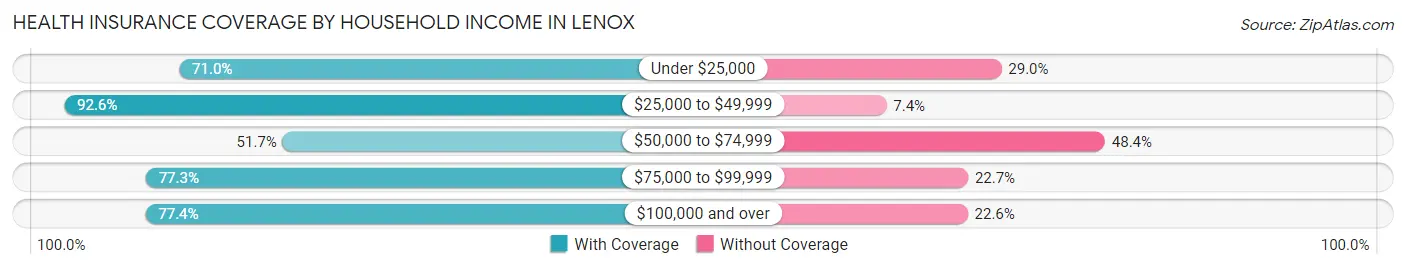
| Household Income | With Coverage | Without Coverage |
| Under $25,000 | 157 (71.0%) | 64 (29.0%) |
| $25,000 to $49,999 | 275 (92.6%) | 22 (7.4%) |
| $50,000 to $74,999 | 47 (51.6%) | 44 (48.3%) |
| $75,000 to $99,999 | 109 (77.3%) | 32 (22.7%) |
| $100,000 and over | 106 (77.4%) | 31 (22.6%) |
Public vs Private Health Insurance Coverage by Age in Lenox
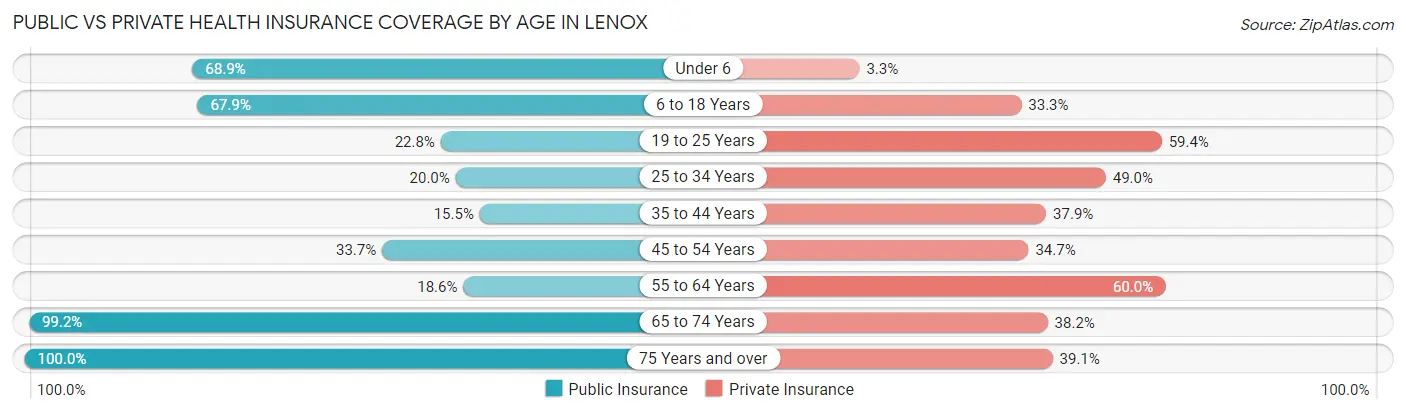
| Age Bracket | Public Insurance | Private Insurance |
| Under 6 | 42 (68.9%) | 2 (3.3%) |
| 6 to 18 Years | 55 (67.9%) | 27 (33.3%) |
| 19 to 25 Years | 51 (22.8%) | 133 (59.4%) |
| 25 to 34 Years | 20 (20.0%) | 49 (49.0%) |
| 35 to 44 Years | 9 (15.5%) | 22 (37.9%) |
| 45 to 54 Years | 34 (33.7%) | 35 (34.6%) |
| 55 to 64 Years | 13 (18.6%) | 42 (60.0%) |
| 65 to 74 Years | 122 (99.2%) | 47 (38.2%) |
| 75 Years and over | 69 (100.0%) | 27 (39.1%) |
| Total | 415 (46.8%) | 384 (43.3%) |
Disability Status by Sex by Age in Lenox
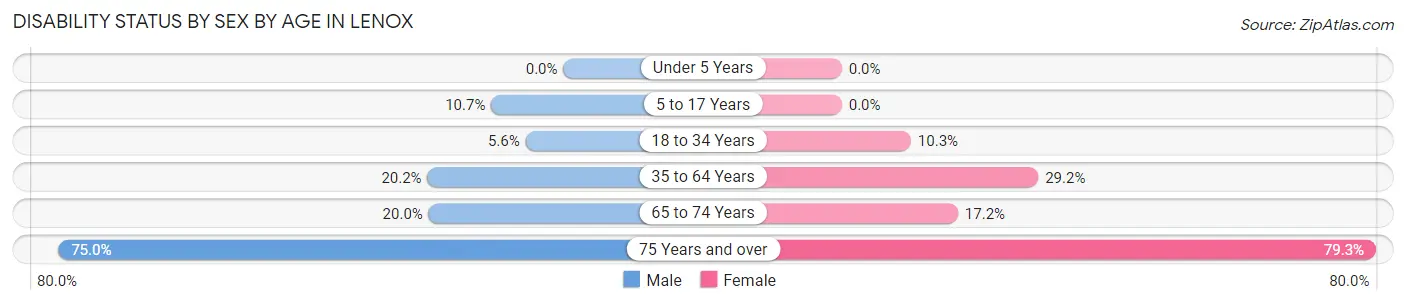
| Age Bracket | Male | Female |
| Under 5 Years | 0 (0.0%) | 0 (0.0%) |
| 5 to 17 Years | 3 (10.7%) | 0 (0.0%) |
| 18 to 34 Years | 12 (5.6%) | 12 (10.3%) |
| 35 to 64 Years | 22 (20.2%) | 35 (29.2%) |
| 65 to 74 Years | 13 (20.0%) | 10 (17.2%) |
| 75 Years and over | 30 (75.0%) | 23 (79.3%) |
Disability Class by Sex by Age in Lenox
Disability Class: Hearing Difficulty
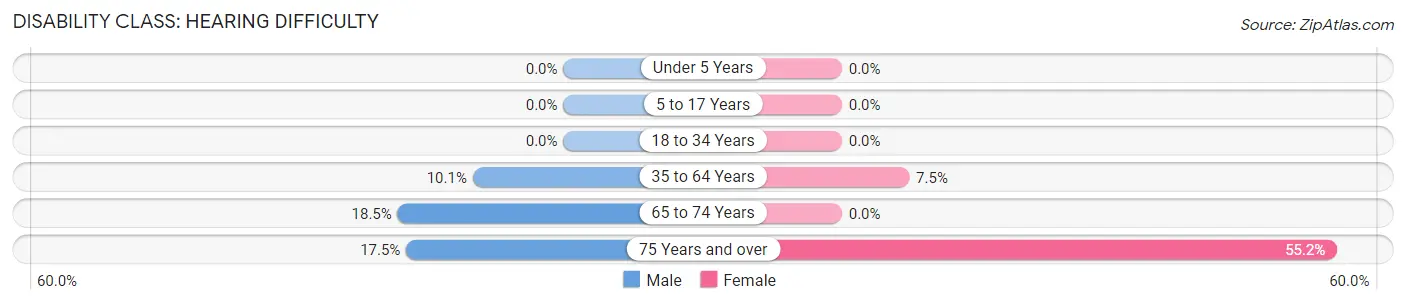
| Age Bracket | Male | Female |
| Under 5 Years | 0 (0.0%) | 0 (0.0%) |
| 5 to 17 Years | 0 (0.0%) | 0 (0.0%) |
| 18 to 34 Years | 0 (0.0%) | 0 (0.0%) |
| 35 to 64 Years | 11 (10.1%) | 9 (7.5%) |
| 65 to 74 Years | 12 (18.5%) | 0 (0.0%) |
| 75 Years and over | 7 (17.5%) | 16 (55.2%) |
Disability Class: Vision Difficulty
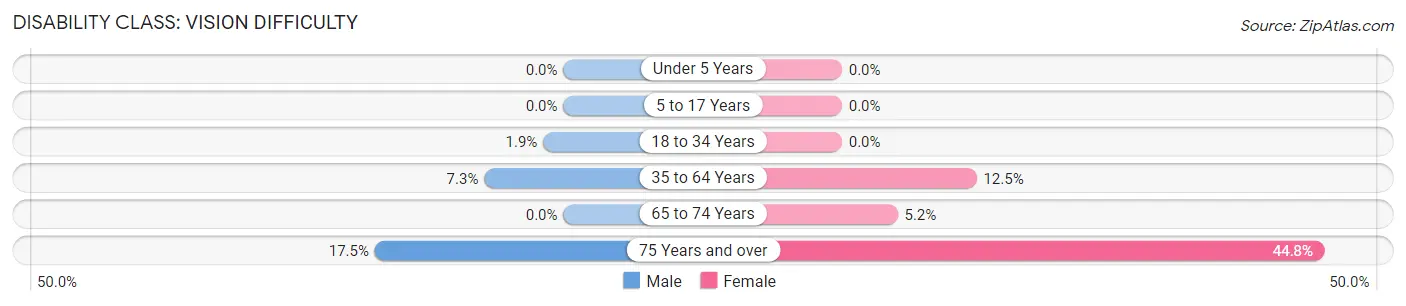
| Age Bracket | Male | Female |
| Under 5 Years | 0 (0.0%) | 0 (0.0%) |
| 5 to 17 Years | 0 (0.0%) | 0 (0.0%) |
| 18 to 34 Years | 4 (1.9%) | 0 (0.0%) |
| 35 to 64 Years | 8 (7.3%) | 15 (12.5%) |
| 65 to 74 Years | 0 (0.0%) | 3 (5.2%) |
| 75 Years and over | 7 (17.5%) | 13 (44.8%) |
Disability Class: Cognitive Difficulty
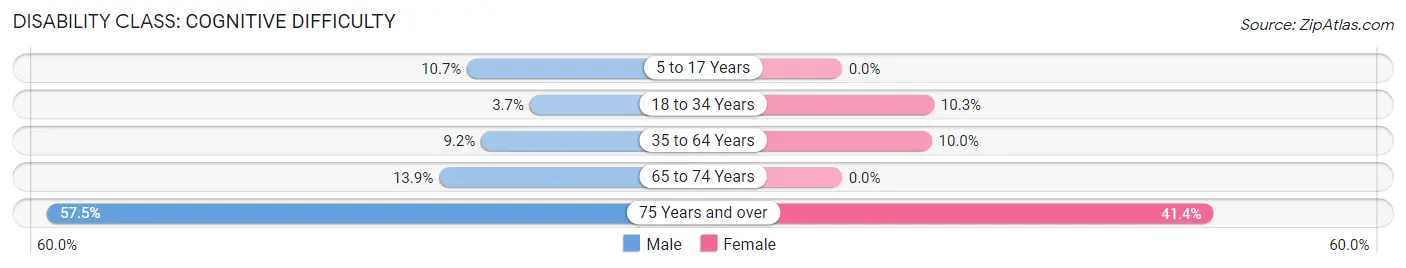
| Age Bracket | Male | Female |
| 5 to 17 Years | 3 (10.7%) | 0 (0.0%) |
| 18 to 34 Years | 8 (3.7%) | 12 (10.3%) |
| 35 to 64 Years | 10 (9.2%) | 12 (10.0%) |
| 65 to 74 Years | 9 (13.9%) | 0 (0.0%) |
| 75 Years and over | 23 (57.5%) | 12 (41.4%) |
Disability Class: Ambulatory Difficulty
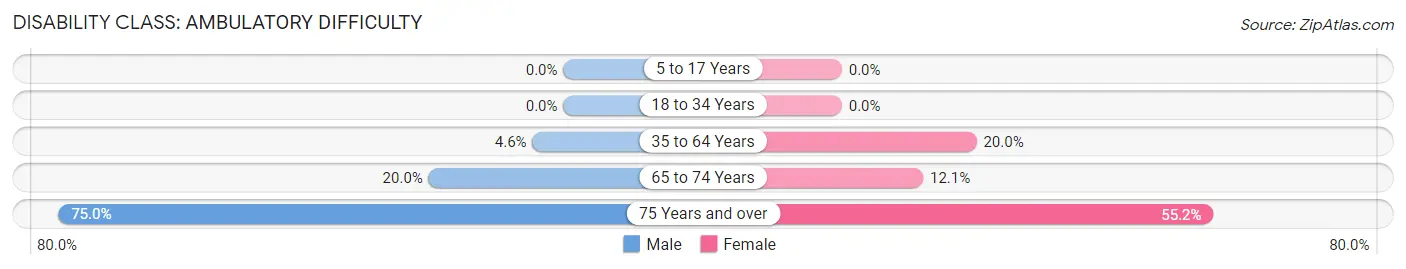
| Age Bracket | Male | Female |
| 5 to 17 Years | 0 (0.0%) | 0 (0.0%) |
| 18 to 34 Years | 0 (0.0%) | 0 (0.0%) |
| 35 to 64 Years | 5 (4.6%) | 24 (20.0%) |
| 65 to 74 Years | 13 (20.0%) | 7 (12.1%) |
| 75 Years and over | 30 (75.0%) | 16 (55.2%) |
Disability Class: Self-Care Difficulty
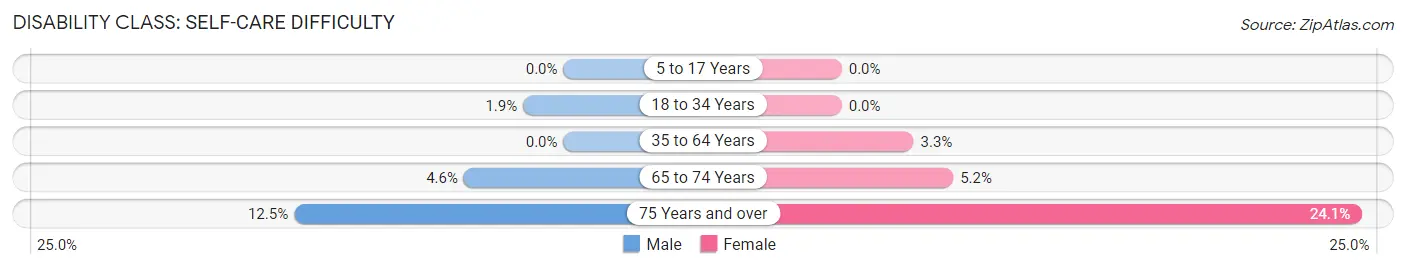
| Age Bracket | Male | Female |
| 5 to 17 Years | 0 (0.0%) | 0 (0.0%) |
| 18 to 34 Years | 4 (1.9%) | 0 (0.0%) |
| 35 to 64 Years | 0 (0.0%) | 4 (3.3%) |
| 65 to 74 Years | 3 (4.6%) | 3 (5.2%) |
| 75 Years and over | 5 (12.5%) | 7 (24.1%) |
Technology Access in Lenox
Computing Device Access in Lenox
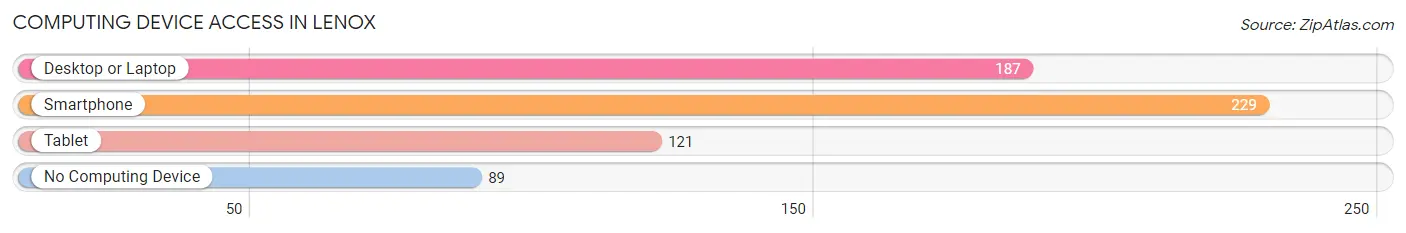
| Device Type | # Households | % Households |
| Desktop or Laptop | 187 | 53.7% |
| Smartphone | 229 | 65.8% |
| Tablet | 121 | 34.8% |
| No Computing Device | 89 | 25.6% |
| Total | 348 | 100.0% |
Internet Access in Lenox
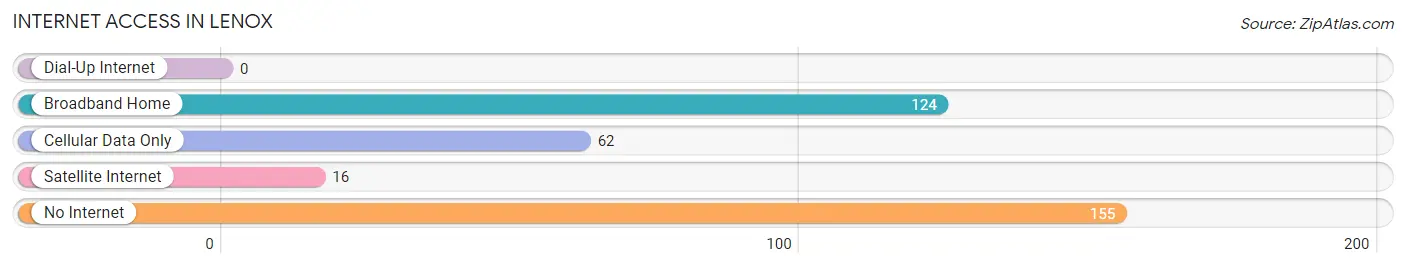
| Internet Type | # Households | % Households |
| Dial-Up Internet | 0 | 0.0% |
| Broadband Home | 124 | 35.6% |
| Cellular Data Only | 62 | 17.8% |
| Satellite Internet | 16 | 4.6% |
| No Internet | 155 | 44.5% |
| Total | 348 | 100.0% |
Lenox Summary
Lenox, Georgia is a small city located in the southeastern United States, in the state of Georgia. It is situated in the county of Wilcox, and is part of the larger Macon metropolitan area. The city has a population of approximately 1,500 people, and is located about 50 miles south of Macon.
History
Lenox was founded in 1820 by a group of settlers from North Carolina. The town was named after the Lenox family, who were among the first settlers. The town was originally a farming community, and the main crops grown were cotton and corn. In the late 19th century, the town began to grow and develop, and by the early 20th century, it had become a thriving commercial center.
In the early 20th century, Lenox was a popular destination for tourists, and the town was known for its many resorts and hotels. The town also had a thriving music scene, and was home to several popular jazz clubs. In the 1950s, the town began to decline, and many of the businesses and resorts closed. In the late 20th century, the town began to experience a resurgence, and today it is a popular destination for tourists and locals alike.
Geography
Lenox is located in the southeastern United States, in the state of Georgia. It is situated in the county of Wilcox, and is part of the larger Macon metropolitan area. The city has a total area of 1.2 square miles, all of which is land. The city is located about 50 miles south of Macon, and is bordered by the cities of Abbeville, Rochelle, and Rhine.
The terrain of Lenox is mostly flat, with some rolling hills. The city is located in the Piedmont region of Georgia, and is part of the Coastal Plain region. The climate of Lenox is humid subtropical, with hot, humid summers and mild winters.
Economy
The economy of Lenox is largely based on tourism and agriculture. The city is home to several tourist attractions, including the Lenox Historic District, which is listed on the National Register of Historic Places. The city is also home to several wineries, and is a popular destination for wine tasting.
Agriculture is also an important part of the economy of Lenox. The city is home to several farms, and the main crops grown are cotton, corn, soybeans, and peanuts. The city is also home to several manufacturing companies, including a furniture factory and a paper mill.
Demographics
As of the 2010 census, the population of Lenox was 1,500 people. The racial makeup of the city was 79.3% White, 17.3% African American, 0.7% Native American, 0.3% Asian, and 2.3% from other races. The median household income was $30,000, and the median family income was $35,000. The per capita income was $14,000.
Lenox is a small city with a diverse population. The city is home to a variety of cultures and religions, and is a popular destination for tourists and locals alike. The city is also home to several churches, and is a popular destination for religious events and services.
Common Questions
What is Per Capita Income in Lenox?
Per Capita income in Lenox is $20,232.
What is the Median Family Income in Lenox?
Median Family Income in Lenox is $41,250.
What is the Median Household income in Lenox?
Median Household Income in Lenox is $28,977.
What is Family Income Deficit in Lenox?
Family Income Deficit in Lenox is $5,838.
Families that are below poverty line in Lenox earn $5,838 less on average than the poverty threshold level.
What is Inequality or Gini Index in Lenox?
Inequality or Gini Index in Lenox is 0.42.
What is the Total Population of Lenox?
Total Population of Lenox is 887.
What is the Total Male Population of Lenox?
Total Male Population of Lenox is 502.
What is the Total Female Population of Lenox?
Total Female Population of Lenox is 385.
What is the Ratio of Males per 100 Females in Lenox?
There are 130.39 Males per 100 Females in Lenox.
What is the Ratio of Females per 100 Males in Lenox?
There are 76.69 Females per 100 Males in Lenox.
What is the Median Population Age in Lenox?
Median Population Age in Lenox is 32.3 Years.
What is the Average Family Size in Lenox
Average Family Size in Lenox is 3.4 People.
What is the Average Household Size in Lenox
Average Household Size in Lenox is 2.5 People.
How Large is the Labor Force in Lenox?
There are 453 People in the Labor Forcein in Lenox.
What is the Percentage of People in the Labor Force in Lenox?
58.5% of People are in the Labor Force in Lenox.
What is the Unemployment Rate in Lenox?
Unemployment Rate in Lenox is 6.4%.