Woodstock, GA Map & Demographics
Woodstock Map
Woodstock Overview
$47,009
PER CAPITA INCOME
$118,200
AVG FAMILY INCOME
$100,913
AVG HOUSEHOLD INCOME
35.7%
WAGE / INCOME GAP [ % ]
64.3¢/ $1
WAGE / INCOME GAP [ $ ]
$7,890
FAMILY INCOME DEFICIT
0.39
INEQUALITY / GINI INDEX
35,171
TOTAL POPULATION
16,489
MALE POPULATION
18,682
FEMALE POPULATION
88.26
MALES / 100 FEMALES
113.30
FEMALES / 100 MALES
36.4
MEDIAN AGE
3.2
AVG FAMILY SIZE
2.6
AVG HOUSEHOLD SIZE
20,710
LABOR FORCE [ PEOPLE ]
75.3%
PERCENT IN LABOR FORCE
2.8%
UNEMPLOYMENT RATE
Income in Woodstock
Income Overview in Woodstock
Per Capita Income in Woodstock is $47,009, while median incomes of families and households are $118,200 and $100,913 respectively.
| Characteristic | Number | Measure |
| Per Capita Income | 35,171 | $47,009 |
| Median Family Income | 8,950 | $118,200 |
| Mean Family Income | 8,950 | $138,191 |
| Median Household Income | 13,640 | $100,913 |
| Mean Household Income | 13,640 | $116,150 |
| Income Deficit | 8,950 | $7,890 |
| Wage / Income Gap (%) | 35,171 | 35.66% |
| Wage / Income Gap ($) | 35,171 | 64.34¢ per $1 |
| Gini / Inequality Index | 35,171 | 0.39 |
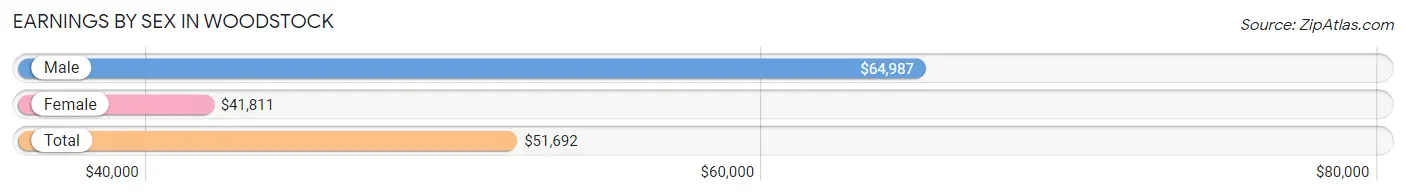
Earnings by Sex in Woodstock
Average Earnings in Woodstock are $51,692, $64,987 for men and $41,811 for women, a difference of 35.7%.
| Sex | Number | Average Earnings |
| Male | 10,319 (48.6%) | $64,987 |
| Female | 10,894 (51.4%) | $41,811 |
| Total | 21,213 (100.0%) | $51,692 |
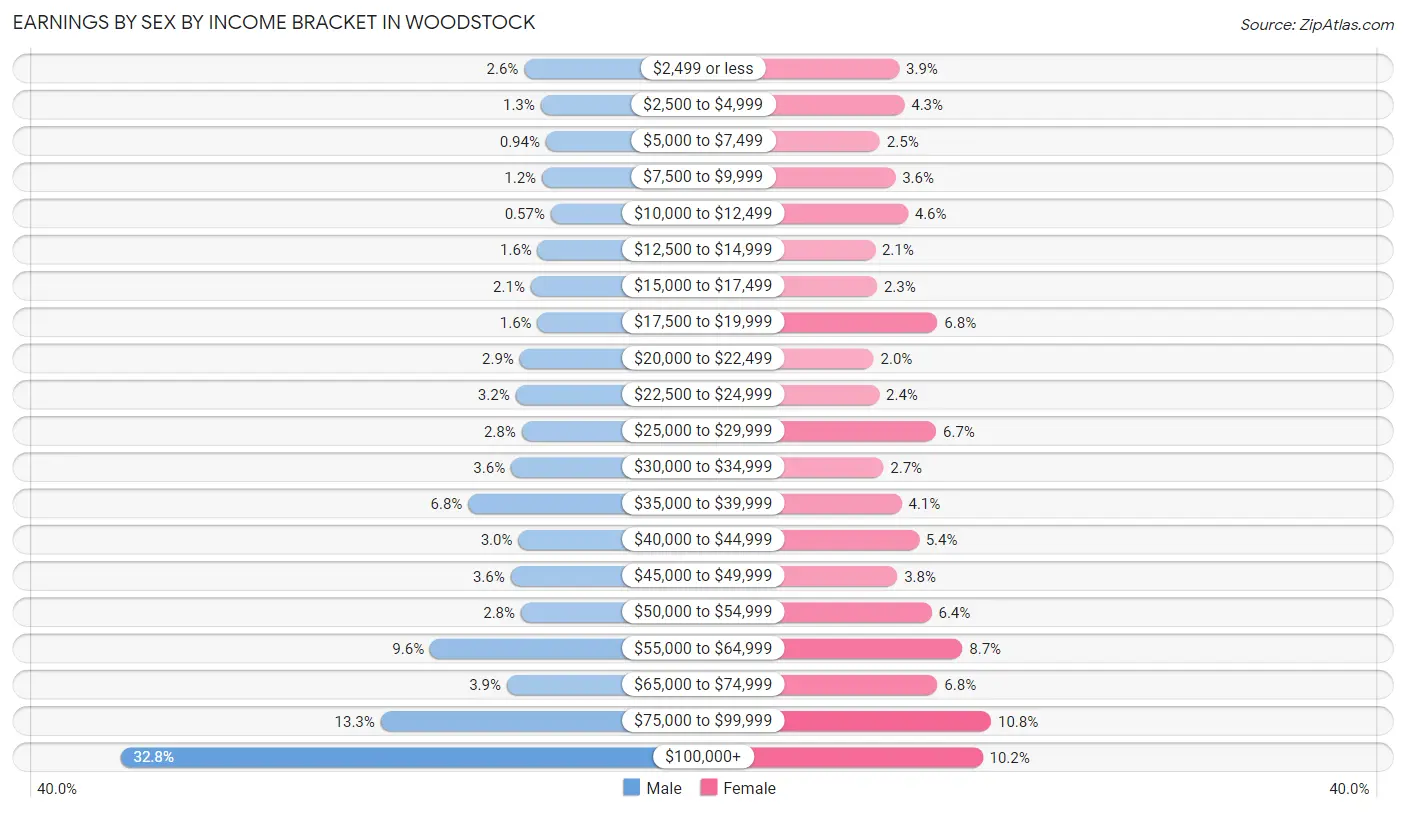
Earnings by Sex by Income Bracket in Woodstock
The most common earnings brackets in Woodstock are $100,000+ for men (3,386 | 32.8%) and $75,000 to $99,999 for women (1,178 | 10.8%).
| Income | Male | Female |
| $2,499 or less | 264 (2.6%) | 427 (3.9%) |
| $2,500 to $4,999 | 137 (1.3%) | 470 (4.3%) |
| $5,000 to $7,499 | 97 (0.9%) | 270 (2.5%) |
| $7,500 to $9,999 | 127 (1.2%) | 395 (3.6%) |
| $10,000 to $12,499 | 59 (0.6%) | 498 (4.6%) |
| $12,500 to $14,999 | 160 (1.5%) | 230 (2.1%) |
| $15,000 to $17,499 | 214 (2.1%) | 246 (2.3%) |
| $17,500 to $19,999 | 162 (1.6%) | 740 (6.8%) |
| $20,000 to $22,499 | 299 (2.9%) | 219 (2.0%) |
| $22,500 to $24,999 | 331 (3.2%) | 264 (2.4%) |
| $25,000 to $29,999 | 285 (2.8%) | 729 (6.7%) |
| $30,000 to $34,999 | 366 (3.5%) | 299 (2.7%) |
| $35,000 to $39,999 | 698 (6.8%) | 447 (4.1%) |
| $40,000 to $44,999 | 310 (3.0%) | 587 (5.4%) |
| $45,000 to $49,999 | 369 (3.6%) | 412 (3.8%) |
| $50,000 to $54,999 | 290 (2.8%) | 692 (6.4%) |
| $55,000 to $64,999 | 993 (9.6%) | 943 (8.7%) |
| $65,000 to $74,999 | 398 (3.9%) | 740 (6.8%) |
| $75,000 to $99,999 | 1,374 (13.3%) | 1,178 (10.8%) |
| $100,000+ | 3,386 (32.8%) | 1,108 (10.2%) |
| Total | 10,319 (100.0%) | 10,894 (100.0%) |
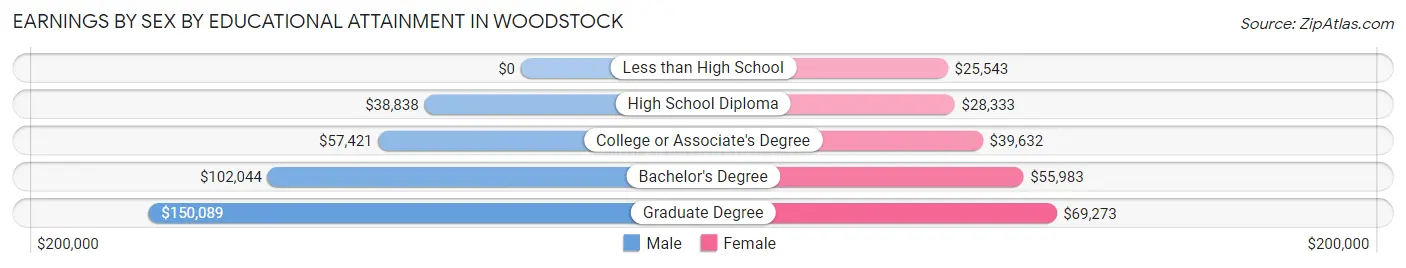
Earnings by Sex by Educational Attainment in Woodstock
Average earnings in Woodstock are $78,660 for men and $48,153 for women, a difference of 38.8%. Men with an educational attainment of graduate degree enjoy the highest average annual earnings of $150,089, while those with high school diploma education earn the least with $38,838. Women with an educational attainment of graduate degree earn the most with the average annual earnings of $69,273, while those with less than high school education have the smallest earnings of $25,543.
| Educational Attainment | Male Income | Female Income |
| Less than High School | - | - |
| High School Diploma | $38,838 | $28,333 |
| College or Associate's Degree | $57,421 | $39,632 |
| Bachelor's Degree | $102,044 | $55,983 |
| Graduate Degree | $150,089 | $69,273 |
| Total | $78,660 | $48,153 |
Family Income in Woodstock
Family Income Brackets in Woodstock
According to the Woodstock family income data, there are 2,622 families falling into the $100,000 to $149,999 income range, which is the most common income bracket and makes up 29.3% of all families. Conversely, the $25,000 to $34,999 income bracket is the least frequent group with only 116 families (1.3%) belonging to this category.
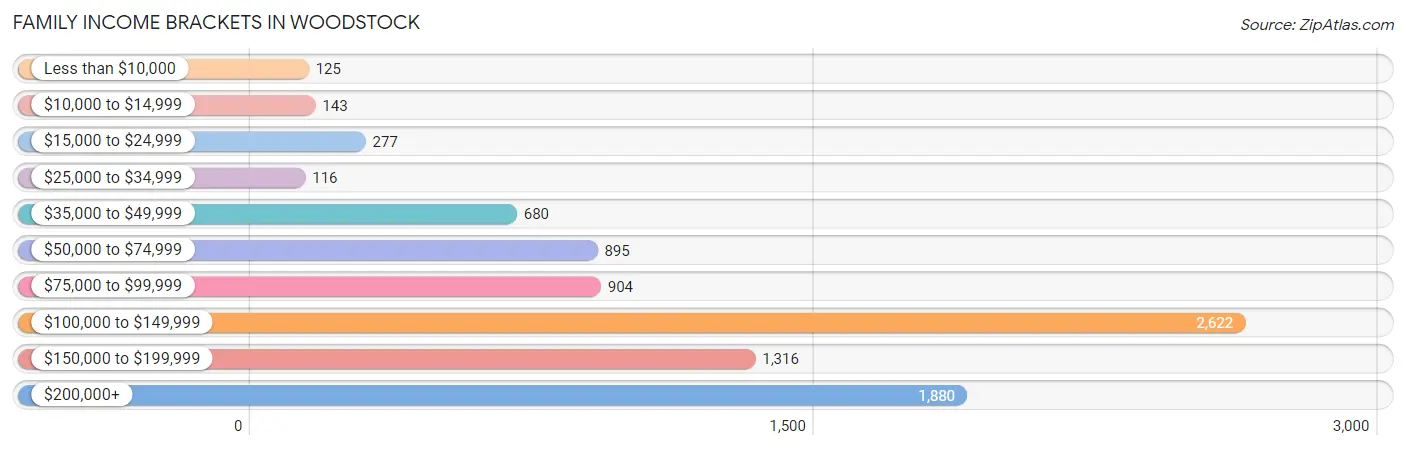
| Income Bracket | # Families | % Families |
| Less than $10,000 | 125 | 1.4% |
| $10,000 to $14,999 | 143 | 1.6% |
| $15,000 to $24,999 | 277 | 3.1% |
| $25,000 to $34,999 | 116 | 1.3% |
| $35,000 to $49,999 | 680 | 7.6% |
| $50,000 to $74,999 | 895 | 10.0% |
| $75,000 to $99,999 | 904 | 10.1% |
| $100,000 to $149,999 | 2,622 | 29.3% |
| $150,000 to $199,999 | 1,316 | 14.7% |
| $200,000+ | 1,880 | 21.0% |
Family Income by Famaliy Size in Woodstock
6-person families (304 | 3.4%) account for the highest median family income in Woodstock with $191,286 per family, while 2-person families (3,659 | 40.9%) have the highest median income of $54,394 per family member.
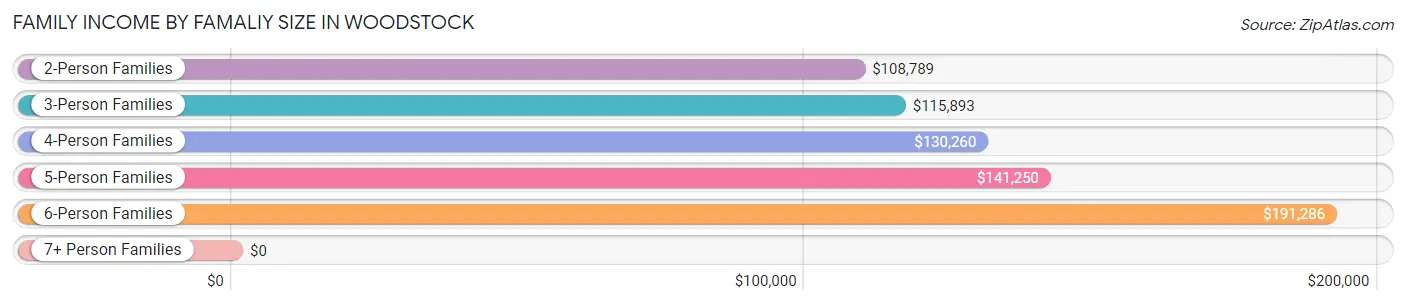
| Income Bracket | # Families | Median Income |
| 2-Person Families | 3,659 (40.9%) | $108,789 |
| 3-Person Families | 2,748 (30.7%) | $115,893 |
| 4-Person Families | 1,523 (17.0%) | $130,260 |
| 5-Person Families | 666 (7.4%) | $141,250 |
| 6-Person Families | 304 (3.4%) | $191,286 |
| 7+ Person Families | 50 (0.6%) | $0 |
| Total | 8,950 (100.0%) | $118,200 |
Family Income by Number of Earners in Woodstock
The median family income in Woodstock is $118,200, with families comprising 3+ earners (968) having the highest median family income of $170,061, while families with no earners (823) have the lowest median family income of $53,931, accounting for 10.8% and 9.2% of families, respectively.
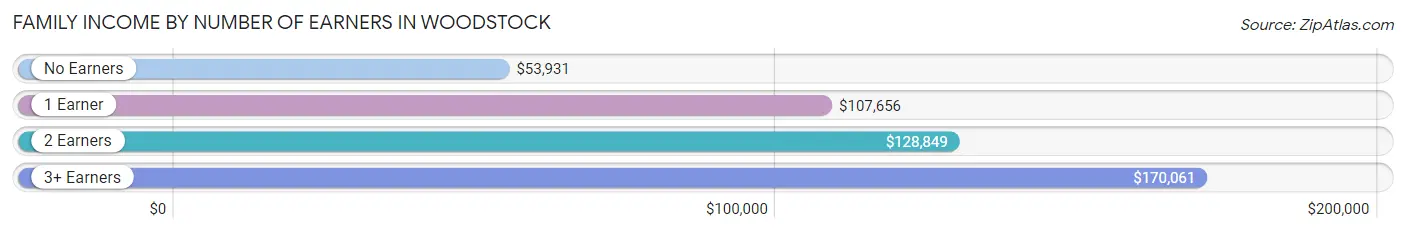
| Number of Earners | # Families | Median Income |
| No Earners | 823 (9.2%) | $53,931 |
| 1 Earner | 2,561 (28.6%) | $107,656 |
| 2 Earners | 4,598 (51.4%) | $128,849 |
| 3+ Earners | 968 (10.8%) | $170,061 |
| Total | 8,950 (100.0%) | $118,200 |
Household Income in Woodstock
Household Income Brackets in Woodstock
With 3,260 households falling in the category, the $100,000 to $149,999 income range is the most frequent in Woodstock, accounting for 23.9% of all households. In contrast, only 205 households (1.5%) fall into the less than $10,000 income bracket, making it the least populous group.
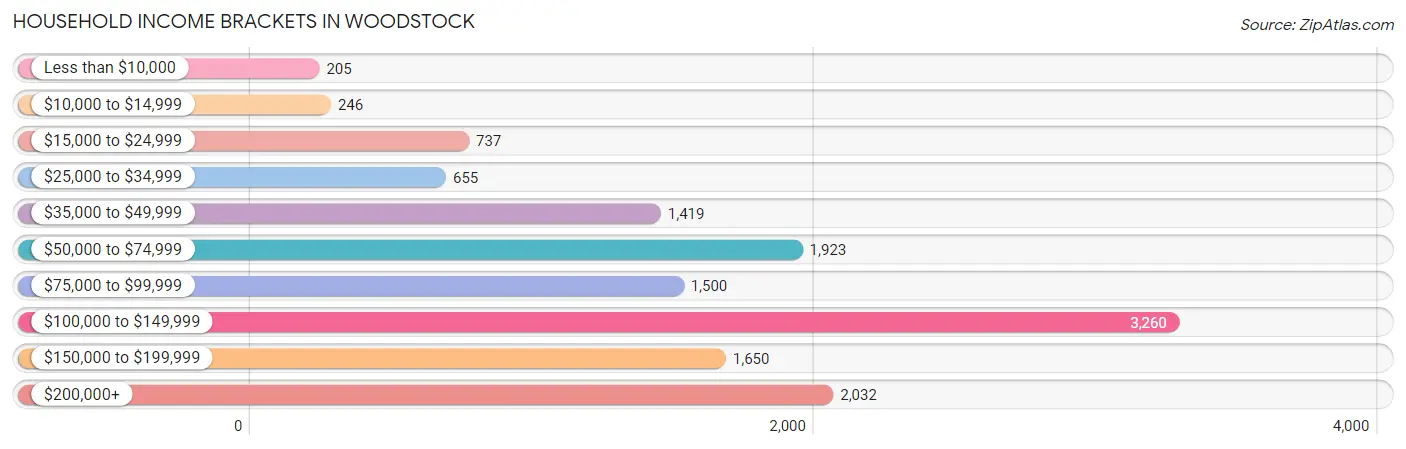
| Income Bracket | # Households | % Households |
| Less than $10,000 | 205 | 1.5% |
| $10,000 to $14,999 | 246 | 1.8% |
| $15,000 to $24,999 | 737 | 5.4% |
| $25,000 to $34,999 | 655 | 4.8% |
| $35,000 to $49,999 | 1,419 | 10.4% |
| $50,000 to $74,999 | 1,923 | 14.1% |
| $75,000 to $99,999 | 1,500 | 11.0% |
| $100,000 to $149,999 | 3,260 | 23.9% |
| $150,000 to $199,999 | 1,650 | 12.1% |
| $200,000+ | 2,032 | 14.9% |
Household Income by Householder Age in Woodstock
The median household income in Woodstock is $100,913, with the highest median household income of $121,359 found in the 45 to 64 years age bracket for the primary householder. A total of 5,373 households (39.4%) fall into this category. Meanwhile, the 65+ years age bracket for the primary householder has the lowest median household income of $50,115, with 2,845 households (20.9%) in this group.
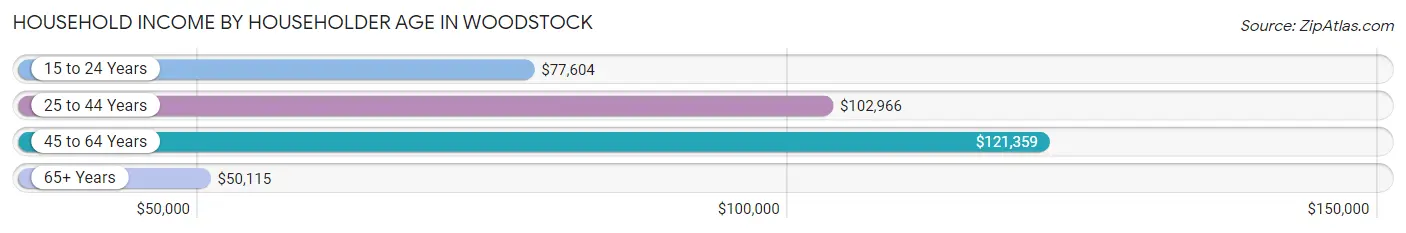
| Income Bracket | # Households | Median Income |
| 15 to 24 Years | 307 (2.2%) | $77,604 |
| 25 to 44 Years | 5,115 (37.5%) | $102,966 |
| 45 to 64 Years | 5,373 (39.4%) | $121,359 |
| 65+ Years | 2,845 (20.9%) | $50,115 |
| Total | 13,640 (100.0%) | $100,913 |
Poverty in Woodstock
Income Below Poverty by Sex and Age in Woodstock
With 4.7% poverty level for males and 6.9% for females among the residents of Woodstock, 75 year old and over males and 5 year old females are the most vulnerable to poverty, with 96 males (12.9%) and 36 females (38.7%) in their respective age groups living below the poverty level.
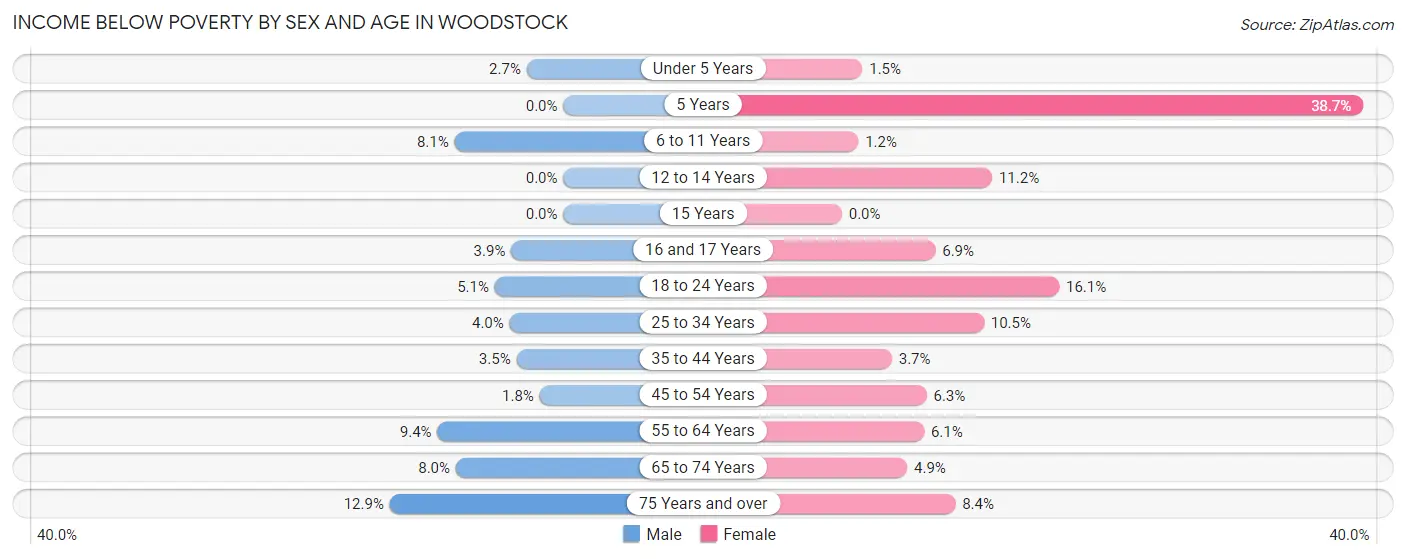
| Age Bracket | Male | Female |
| Under 5 Years | 33 (2.7%) | 20 (1.5%) |
| 5 Years | 0 (0.0%) | 36 (38.7%) |
| 6 to 11 Years | 130 (8.1%) | 17 (1.2%) |
| 12 to 14 Years | 0 (0.0%) | 67 (11.2%) |
| 15 Years | 0 (0.0%) | 0 (0.0%) |
| 16 and 17 Years | 15 (3.9%) | 43 (6.9%) |
| 18 to 24 Years | 70 (5.1%) | 225 (16.1%) |
| 25 to 34 Years | 93 (4.0%) | 330 (10.5%) |
| 35 to 44 Years | 90 (3.5%) | 97 (3.7%) |
| 45 to 54 Years | 51 (1.8%) | 164 (6.3%) |
| 55 to 64 Years | 135 (9.3%) | 111 (6.1%) |
| 65 to 74 Years | 63 (8.0%) | 80 (4.9%) |
| 75 Years and over | 96 (12.9%) | 78 (8.4%) |
| Total | 776 (4.7%) | 1,268 (6.9%) |
Income Above Poverty by Sex and Age in Woodstock
According to the poverty statistics in Woodstock, males aged 5 years and females aged 15 years are the age groups that are most secure financially, with 100.0% of males and 100.0% of females in these age groups living above the poverty line.
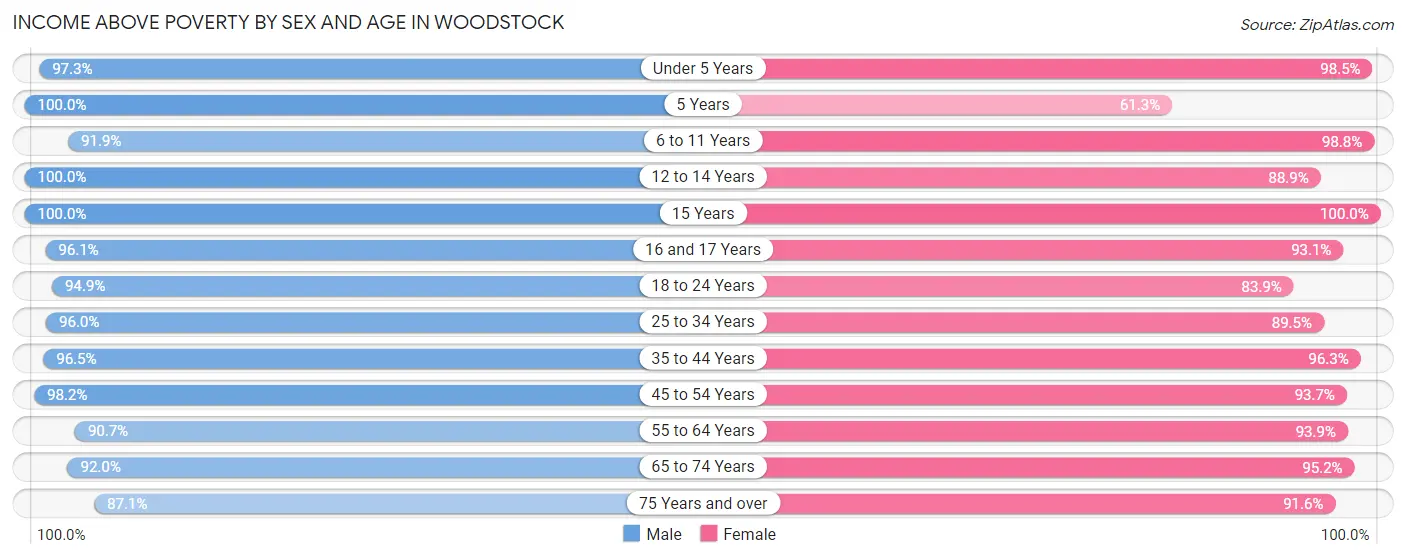
| Age Bracket | Male | Female |
| Under 5 Years | 1,182 (97.3%) | 1,292 (98.5%) |
| 5 Years | 113 (100.0%) | 57 (61.3%) |
| 6 to 11 Years | 1,478 (91.9%) | 1,371 (98.8%) |
| 12 to 14 Years | 713 (100.0%) | 534 (88.8%) |
| 15 Years | 182 (100.0%) | 317 (100.0%) |
| 16 and 17 Years | 373 (96.1%) | 577 (93.1%) |
| 18 to 24 Years | 1,305 (94.9%) | 1,170 (83.9%) |
| 25 to 34 Years | 2,237 (96.0%) | 2,801 (89.5%) |
| 35 to 44 Years | 2,495 (96.5%) | 2,517 (96.3%) |
| 45 to 54 Years | 2,846 (98.2%) | 2,444 (93.7%) |
| 55 to 64 Years | 1,309 (90.6%) | 1,709 (93.9%) |
| 65 to 74 Years | 726 (92.0%) | 1,569 (95.2%) |
| 75 Years and over | 649 (87.1%) | 848 (91.6%) |
| Total | 15,608 (95.3%) | 17,206 (93.1%) |
Income Below Poverty Among Married-Couple Families in Woodstock
The poverty statistics for married-couple families in Woodstock show that 2.2% or 156 of the total 6,941 families live below the poverty line. Families with no children have the highest poverty rate of 2.8%, comprising of 95 families. On the other hand, families with 3 or 4 children have the lowest poverty rate of 0.0%, which includes 0 families.
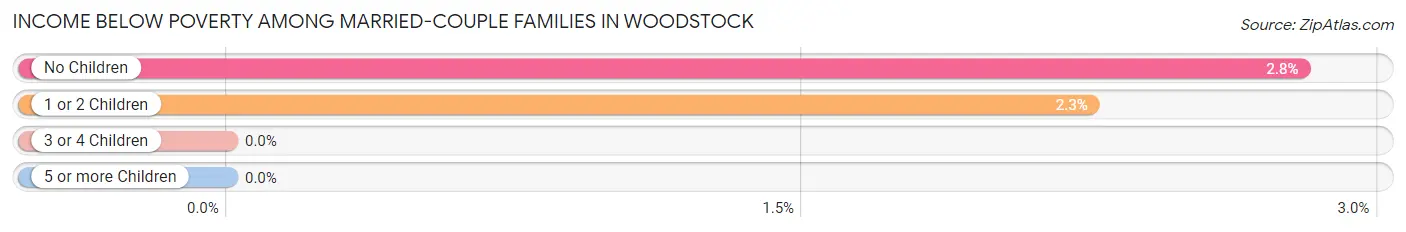
| Children | Above Poverty | Below Poverty |
| No Children | 3,294 (97.2%) | 95 (2.8%) |
| 1 or 2 Children | 2,651 (97.8%) | 61 (2.2%) |
| 3 or 4 Children | 840 (100.0%) | 0 (0.0%) |
| 5 or more Children | 0 (0.0%) | 0 (0.0%) |
| Total | 6,785 (97.8%) | 156 (2.2%) |
Income Below Poverty Among Single-Parent Households in Woodstock
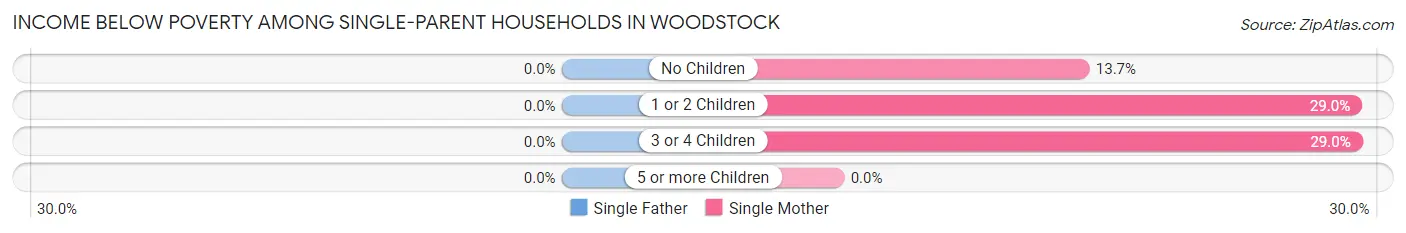
| Children | Single Father | Single Mother |
| No Children | 0 (0.0%) | 107 (13.7%) |
| 1 or 2 Children | 0 (0.0%) | 194 (29.0%) |
| 3 or 4 Children | 0 (0.0%) | 20 (29.0%) |
| 5 or more Children | 0 (0.0%) | 0 (0.0%) |
| Total | 0 (0.0%) | 321 (21.1%) |
Income Below Poverty Among Married-Couple vs Single-Parent Households in Woodstock
The poverty data for Woodstock shows that 156 of the married-couple family households (2.2%) and 321 of the single-parent households (16.0%) are living below the poverty level. Within the married-couple family households, those with no children have the highest poverty rate, with 95 households (2.8%) falling below the poverty line. Among the single-parent households, those with 3 or 4 children have the highest poverty rate, with 20 household (29.0%) living below poverty.
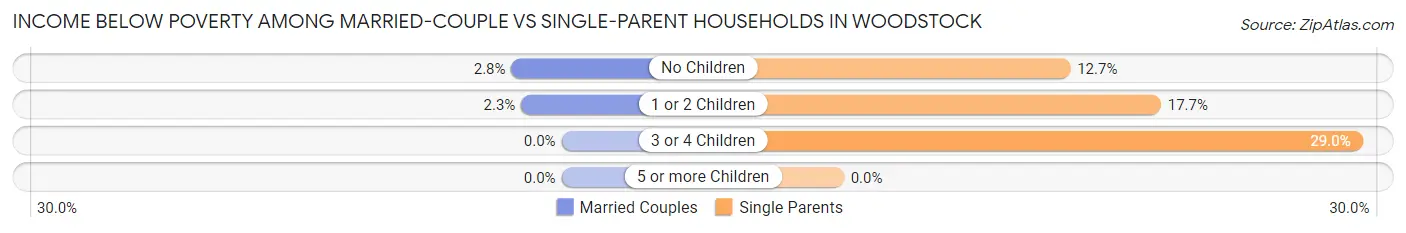
| Children | Married-Couple Families | Single-Parent Households |
| No Children | 95 (2.8%) | 107 (12.7%) |
| 1 or 2 Children | 61 (2.2%) | 194 (17.7%) |
| 3 or 4 Children | 0 (0.0%) | 20 (29.0%) |
| 5 or more Children | 0 (0.0%) | 0 (0.0%) |
| Total | 156 (2.2%) | 321 (16.0%) |
Race in Woodstock
The most populous races in Woodstock are White / Caucasian (25,520 | 72.6%), Black / African American (4,292 | 12.2%), and Hispanic or Latino (3,499 | 10.0%).
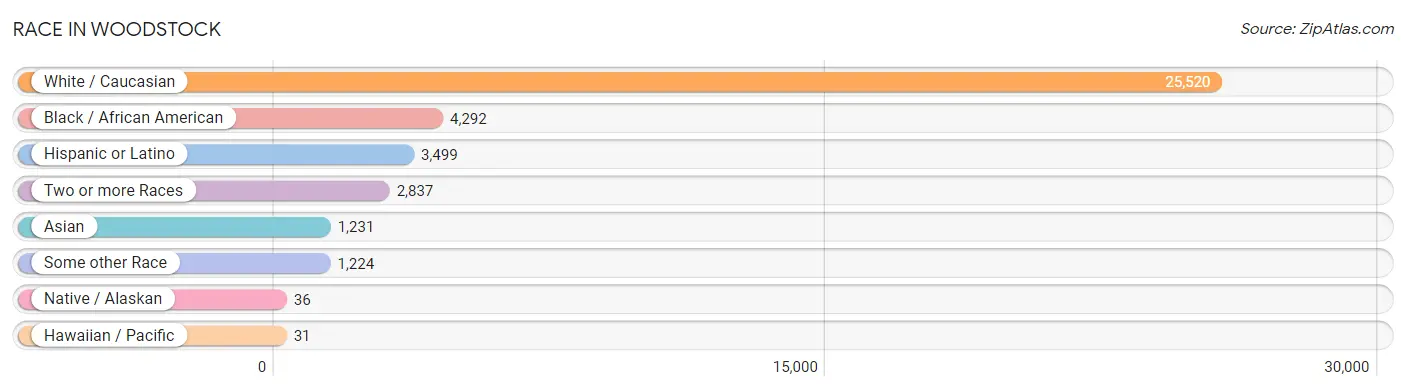
| Race | # Population | % Population |
| Asian | 1,231 | 3.5% |
| Black / African American | 4,292 | 12.2% |
| Hawaiian / Pacific | 31 | 0.1% |
| Hispanic or Latino | 3,499 | 10.0% |
| Native / Alaskan | 36 | 0.1% |
| White / Caucasian | 25,520 | 72.6% |
| Two or more Races | 2,837 | 8.1% |
| Some other Race | 1,224 | 3.5% |
| Total | 35,171 | 100.0% |
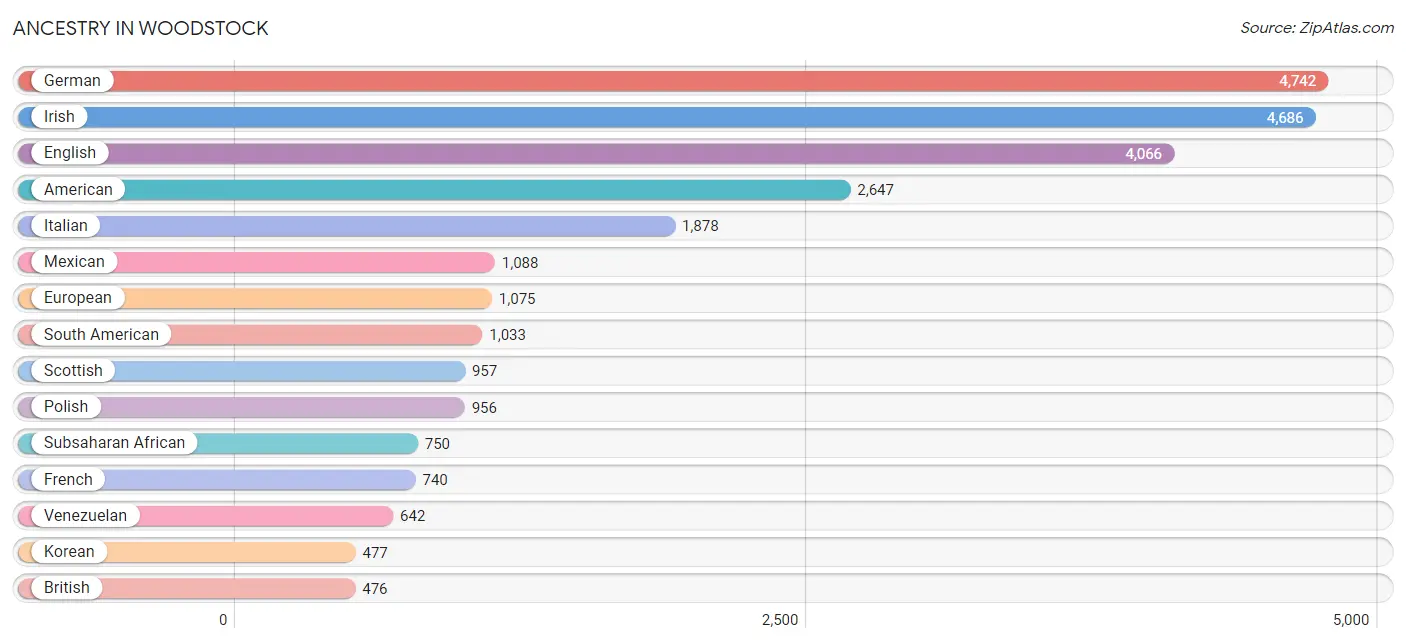
Ancestry in Woodstock
The most populous ancestries reported in Woodstock are German (4,742 | 13.5%), Irish (4,686 | 13.3%), English (4,066 | 11.6%), American (2,647 | 7.5%), and Italian (1,878 | 5.3%), together accounting for 51.2% of all Woodstock residents.
| Ancestry | # Population | % Population |
| African | 128 | 0.4% |
| American | 2,647 | 7.5% |
| Arab | 380 | 1.1% |
| Argentinean | 45 | 0.1% |
| Armenian | 30 | 0.1% |
| Austrian | 69 | 0.2% |
| Belgian | 26 | 0.1% |
| Bhutanese | 86 | 0.2% |
| Blackfeet | 11 | 0.0% |
| Brazilian | 324 | 0.9% |
| British | 476 | 1.3% |
| Burmese | 110 | 0.3% |
| Canadian | 139 | 0.4% |
| Central American | 293 | 0.8% |
| Central American Indian | 105 | 0.3% |
| Cherokee | 145 | 0.4% |
| Choctaw | 17 | 0.1% |
| Colombian | 186 | 0.5% |
| Costa Rican | 133 | 0.4% |
| Creek | 17 | 0.1% |
| Croatian | 5 | 0.0% |
| Cuban | 349 | 1.0% |
| Cypriot | 20 | 0.1% |
| Czech | 56 | 0.2% |
| Czechoslovakian | 11 | 0.0% |
| Danish | 92 | 0.3% |
| Dutch | 174 | 0.5% |
| Eastern European | 47 | 0.1% |
| Ecuadorian | 73 | 0.2% |
| English | 4,066 | 11.6% |
| European | 1,075 | 3.1% |
| Finnish | 23 | 0.1% |
| French | 740 | 2.1% |
| French Canadian | 145 | 0.4% |
| German | 4,742 | 13.5% |
| Greek | 283 | 0.8% |
| Guamanian / Chamorro | 28 | 0.1% |
| Guatemalan | 41 | 0.1% |
| Haitian | 343 | 1.0% |
| Honduran | 78 | 0.2% |
| Hungarian | 59 | 0.2% |
| Indian (Asian) | 230 | 0.6% |
| Iranian | 100 | 0.3% |
| Irish | 4,686 | 13.3% |
| Israeli | 9 | 0.0% |
| Italian | 1,878 | 5.3% |
| Jamaican | 77 | 0.2% |
| Japanese | 243 | 0.7% |
| Korean | 477 | 1.4% |
| Lebanese | 192 | 0.5% |
| Lithuanian | 21 | 0.1% |
| Mexican | 1,088 | 3.1% |
| Native Hawaiian | 319 | 0.9% |
| Navajo | 63 | 0.2% |
| Nigerian | 155 | 0.4% |
| Norwegian | 289 | 0.8% |
| Palestinian | 124 | 0.4% |
| Peruvian | 87 | 0.3% |
| Polish | 956 | 2.7% |
| Portuguese | 45 | 0.1% |
| Puerto Rican | 466 | 1.3% |
| Romanian | 94 | 0.3% |
| Russian | 158 | 0.4% |
| Salvadoran | 32 | 0.1% |
| Scotch-Irish | 415 | 1.2% |
| Scottish | 957 | 2.7% |
| Seminole | 23 | 0.1% |
| Sioux | 23 | 0.1% |
| Slovak | 61 | 0.2% |
| South American | 1,033 | 2.9% |
| Spaniard | 67 | 0.2% |
| Spanish | 186 | 0.5% |
| Sri Lankan | 66 | 0.2% |
| Subsaharan African | 750 | 2.1% |
| Swedish | 375 | 1.1% |
| Swiss | 158 | 0.4% |
| Syrian | 9 | 0.0% |
| Thai | 473 | 1.3% |
| Turkish | 66 | 0.2% |
| Ukrainian | 39 | 0.1% |
| Venezuelan | 642 | 1.8% |
| Welsh | 183 | 0.5% |
| West Indian | 35 | 0.1% |
| Yugoslavian | 410 | 1.2% | View All 84 Rows |
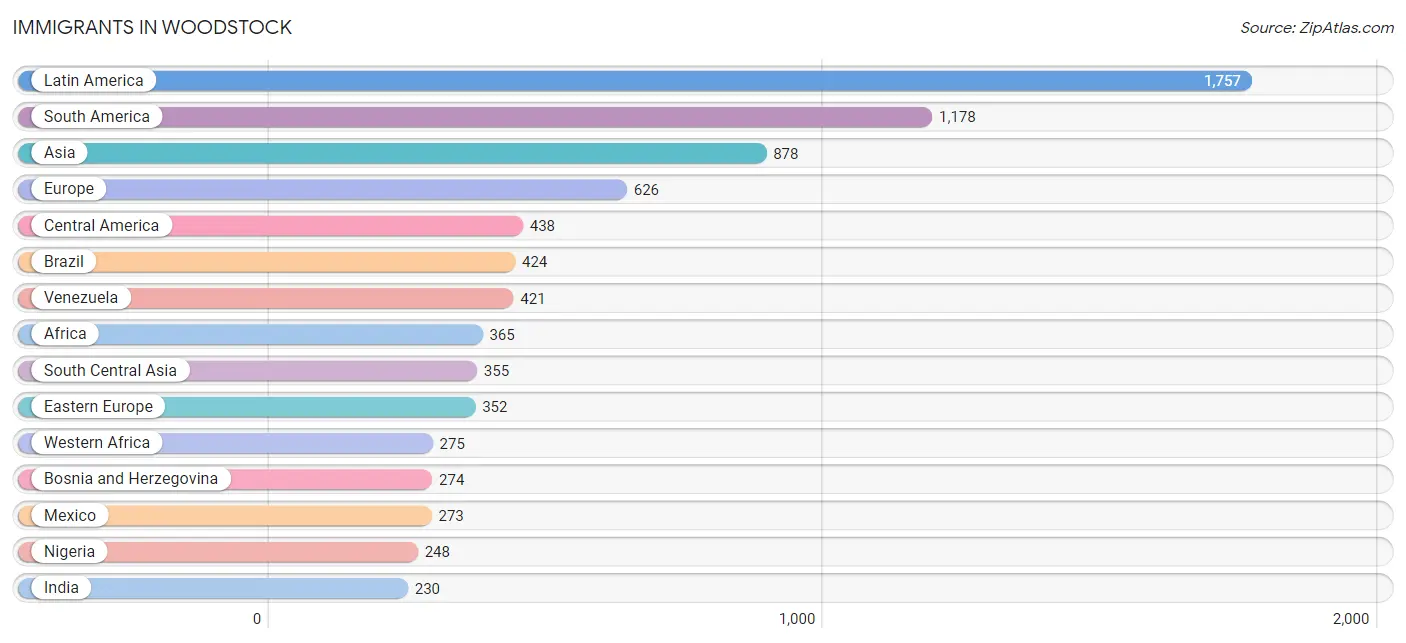
Immigrants in Woodstock
The most numerous immigrant groups reported in Woodstock came from Latin America (1,757 | 5.0%), South America (1,178 | 3.4%), Asia (878 | 2.5%), Europe (626 | 1.8%), and Central America (438 | 1.3%), together accounting for 13.9% of all Woodstock residents.
| Immigration Origin | # Population | % Population |
| Africa | 365 | 1.0% |
| Argentina | 34 | 0.1% |
| Asia | 878 | 2.5% |
| Bosnia and Herzegovina | 274 | 0.8% |
| Brazil | 424 | 1.2% |
| Cambodia | 99 | 0.3% |
| Canada | 127 | 0.4% |
| Caribbean | 141 | 0.4% |
| Central America | 438 | 1.3% |
| China | 89 | 0.3% |
| Colombia | 167 | 0.5% |
| Costa Rica | 76 | 0.2% |
| Cuba | 26 | 0.1% |
| Eastern Asia | 150 | 0.4% |
| Eastern Europe | 352 | 1.0% |
| Ecuador | 57 | 0.2% |
| England | 30 | 0.1% |
| Europe | 626 | 1.8% |
| Germany | 61 | 0.2% |
| Greece | 32 | 0.1% |
| Guatemala | 75 | 0.2% |
| Haiti | 26 | 0.1% |
| Honduras | 14 | 0.0% |
| India | 230 | 0.6% |
| Iran | 34 | 0.1% |
| Ireland | 18 | 0.1% |
| Israel | 40 | 0.1% |
| Italy | 18 | 0.1% |
| Jamaica | 53 | 0.2% |
| Korea | 61 | 0.2% |
| Latin America | 1,757 | 5.0% |
| Lebanon | 20 | 0.1% |
| Mexico | 273 | 0.8% |
| Middle Africa | 28 | 0.1% |
| Nigeria | 248 | 0.7% |
| Northern Africa | 55 | 0.2% |
| Northern Europe | 163 | 0.5% |
| Pakistan | 91 | 0.3% |
| Peru | 75 | 0.2% |
| Philippines | 81 | 0.2% |
| Poland | 65 | 0.2% |
| Russia | 13 | 0.0% |
| South Africa | 7 | 0.0% |
| South America | 1,178 | 3.4% |
| South Central Asia | 355 | 1.0% |
| South Eastern Asia | 229 | 0.6% |
| Southern Europe | 50 | 0.1% |
| Trinidad and Tobago | 36 | 0.1% |
| Turkey | 27 | 0.1% |
| Venezuela | 421 | 1.2% |
| Vietnam | 49 | 0.1% |
| Western Africa | 275 | 0.8% |
| Western Asia | 107 | 0.3% |
| Western Europe | 61 | 0.2% | View All 54 Rows |
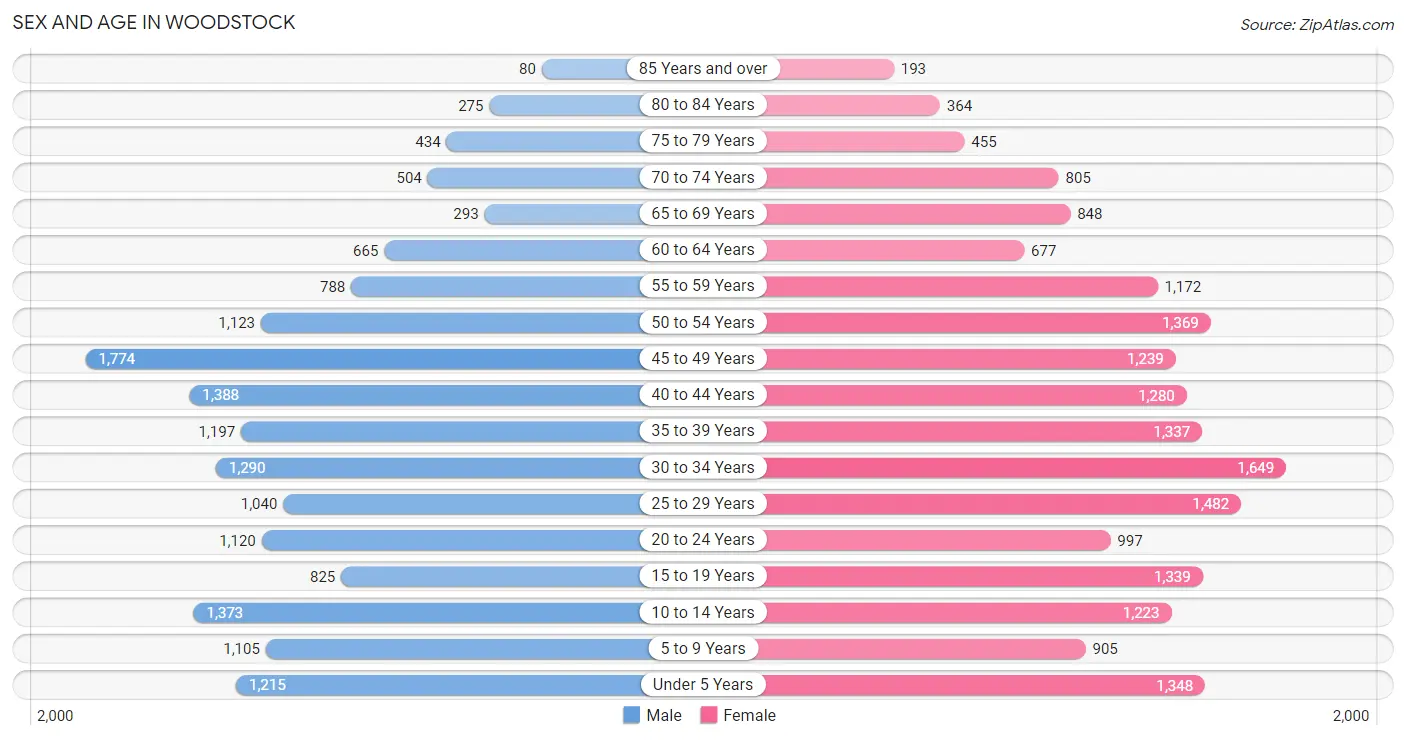
Sex and Age in Woodstock
Sex and Age in Woodstock
The most populous age groups in Woodstock are 45 to 49 Years (1,774 | 10.8%) for men and 30 to 34 Years (1,649 | 8.8%) for women.
| Age Bracket | Male | Female |
| Under 5 Years | 1,215 (7.4%) | 1,348 (7.2%) |
| 5 to 9 Years | 1,105 (6.7%) | 905 (4.8%) |
| 10 to 14 Years | 1,373 (8.3%) | 1,223 (6.6%) |
| 15 to 19 Years | 825 (5.0%) | 1,339 (7.2%) |
| 20 to 24 Years | 1,120 (6.8%) | 997 (5.3%) |
| 25 to 29 Years | 1,040 (6.3%) | 1,482 (7.9%) |
| 30 to 34 Years | 1,290 (7.8%) | 1,649 (8.8%) |
| 35 to 39 Years | 1,197 (7.3%) | 1,337 (7.2%) |
| 40 to 44 Years | 1,388 (8.4%) | 1,280 (6.9%) |
| 45 to 49 Years | 1,774 (10.8%) | 1,239 (6.6%) |
| 50 to 54 Years | 1,123 (6.8%) | 1,369 (7.3%) |
| 55 to 59 Years | 788 (4.8%) | 1,172 (6.3%) |
| 60 to 64 Years | 665 (4.0%) | 677 (3.6%) |
| 65 to 69 Years | 293 (1.8%) | 848 (4.5%) |
| 70 to 74 Years | 504 (3.1%) | 805 (4.3%) |
| 75 to 79 Years | 434 (2.6%) | 455 (2.4%) |
| 80 to 84 Years | 275 (1.7%) | 364 (1.9%) |
| 85 Years and over | 80 (0.5%) | 193 (1.0%) |
| Total | 16,489 (100.0%) | 18,682 (100.0%) |
Families and Households in Woodstock
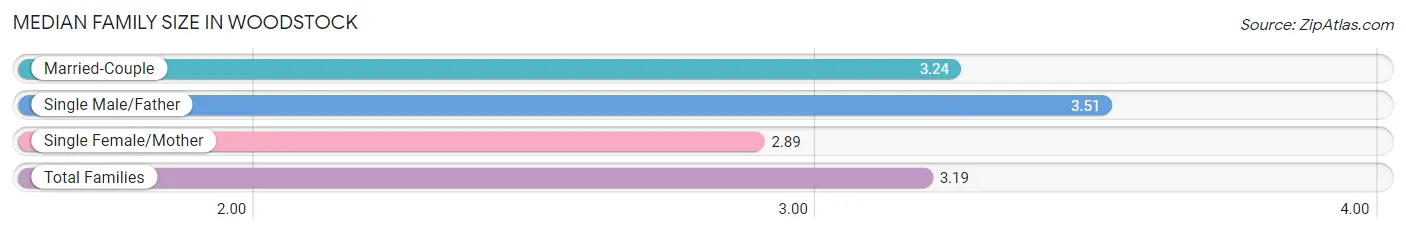
Median Family Size in Woodstock
The median family size in Woodstock is 3.19 persons per family, with single male/father families (489 | 5.5%) accounting for the largest median family size of 3.51 persons per family. On the other hand, single female/mother families (1,520 | 17.0%) represent the smallest median family size with 2.89 persons per family.
| Family Type | # Families | Family Size |
| Married-Couple | 6,941 (77.5%) | 3.24 |
| Single Male/Father | 489 (5.5%) | 3.51 |
| Single Female/Mother | 1,520 (17.0%) | 2.89 |
| Total Families | 8,950 (100.0%) | 3.19 |
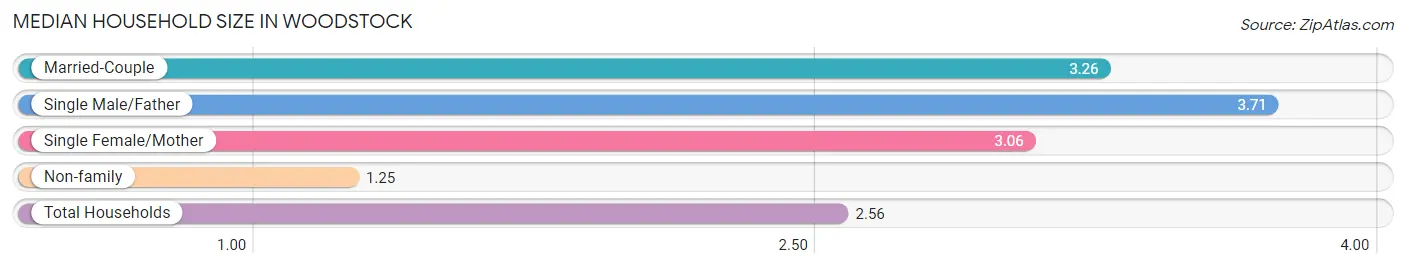
Median Household Size in Woodstock
The median household size in Woodstock is 2.56 persons per household, with single male/father households (489 | 3.6%) accounting for the largest median household size of 3.71 persons per household. non-family households (4,690 | 34.4%) represent the smallest median household size with 1.25 persons per household.
| Household Type | # Households | Household Size |
| Married-Couple | 6,941 (50.9%) | 3.26 |
| Single Male/Father | 489 (3.6%) | 3.71 |
| Single Female/Mother | 1,520 (11.1%) | 3.06 |
| Non-family | 4,690 (34.4%) | 1.25 |
| Total Households | 13,640 (100.0%) | 2.56 |
Household Size by Marriage Status in Woodstock
Out of a total of 13,640 households in Woodstock, 8,950 (65.6%) are family households, while 4,690 (34.4%) are nonfamily households. The most numerous type of family households are 2-person households, comprising 3,475, and the most common type of nonfamily households are 1-person households, comprising 3,919.
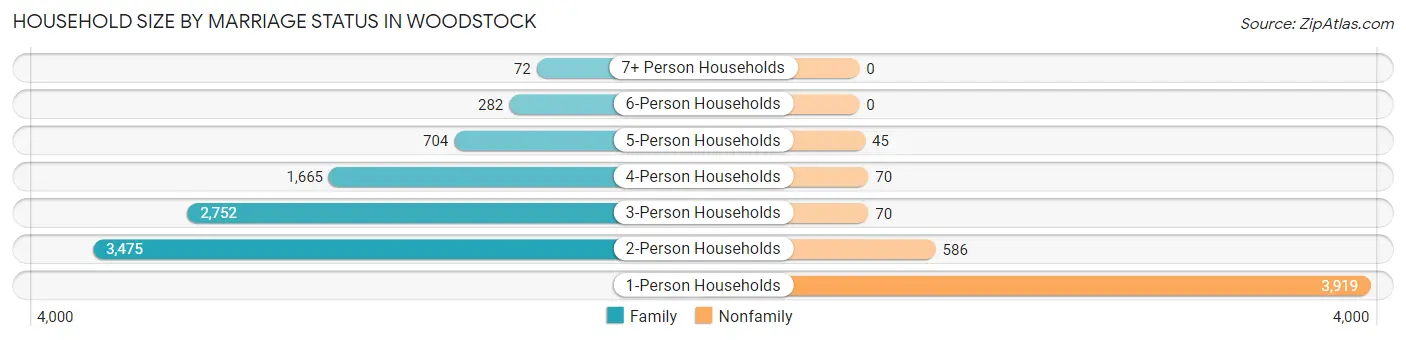
| Household Size | Family Households | Nonfamily Households |
| 1-Person Households | - | 3,919 (28.7%) |
| 2-Person Households | 3,475 (25.5%) | 586 (4.3%) |
| 3-Person Households | 2,752 (20.2%) | 70 (0.5%) |
| 4-Person Households | 1,665 (12.2%) | 70 (0.5%) |
| 5-Person Households | 704 (5.2%) | 45 (0.3%) |
| 6-Person Households | 282 (2.1%) | 0 (0.0%) |
| 7+ Person Households | 72 (0.5%) | 0 (0.0%) |
| Total | 8,950 (65.6%) | 4,690 (34.4%) |
Female Fertility in Woodstock
Fertility by Age in Woodstock
Average fertility rate in Woodstock is 56.0 births per 1,000 women. Women in the age bracket of 20 to 34 years have the highest fertility rate with 72.0 births per 1,000 women. Women in the age bracket of 20 to 34 years acount for 55.4% of all women with births.
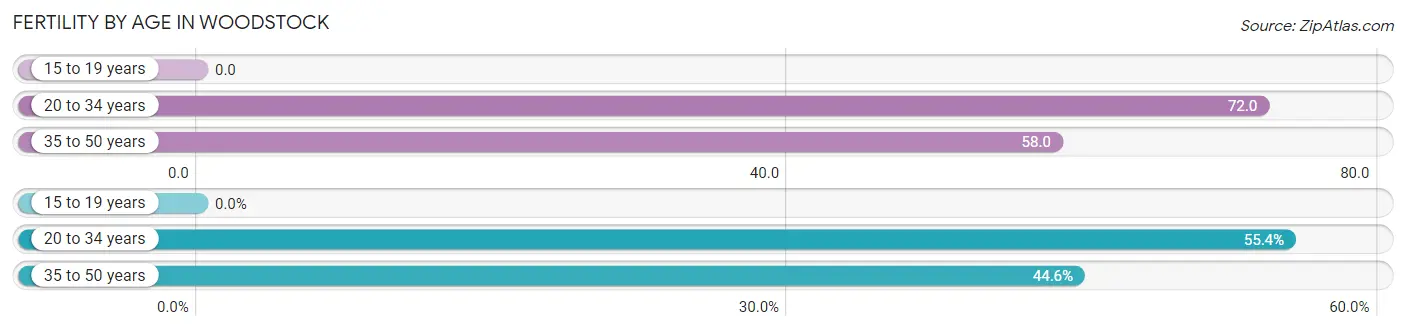
| Age Bracket | Women with Births | Births / 1,000 Women |
| 15 to 19 years | 0 (0.0%) | 0.0 |
| 20 to 34 years | 299 (55.4%) | 72.0 |
| 35 to 50 years | 241 (44.6%) | 58.0 |
| Total | 540 (100.0%) | 56.0 |
Fertility by Age by Marriage Status in Woodstock
95.6% of women with births (540) in Woodstock are married. The highest percentage of unmarried women with births falls into 20 to 34 years age bracket with 8.0% of them unmarried at the time of birth, while the lowest percentage of unmarried women with births belong to 35 to 50 years age bracket with 0.0% of them unmarried.
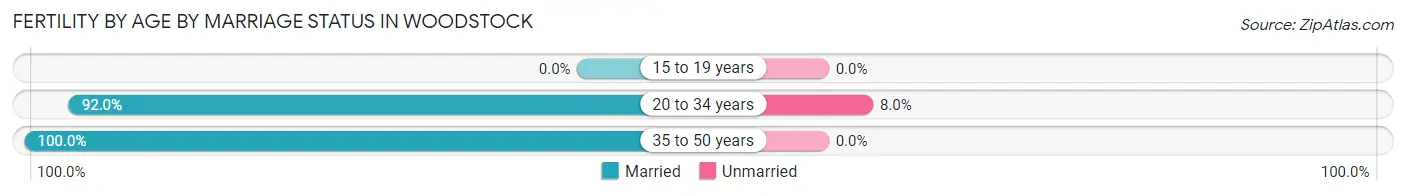
| Age Bracket | Married | Unmarried |
| 15 to 19 years | 0 (0.0%) | 0 (0.0%) |
| 20 to 34 years | 275 (92.0%) | 24 (8.0%) |
| 35 to 50 years | 241 (100.0%) | 0 (0.0%) |
| Total | 516 (95.6%) | 24 (4.4%) |
Fertility by Education in Woodstock
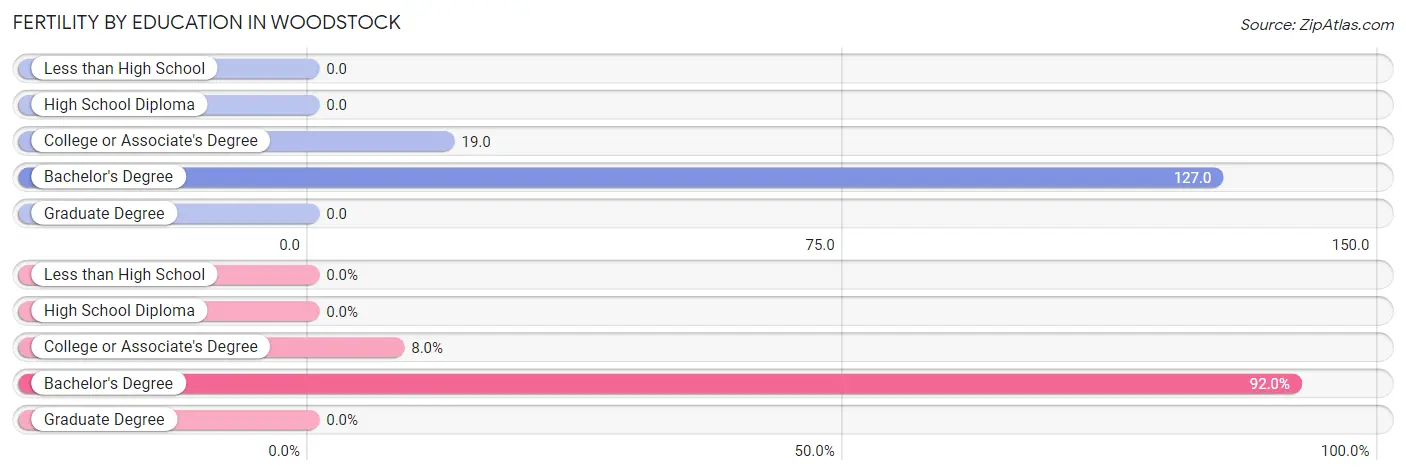
| Educational Attainment | Women with Births | Births / 1,000 Women |
| Less than High School | 0 (0.0%) | 0.0 |
| High School Diploma | 0 (0.0%) | 0.0 |
| College or Associate's Degree | 43 (8.0%) | 19.0 |
| Bachelor's Degree | 497 (92.0%) | 127.0 |
| Graduate Degree | 0 (0.0%) | 0.0 |
| Total | 540 (100.0%) | 56.0 |
Fertility by Education by Marriage Status in Woodstock
4.4% of women with births in Woodstock are unmarried. Women with the educational attainment of bachelor's degree are most likely to be married with 100.0% of them married at childbirth, while women with the educational attainment of college or associate's degree are least likely to be married with 55.8% of them unmarried at childbirth.
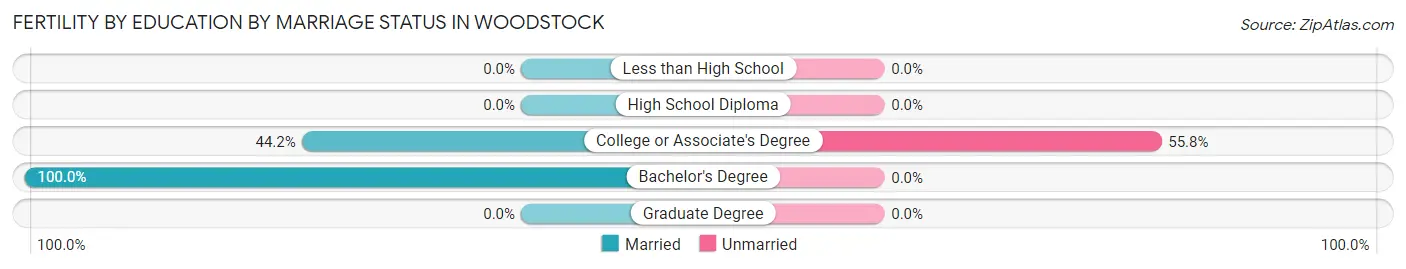
| Educational Attainment | Married | Unmarried |
| Less than High School | 0 (0.0%) | 0 (0.0%) |
| High School Diploma | 0 (0.0%) | 0 (0.0%) |
| College or Associate's Degree | 19 (44.2%) | 24 (55.8%) |
| Bachelor's Degree | 497 (100.0%) | 0 (0.0%) |
| Graduate Degree | 0 (0.0%) | 0 (0.0%) |
| Total | 516 (95.6%) | 24 (4.4%) |
Employment Characteristics in Woodstock
Employment by Class of Employer in Woodstock
Among the 19,947 employed individuals in Woodstock, private company employees (14,001 | 70.2%), local government employees (1,640 | 8.2%), and self-employed (incorporated) (1,268 | 6.4%) make up the most common classes of employment.
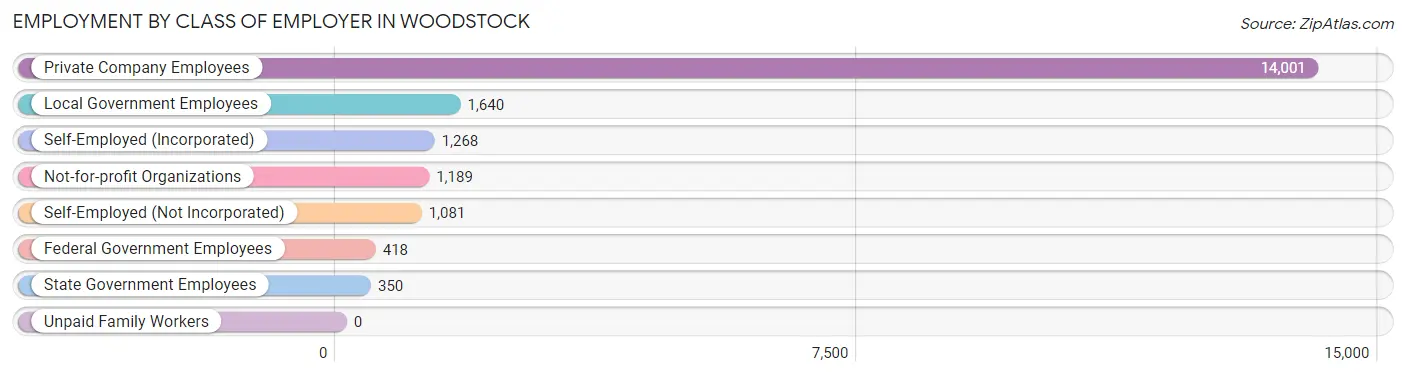
| Employer Class | # Employees | % Employees |
| Private Company Employees | 14,001 | 70.2% |
| Self-Employed (Incorporated) | 1,268 | 6.4% |
| Self-Employed (Not Incorporated) | 1,081 | 5.4% |
| Not-for-profit Organizations | 1,189 | 6.0% |
| Local Government Employees | 1,640 | 8.2% |
| State Government Employees | 350 | 1.8% |
| Federal Government Employees | 418 | 2.1% |
| Unpaid Family Workers | 0 | 0.0% |
| Total | 19,947 | 100.0% |
Employment Status by Age in Woodstock
According to the labor force statistics for Woodstock, out of the total population over 16 years of age (27,503), 75.3% or 20,710 individuals are in the labor force, with 2.8% or 580 of them unemployed. The age group with the highest labor force participation rate is 35 to 44 years, with 93.6% or 4,869 individuals in the labor force. Within the labor force, the 45 to 54 years age range has the highest percentage of unemployed individuals, with 4.7% or 230 of them being unemployed.
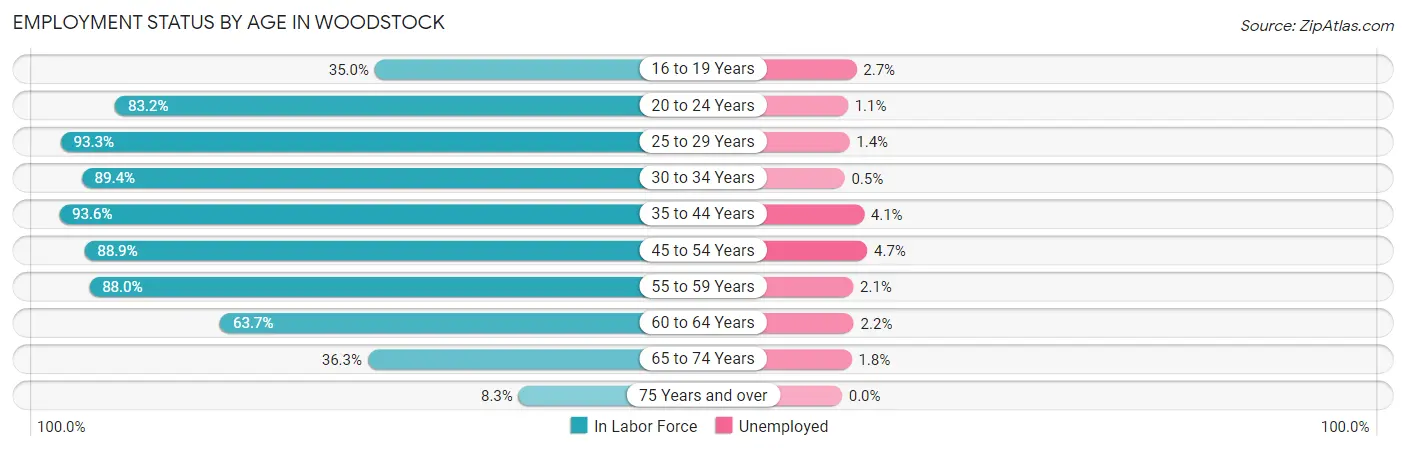
| Age Bracket | In Labor Force | Unemployed |
| 16 to 19 Years | 583 (35.0%) | 16 (2.7%) |
| 20 to 24 Years | 1,761 (83.2%) | 19 (1.1%) |
| 25 to 29 Years | 2,353 (93.3%) | 33 (1.4%) |
| 30 to 34 Years | 2,627 (89.4%) | 13 (0.5%) |
| 35 to 44 Years | 4,869 (93.6%) | 200 (4.1%) |
| 45 to 54 Years | 4,894 (88.9%) | 230 (4.7%) |
| 55 to 59 Years | 1,725 (88.0%) | 36 (2.1%) |
| 60 to 64 Years | 855 (63.7%) | 19 (2.2%) |
| 65 to 74 Years | 889 (36.3%) | 16 (1.8%) |
| 75 Years and over | 149 (8.3%) | 0 (0.0%) |
| Total | 20,710 (75.3%) | 580 (2.8%) |
Employment Status by Educational Attainment in Woodstock
According to labor force statistics for Woodstock, 89.0% of individuals (17,328) out of the total population between 25 and 64 years of age (19,470) are in the labor force, with 3.1% or 537 of them being unemployed. The group with the highest labor force participation rate are those with the educational attainment of bachelor's degree or higher, with 91.4% or 9,857 individuals in the labor force. Within the labor force, individuals with less than high school education have the highest percentage of unemployment, with 9.5% or 51 of them being unemployed.
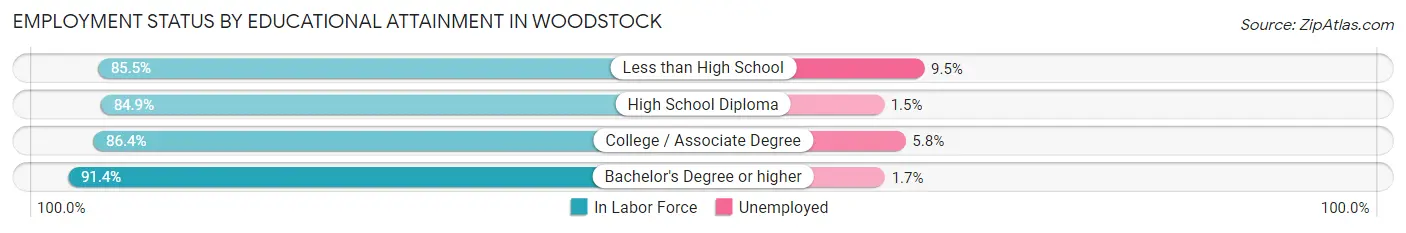
| Educational Attainment | In Labor Force | Unemployed |
| Less than High School | 535 (85.5%) | 59 (9.5%) |
| High School Diploma | 1,964 (84.9%) | 35 (1.5%) |
| College / Associate Degree | 4,965 (86.4%) | 333 (5.8%) |
| Bachelor's Degree or higher | 9,857 (91.4%) | 183 (1.7%) |
| Total | 17,328 (89.0%) | 604 (3.1%) |
Employment Occupations by Sex in Woodstock
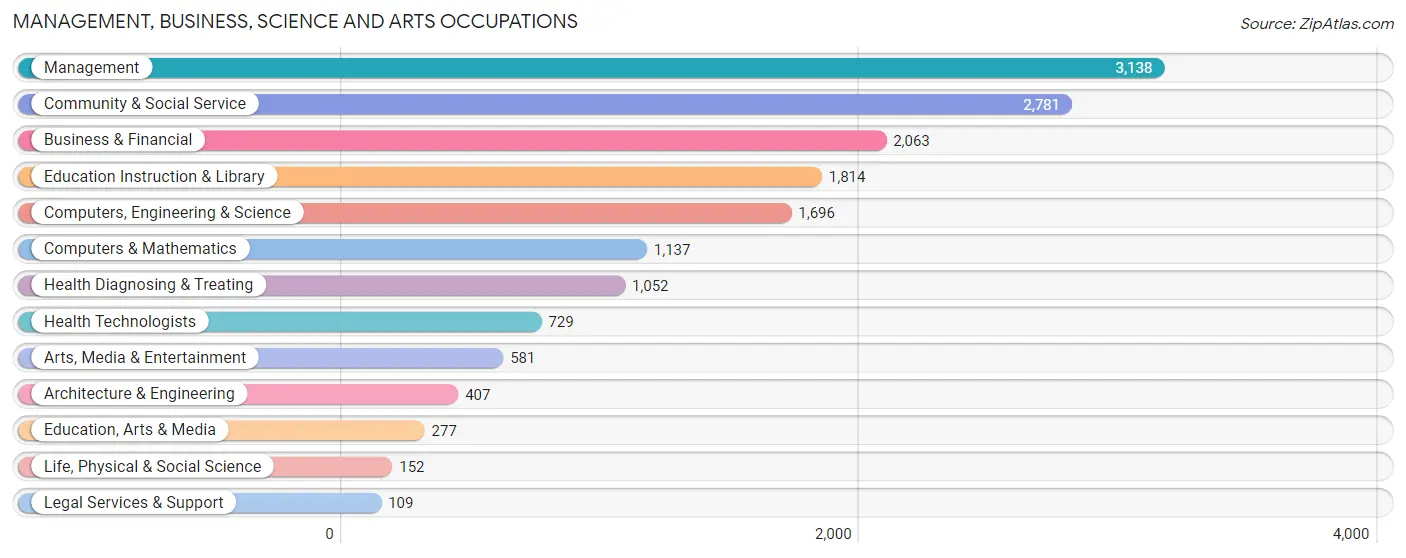
Management, Business, Science and Arts Occupations
The most common Management, Business, Science and Arts occupations in Woodstock are Management (3,138 | 15.6%), Community & Social Service (2,781 | 13.9%), Business & Financial (2,063 | 10.3%), Education Instruction & Library (1,814 | 9.0%), and Computers, Engineering & Science (1,696 | 8.5%).
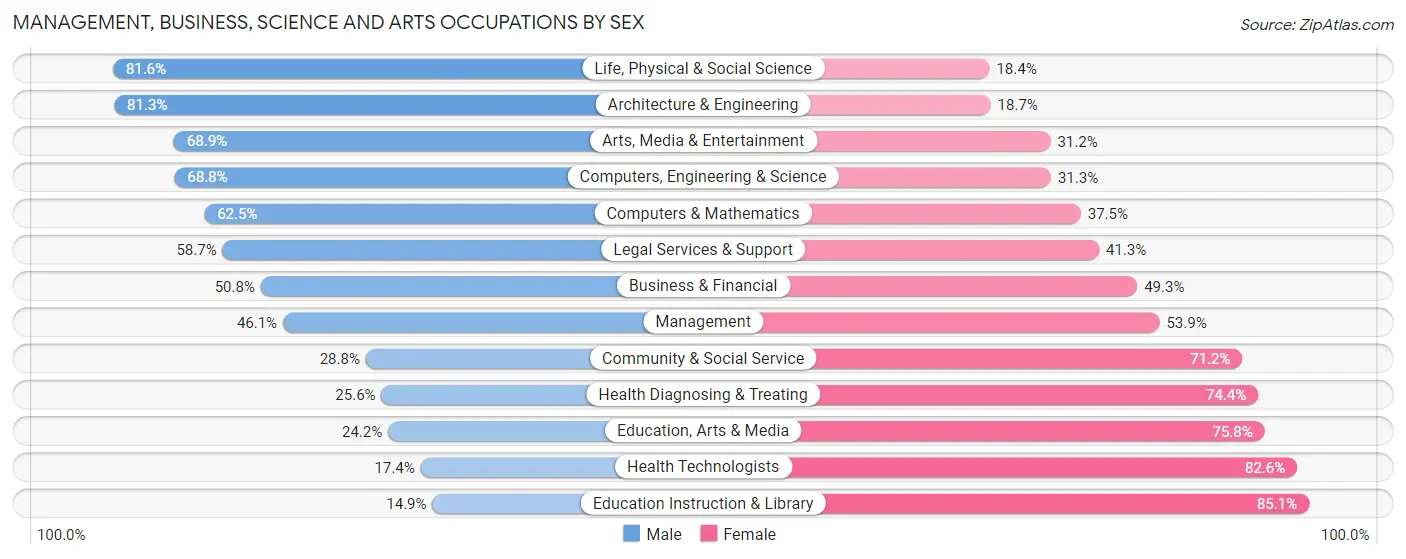
Management, Business, Science and Arts Occupations by Sex
Within the Management, Business, Science and Arts occupations in Woodstock, the most male-oriented occupations are Life, Physical & Social Science (81.6%), Architecture & Engineering (81.3%), and Arts, Media & Entertainment (68.9%), while the most female-oriented occupations are Education Instruction & Library (85.1%), Health Technologists (82.6%), and Education, Arts & Media (75.8%).
| Occupation | Male | Female |
| Management | 1,447 (46.1%) | 1,691 (53.9%) |
| Business & Financial | 1,047 (50.7%) | 1,016 (49.2%) |
| Computers, Engineering & Science | 1,166 (68.8%) | 530 (31.2%) |
| Computers & Mathematics | 711 (62.5%) | 426 (37.5%) |
| Architecture & Engineering | 331 (81.3%) | 76 (18.7%) |
| Life, Physical & Social Science | 124 (81.6%) | 28 (18.4%) |
| Community & Social Service | 802 (28.8%) | 1,979 (71.2%) |
| Education, Arts & Media | 67 (24.2%) | 210 (75.8%) |
| Legal Services & Support | 64 (58.7%) | 45 (41.3%) |
| Education Instruction & Library | 271 (14.9%) | 1,543 (85.1%) |
| Arts, Media & Entertainment | 400 (68.9%) | 181 (31.1%) |
| Health Diagnosing & Treating | 269 (25.6%) | 783 (74.4%) |
| Health Technologists | 127 (17.4%) | 602 (82.6%) |
| Total (Category) | 4,731 (44.1%) | 5,999 (55.9%) |
| Total (Overall) | 9,787 (48.8%) | 10,281 (51.2%) |
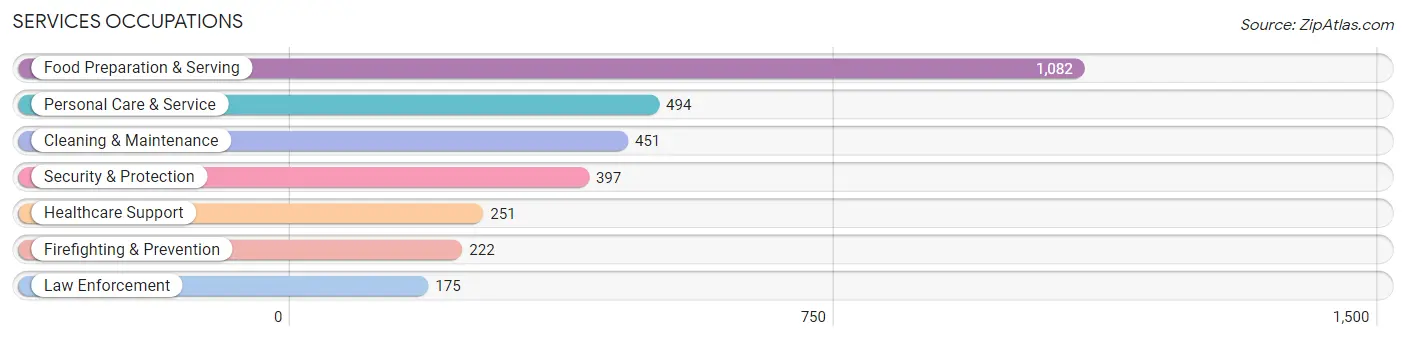
Services Occupations
The most common Services occupations in Woodstock are Food Preparation & Serving (1,082 | 5.4%), Personal Care & Service (494 | 2.5%), Cleaning & Maintenance (451 | 2.2%), Security & Protection (397 | 2.0%), and Healthcare Support (251 | 1.3%).
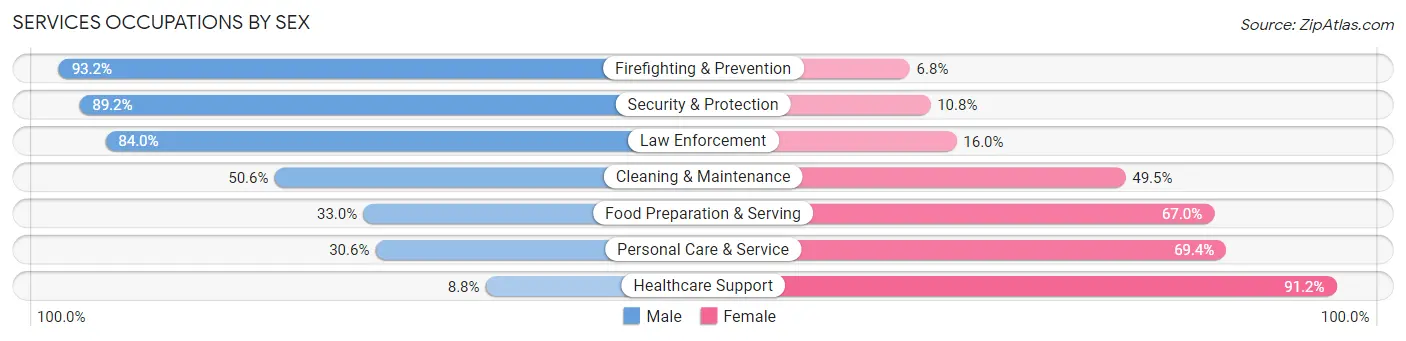
Services Occupations by Sex
Within the Services occupations in Woodstock, the most male-oriented occupations are Firefighting & Prevention (93.2%), Security & Protection (89.2%), and Law Enforcement (84.0%), while the most female-oriented occupations are Healthcare Support (91.2%), Personal Care & Service (69.4%), and Food Preparation & Serving (67.0%).
| Occupation | Male | Female |
| Healthcare Support | 22 (8.8%) | 229 (91.2%) |
| Security & Protection | 354 (89.2%) | 43 (10.8%) |
| Firefighting & Prevention | 207 (93.2%) | 15 (6.8%) |
| Law Enforcement | 147 (84.0%) | 28 (16.0%) |
| Food Preparation & Serving | 357 (33.0%) | 725 (67.0%) |
| Cleaning & Maintenance | 228 (50.5%) | 223 (49.4%) |
| Personal Care & Service | 151 (30.6%) | 343 (69.4%) |
| Total (Category) | 1,112 (41.6%) | 1,563 (58.4%) |
| Total (Overall) | 9,787 (48.8%) | 10,281 (51.2%) |
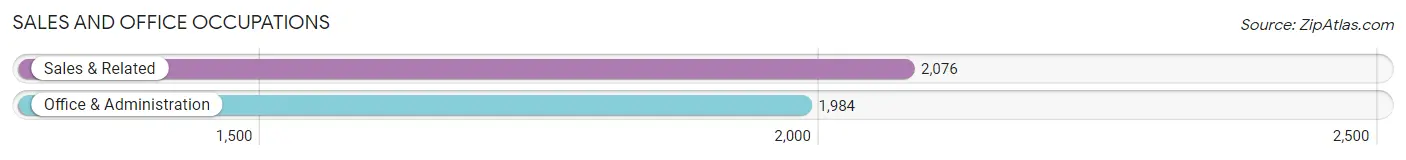
Sales and Office Occupations
The most common Sales and Office occupations in Woodstock are Sales & Related (2,076 | 10.3%), and Office & Administration (1,984 | 9.9%).
Sales and Office Occupations by Sex
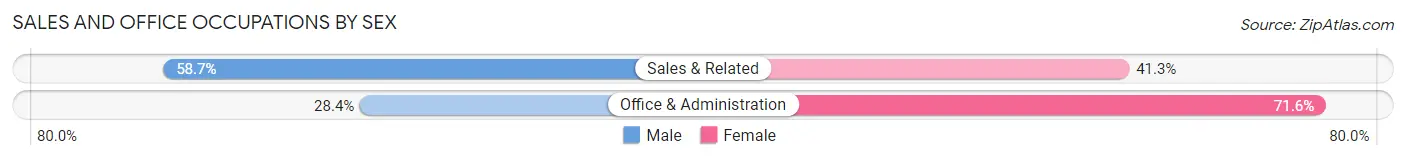
| Occupation | Male | Female |
| Sales & Related | 1,218 (58.7%) | 858 (41.3%) |
| Office & Administration | 563 (28.4%) | 1,421 (71.6%) |
| Total (Category) | 1,781 (43.9%) | 2,279 (56.1%) |
| Total (Overall) | 9,787 (48.8%) | 10,281 (51.2%) |
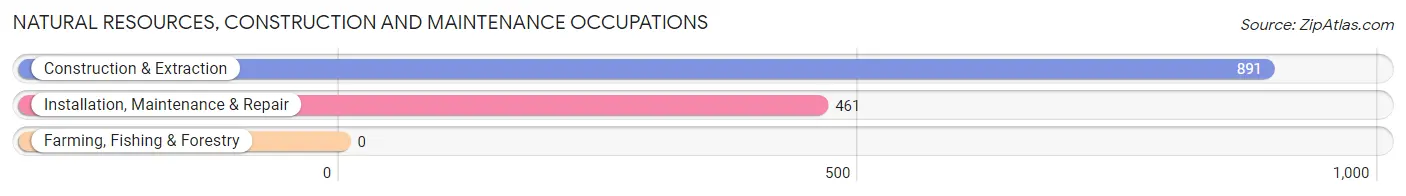
Natural Resources, Construction and Maintenance Occupations
The most common Natural Resources, Construction and Maintenance occupations in Woodstock are Construction & Extraction (891 | 4.4%), and Installation, Maintenance & Repair (461 | 2.3%).
Natural Resources, Construction and Maintenance Occupations by Sex
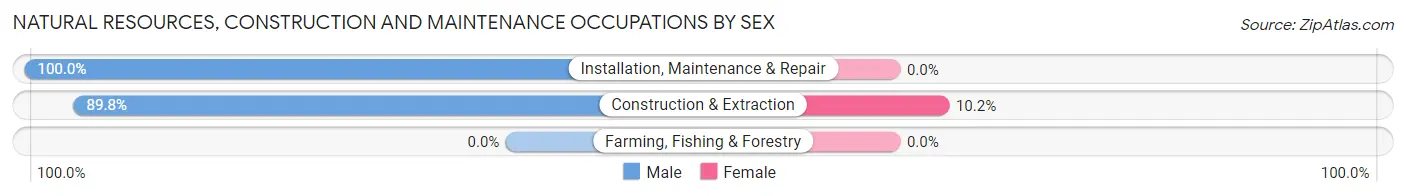
| Occupation | Male | Female |
| Farming, Fishing & Forestry | 0 (0.0%) | 0 (0.0%) |
| Construction & Extraction | 800 (89.8%) | 91 (10.2%) |
| Installation, Maintenance & Repair | 461 (100.0%) | 0 (0.0%) |
| Total (Category) | 1,261 (93.3%) | 91 (6.7%) |
| Total (Overall) | 9,787 (48.8%) | 10,281 (51.2%) |
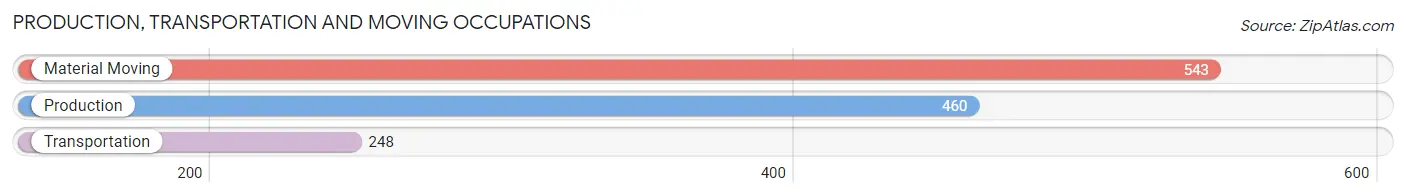
Production, Transportation and Moving Occupations
The most common Production, Transportation and Moving occupations in Woodstock are Material Moving (543 | 2.7%), Production (460 | 2.3%), and Transportation (248 | 1.2%).
Production, Transportation and Moving Occupations by Sex
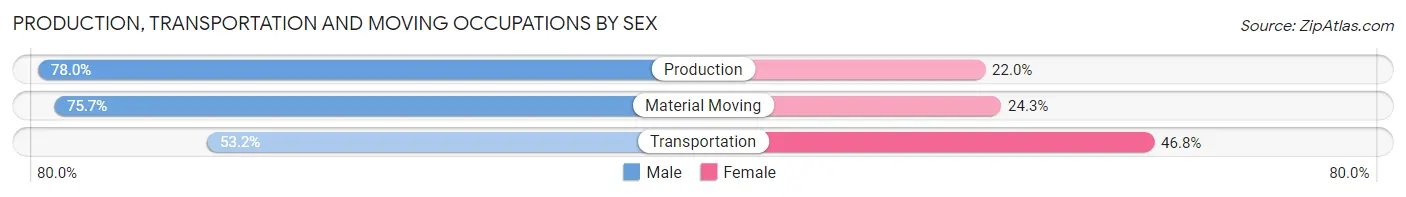
| Occupation | Male | Female |
| Production | 359 (78.0%) | 101 (22.0%) |
| Transportation | 132 (53.2%) | 116 (46.8%) |
| Material Moving | 411 (75.7%) | 132 (24.3%) |
| Total (Category) | 902 (72.1%) | 349 (27.9%) |
| Total (Overall) | 9,787 (48.8%) | 10,281 (51.2%) |
Employment Industries by Sex in Woodstock
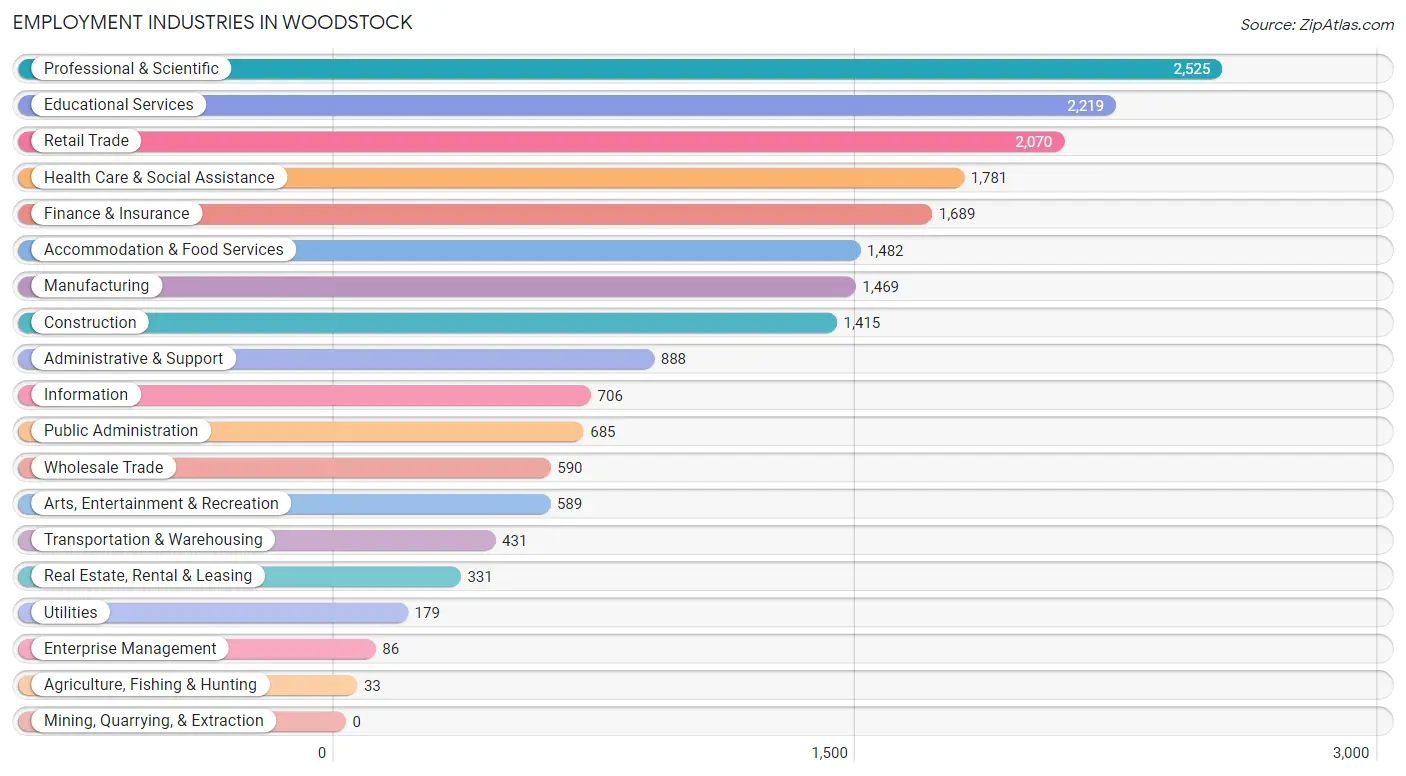
Employment Industries in Woodstock
The major employment industries in Woodstock include Professional & Scientific (2,525 | 12.6%), Educational Services (2,219 | 11.1%), Retail Trade (2,070 | 10.3%), Health Care & Social Assistance (1,781 | 8.9%), and Finance & Insurance (1,689 | 8.4%).
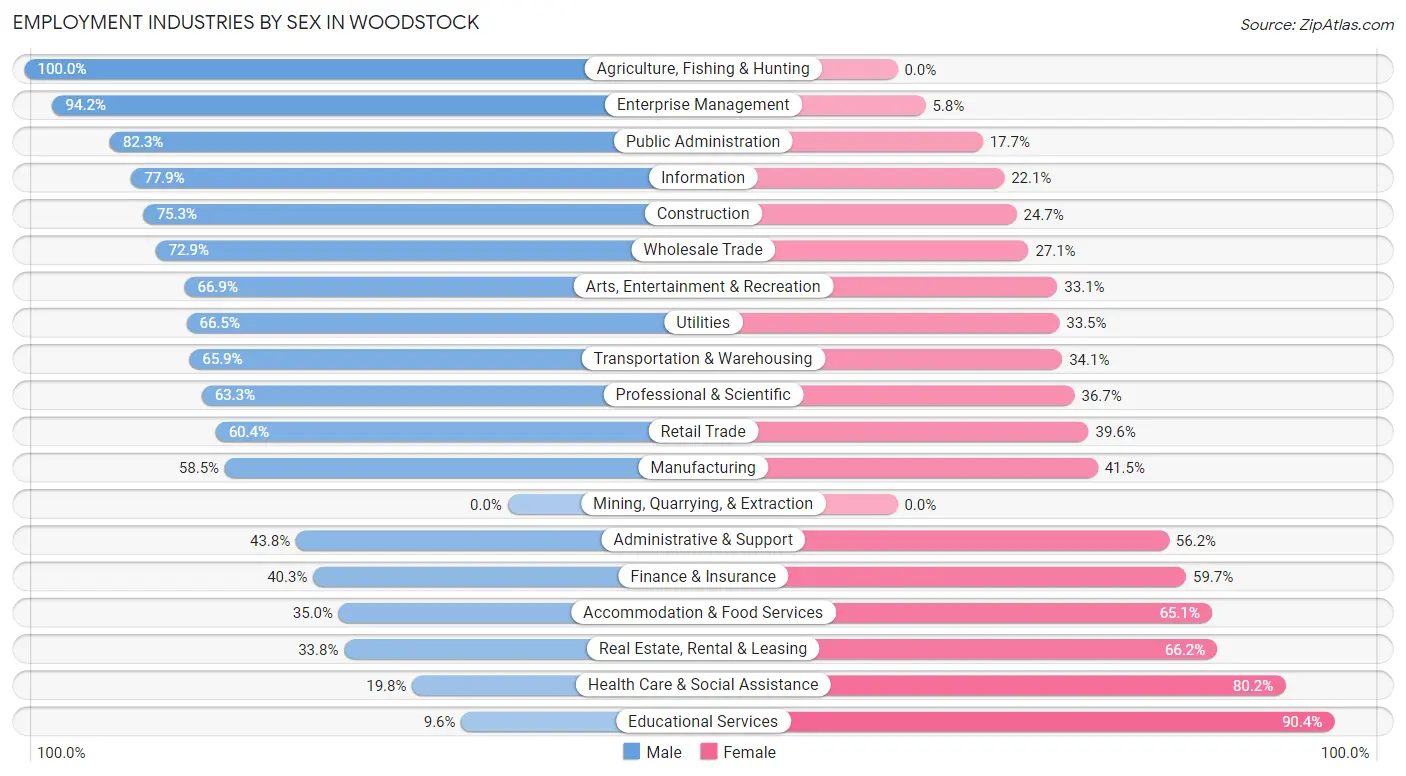
Employment Industries by Sex in Woodstock
The Woodstock industries that see more men than women are Agriculture, Fishing & Hunting (100.0%), Enterprise Management (94.2%), and Public Administration (82.3%), whereas the industries that tend to have a higher number of women are Educational Services (90.4%), Health Care & Social Assistance (80.2%), and Real Estate, Rental & Leasing (66.2%).
| Industry | Male | Female |
| Agriculture, Fishing & Hunting | 33 (100.0%) | 0 (0.0%) |
| Mining, Quarrying, & Extraction | 0 (0.0%) | 0 (0.0%) |
| Construction | 1,066 (75.3%) | 349 (24.7%) |
| Manufacturing | 860 (58.5%) | 609 (41.5%) |
| Wholesale Trade | 430 (72.9%) | 160 (27.1%) |
| Retail Trade | 1,251 (60.4%) | 819 (39.6%) |
| Transportation & Warehousing | 284 (65.9%) | 147 (34.1%) |
| Utilities | 119 (66.5%) | 60 (33.5%) |
| Information | 550 (77.9%) | 156 (22.1%) |
| Finance & Insurance | 680 (40.3%) | 1,009 (59.7%) |
| Real Estate, Rental & Leasing | 112 (33.8%) | 219 (66.2%) |
| Professional & Scientific | 1,599 (63.3%) | 926 (36.7%) |
| Enterprise Management | 81 (94.2%) | 5 (5.8%) |
| Administrative & Support | 389 (43.8%) | 499 (56.2%) |
| Educational Services | 213 (9.6%) | 2,006 (90.4%) |
| Health Care & Social Assistance | 352 (19.8%) | 1,429 (80.2%) |
| Arts, Entertainment & Recreation | 394 (66.9%) | 195 (33.1%) |
| Accommodation & Food Services | 518 (34.9%) | 964 (65.0%) |
| Public Administration | 564 (82.3%) | 121 (17.7%) |
| Total | 9,787 (48.8%) | 10,281 (51.2%) |
Education in Woodstock
School Enrollment in Woodstock
The most common levels of schooling among the 9,656 students in Woodstock are high school (2,047 | 21.2%), elementary school (2,026 | 21.0%), and middle school (1,950 | 20.2%).
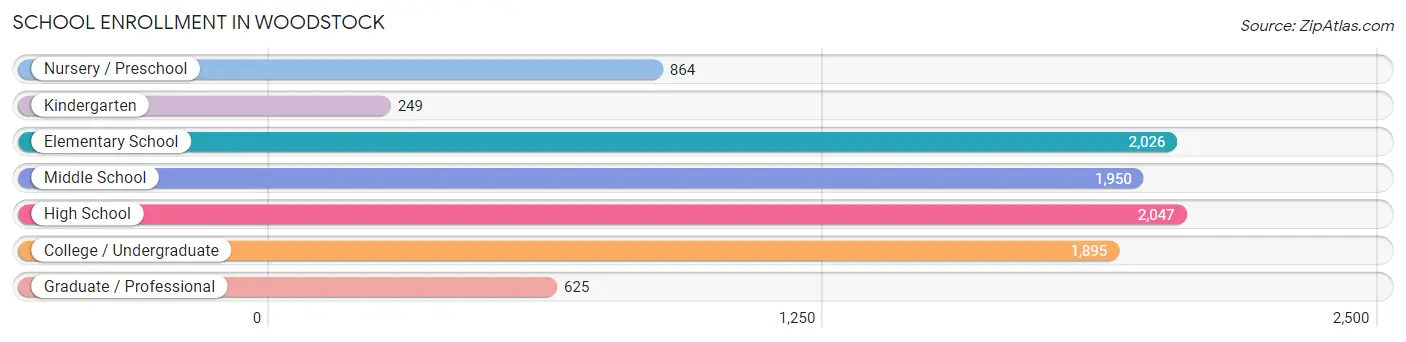
| School Level | # Students | % Students |
| Nursery / Preschool | 864 | 8.9% |
| Kindergarten | 249 | 2.6% |
| Elementary School | 2,026 | 21.0% |
| Middle School | 1,950 | 20.2% |
| High School | 2,047 | 21.2% |
| College / Undergraduate | 1,895 | 19.6% |
| Graduate / Professional | 625 | 6.5% |
| Total | 9,656 | 100.0% |
School Enrollment by Age by Funding Source in Woodstock
Out of a total of 9,656 students who are enrolled in schools in Woodstock, 1,970 (20.4%) attend a private institution, while the remaining 7,686 (79.6%) are enrolled in public schools. The age group of 3 to 4 year olds has the highest likelihood of being enrolled in private schools, with 486 (58.6% in the age bracket) enrolled. Conversely, the age group of 18 to 19 year olds has the lowest likelihood of being enrolled in a private school, with 500 (95.4% in the age bracket) attending a public institution.
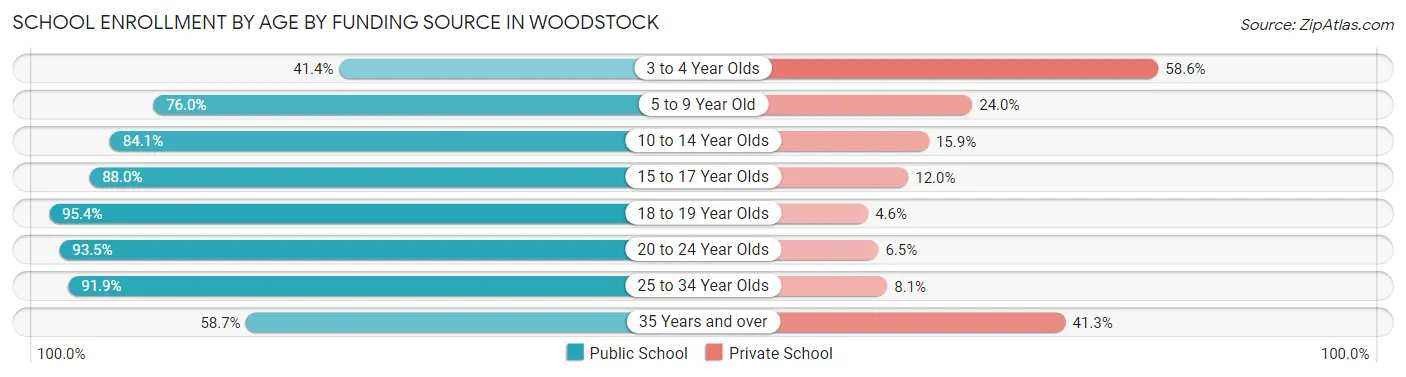
| Age Bracket | Public School | Private School |
| 3 to 4 Year Olds | 343 (41.4%) | 486 (58.6%) |
| 5 to 9 Year Old | 1,476 (76.0%) | 465 (24.0%) |
| 10 to 14 Year Olds | 2,175 (84.1%) | 411 (15.9%) |
| 15 to 17 Year Olds | 1,278 (88.0%) | 175 (12.0%) |
| 18 to 19 Year Olds | 500 (95.4%) | 24 (4.6%) |
| 20 to 24 Year Olds | 923 (93.5%) | 64 (6.5%) |
| 25 to 34 Year Olds | 587 (91.9%) | 52 (8.1%) |
| 35 Years and over | 409 (58.7%) | 288 (41.3%) |
| Total | 7,686 (79.6%) | 1,970 (20.4%) |
Educational Attainment by Field of Study in Woodstock
Business (3,424 | 26.3%), education (1,602 | 12.3%), science & technology (1,092 | 8.4%), bio, nature & agricultural (853 | 6.6%), and communications (851 | 6.5%) are the most common fields of study among 13,026 individuals in Woodstock who have obtained a bachelor's degree or higher.
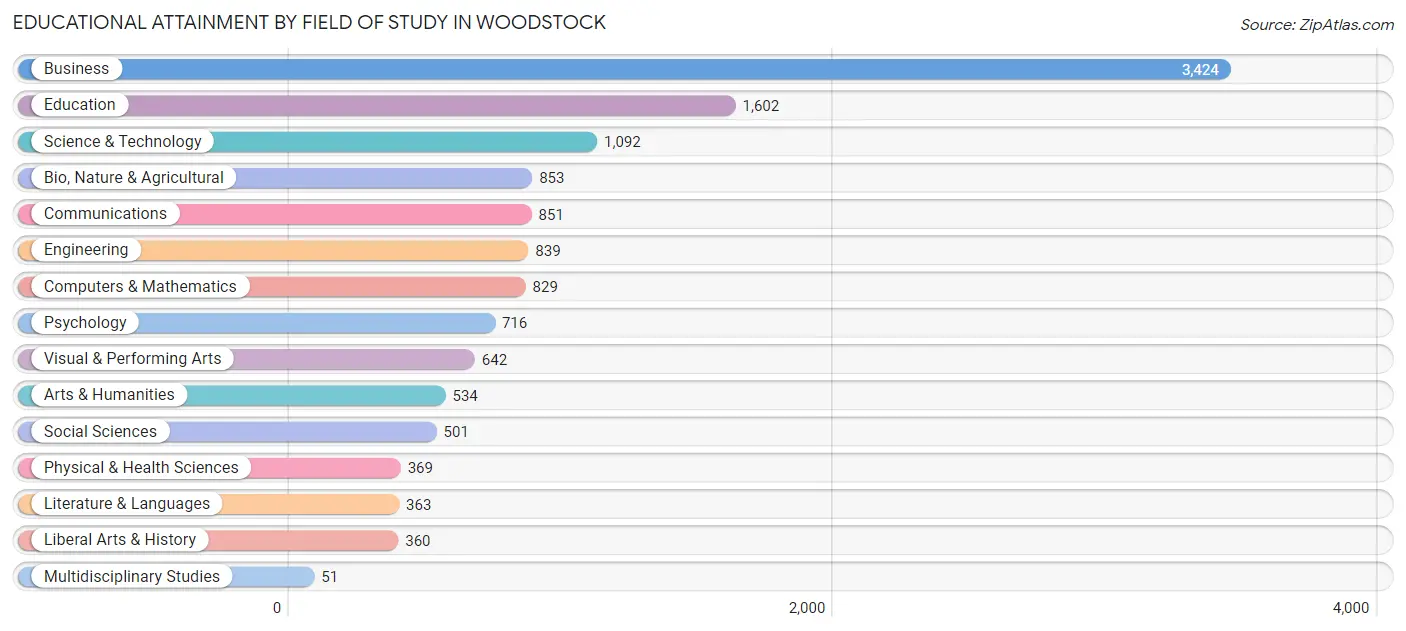
| Field of Study | # Graduates | % Graduates |
| Computers & Mathematics | 829 | 6.4% |
| Bio, Nature & Agricultural | 853 | 6.6% |
| Physical & Health Sciences | 369 | 2.8% |
| Psychology | 716 | 5.5% |
| Social Sciences | 501 | 3.8% |
| Engineering | 839 | 6.4% |
| Multidisciplinary Studies | 51 | 0.4% |
| Science & Technology | 1,092 | 8.4% |
| Business | 3,424 | 26.3% |
| Education | 1,602 | 12.3% |
| Literature & Languages | 363 | 2.8% |
| Liberal Arts & History | 360 | 2.8% |
| Visual & Performing Arts | 642 | 4.9% |
| Communications | 851 | 6.5% |
| Arts & Humanities | 534 | 4.1% |
| Total | 13,026 | 100.0% |
Transportation & Commute in Woodstock
Vehicle Availability by Sex in Woodstock
The most prevalent vehicle ownership categories in Woodstock are males with 2 vehicles (4,942, accounting for 51.0%) and females with 2 vehicles (4,732, making up 48.3%).
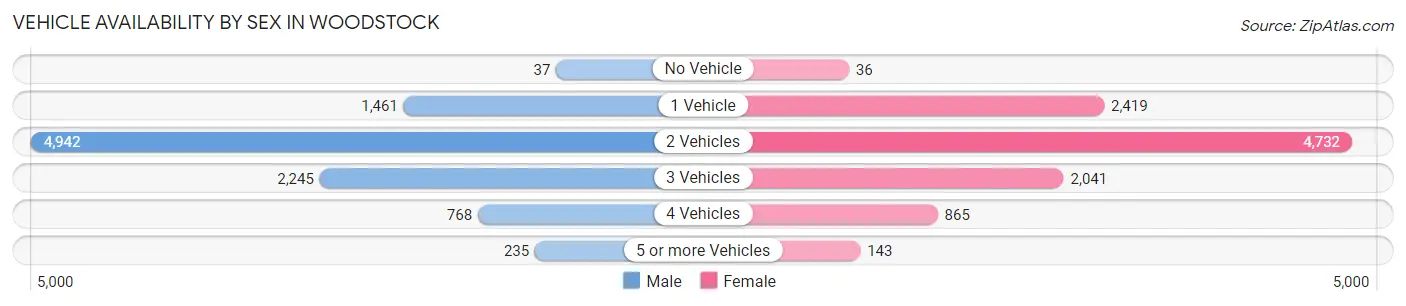
| Vehicles Available | Male | Female |
| No Vehicle | 37 (0.4%) | 36 (0.4%) |
| 1 Vehicle | 1,461 (15.1%) | 2,419 (23.6%) |
| 2 Vehicles | 4,942 (51.0%) | 4,732 (46.2%) |
| 3 Vehicles | 2,245 (23.2%) | 2,041 (19.9%) |
| 4 Vehicles | 768 (7.9%) | 865 (8.5%) |
| 5 or more Vehicles | 235 (2.4%) | 143 (1.4%) |
| Total | 9,688 (100.0%) | 10,236 (100.0%) |
Commute Time in Woodstock
The most frequently occuring commute durations in Woodstock are 15 to 19 minutes (2,427 commuters, 15.3%), 30 to 34 minutes (2,282 commuters, 14.4%), and 45 to 59 minutes (1,962 commuters, 12.4%).
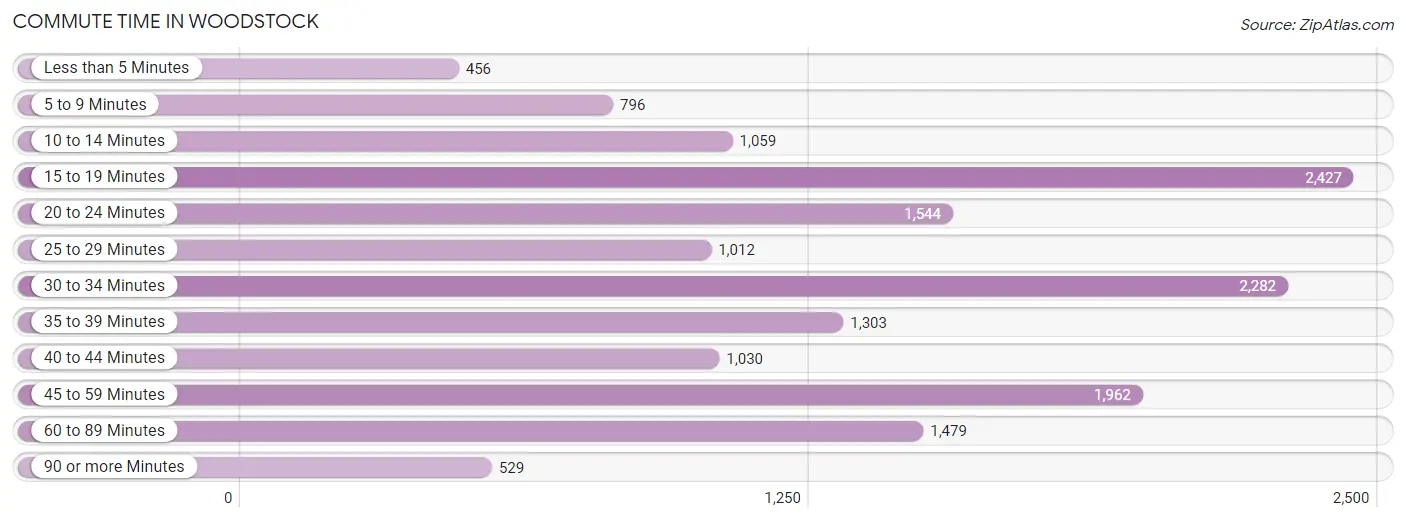
| Commute Time | # Commuters | % Commuters |
| Less than 5 Minutes | 456 | 2.9% |
| 5 to 9 Minutes | 796 | 5.0% |
| 10 to 14 Minutes | 1,059 | 6.7% |
| 15 to 19 Minutes | 2,427 | 15.3% |
| 20 to 24 Minutes | 1,544 | 9.7% |
| 25 to 29 Minutes | 1,012 | 6.4% |
| 30 to 34 Minutes | 2,282 | 14.4% |
| 35 to 39 Minutes | 1,303 | 8.2% |
| 40 to 44 Minutes | 1,030 | 6.5% |
| 45 to 59 Minutes | 1,962 | 12.4% |
| 60 to 89 Minutes | 1,479 | 9.3% |
| 90 or more Minutes | 529 | 3.3% |
Commute Time by Sex in Woodstock
The most common commute times in Woodstock are 45 to 59 minutes (1,202 commuters, 15.8%) for males and 30 to 34 minutes (1,337 commuters, 16.2%) for females.
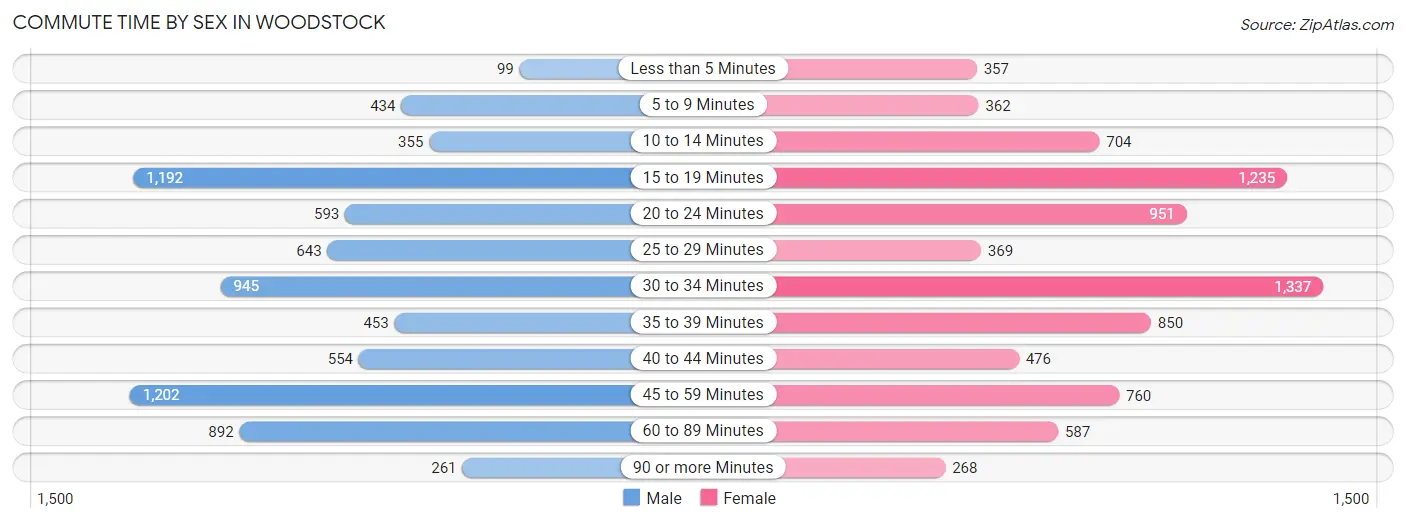
| Commute Time | Male | Female |
| Less than 5 Minutes | 99 (1.3%) | 357 (4.3%) |
| 5 to 9 Minutes | 434 (5.7%) | 362 (4.4%) |
| 10 to 14 Minutes | 355 (4.7%) | 704 (8.5%) |
| 15 to 19 Minutes | 1,192 (15.6%) | 1,235 (15.0%) |
| 20 to 24 Minutes | 593 (7.8%) | 951 (11.5%) |
| 25 to 29 Minutes | 643 (8.4%) | 369 (4.5%) |
| 30 to 34 Minutes | 945 (12.4%) | 1,337 (16.2%) |
| 35 to 39 Minutes | 453 (5.9%) | 850 (10.3%) |
| 40 to 44 Minutes | 554 (7.3%) | 476 (5.8%) |
| 45 to 59 Minutes | 1,202 (15.8%) | 760 (9.2%) |
| 60 to 89 Minutes | 892 (11.7%) | 587 (7.1%) |
| 90 or more Minutes | 261 (3.4%) | 268 (3.3%) |
Time of Departure to Work by Sex in Woodstock
The most frequent times of departure to work in Woodstock are 7:00 AM to 7:29 AM (1,865, 24.5%) for males and 6:30 AM to 6:59 AM (1,435, 17.4%) for females.
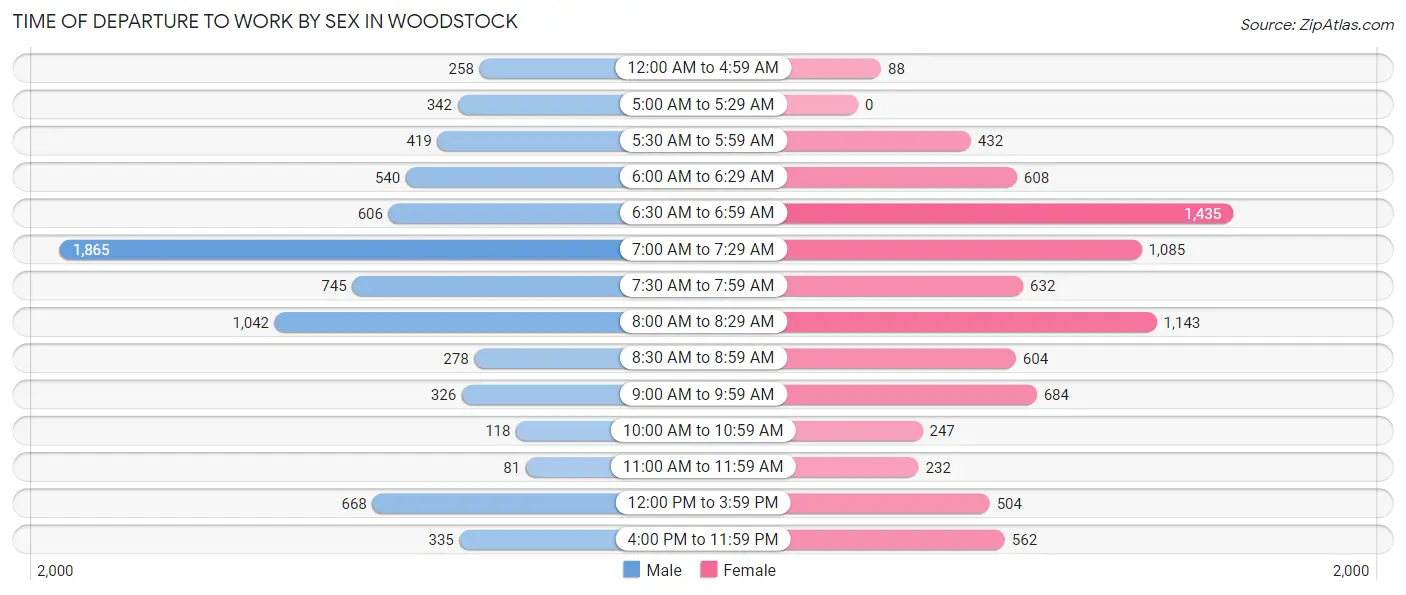
| Time of Departure | Male | Female |
| 12:00 AM to 4:59 AM | 258 (3.4%) | 88 (1.1%) |
| 5:00 AM to 5:29 AM | 342 (4.5%) | 0 (0.0%) |
| 5:30 AM to 5:59 AM | 419 (5.5%) | 432 (5.2%) |
| 6:00 AM to 6:29 AM | 540 (7.1%) | 608 (7.4%) |
| 6:30 AM to 6:59 AM | 606 (8.0%) | 1,435 (17.4%) |
| 7:00 AM to 7:29 AM | 1,865 (24.5%) | 1,085 (13.1%) |
| 7:30 AM to 7:59 AM | 745 (9.8%) | 632 (7.7%) |
| 8:00 AM to 8:29 AM | 1,042 (13.7%) | 1,143 (13.8%) |
| 8:30 AM to 8:59 AM | 278 (3.6%) | 604 (7.3%) |
| 9:00 AM to 9:59 AM | 326 (4.3%) | 684 (8.3%) |
| 10:00 AM to 10:59 AM | 118 (1.5%) | 247 (3.0%) |
| 11:00 AM to 11:59 AM | 81 (1.1%) | 232 (2.8%) |
| 12:00 PM to 3:59 PM | 668 (8.8%) | 504 (6.1%) |
| 4:00 PM to 11:59 PM | 335 (4.4%) | 562 (6.8%) |
| Total | 7,623 (100.0%) | 8,256 (100.0%) |
Housing Occupancy in Woodstock
Occupancy by Ownership in Woodstock
Of the total 13,640 dwellings in Woodstock, owner-occupied units account for 8,898 (65.2%), while renter-occupied units make up 4,742 (34.8%).
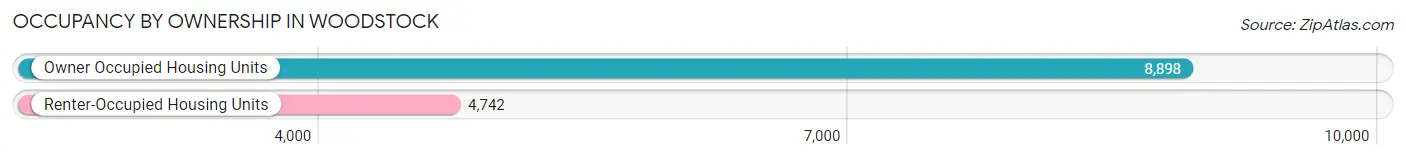
| Occupancy | # Housing Units | % Housing Units |
| Owner Occupied Housing Units | 8,898 | 65.2% |
| Renter-Occupied Housing Units | 4,742 | 34.8% |
| Total Occupied Housing Units | 13,640 | 100.0% |
Occupancy by Household Size in Woodstock
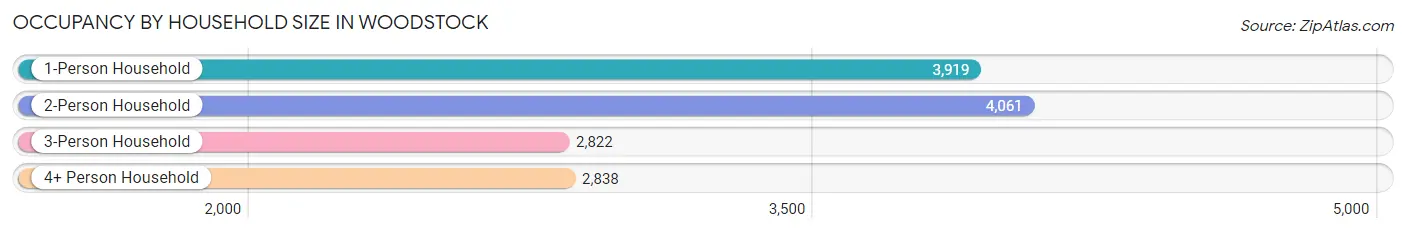
| Household Size | # Housing Units | % Housing Units |
| 1-Person Household | 3,919 | 28.7% |
| 2-Person Household | 4,061 | 29.8% |
| 3-Person Household | 2,822 | 20.7% |
| 4+ Person Household | 2,838 | 20.8% |
| Total Housing Units | 13,640 | 100.0% |
Occupancy by Ownership by Household Size in Woodstock
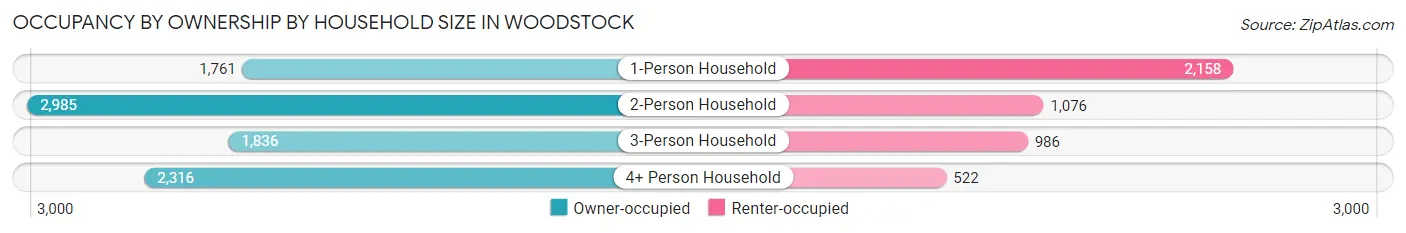
| Household Size | Owner-occupied | Renter-occupied |
| 1-Person Household | 1,761 (44.9%) | 2,158 (55.1%) |
| 2-Person Household | 2,985 (73.5%) | 1,076 (26.5%) |
| 3-Person Household | 1,836 (65.1%) | 986 (34.9%) |
| 4+ Person Household | 2,316 (81.6%) | 522 (18.4%) |
| Total Housing Units | 8,898 (65.2%) | 4,742 (34.8%) |
Occupancy by Educational Attainment in Woodstock
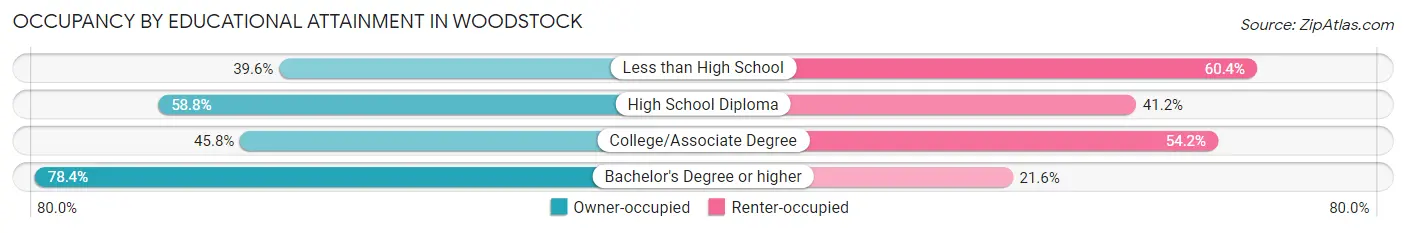
| Household Size | Owner-occupied | Renter-occupied |
| Less than High School | 103 (39.6%) | 157 (60.4%) |
| High School Diploma | 1,022 (58.8%) | 716 (41.2%) |
| College/Associate Degree | 1,900 (45.8%) | 2,248 (54.2%) |
| Bachelor's Degree or higher | 5,873 (78.4%) | 1,621 (21.6%) |
Occupancy by Age of Householder in Woodstock
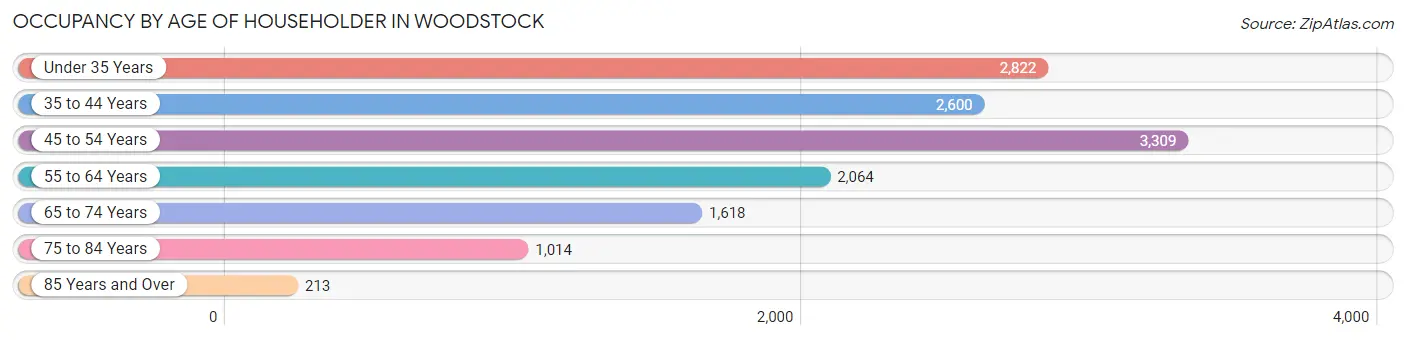
| Age Bracket | # Households | % Households |
| Under 35 Years | 2,822 | 20.7% |
| 35 to 44 Years | 2,600 | 19.1% |
| 45 to 54 Years | 3,309 | 24.3% |
| 55 to 64 Years | 2,064 | 15.1% |
| 65 to 74 Years | 1,618 | 11.9% |
| 75 to 84 Years | 1,014 | 7.4% |
| 85 Years and Over | 213 | 1.6% |
| Total | 13,640 | 100.0% |
Housing Finances in Woodstock
Median Income by Occupancy in Woodstock
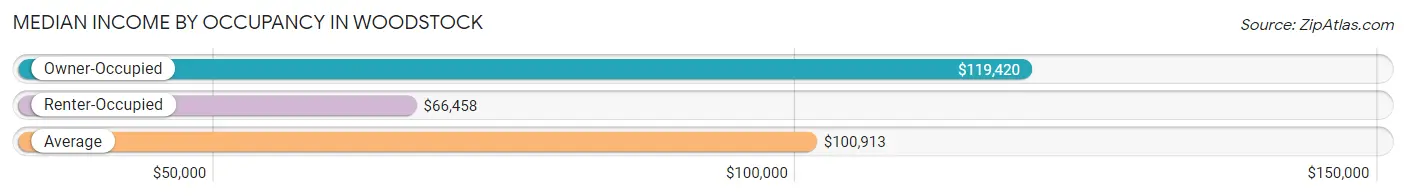
| Occupancy Type | # Households | Median Income |
| Owner-Occupied | 8,898 (65.2%) | $119,420 |
| Renter-Occupied | 4,742 (34.8%) | $66,458 |
| Average | 13,640 (100.0%) | $100,913 |
Occupancy by Householder Income Bracket in Woodstock
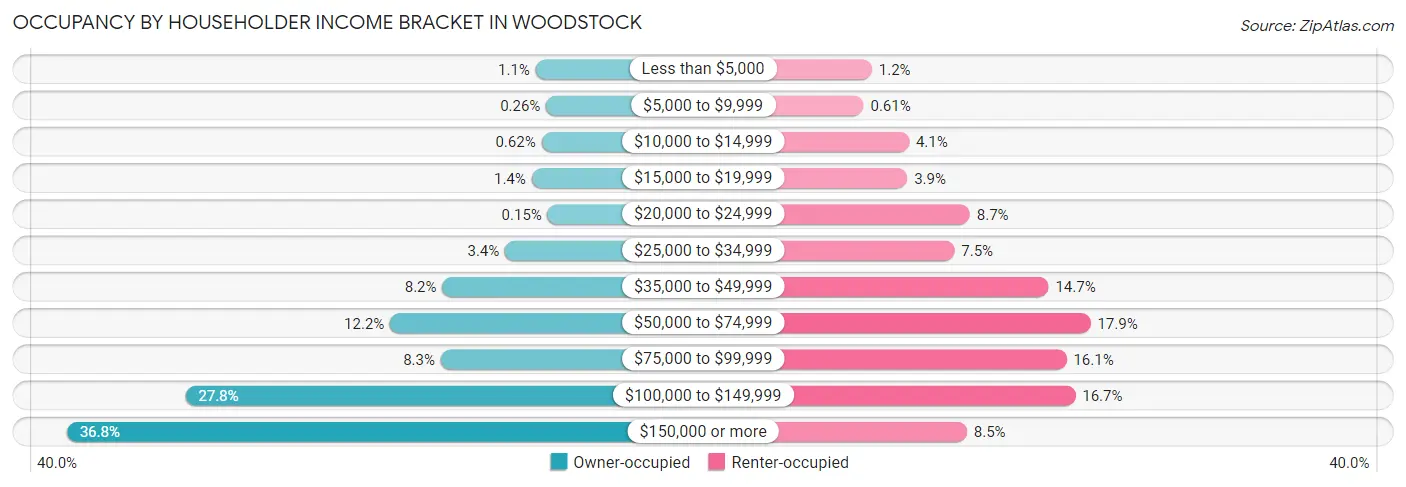
| Income Bracket | Owner-occupied | Renter-occupied |
| Less than $5,000 | 94 (1.1%) | 59 (1.2%) |
| $5,000 to $9,999 | 23 (0.3%) | 29 (0.6%) |
| $10,000 to $14,999 | 55 (0.6%) | 193 (4.1%) |
| $15,000 to $19,999 | 122 (1.4%) | 187 (3.9%) |
| $20,000 to $24,999 | 13 (0.2%) | 413 (8.7%) |
| $25,000 to $34,999 | 302 (3.4%) | 357 (7.5%) |
| $35,000 to $49,999 | 727 (8.2%) | 697 (14.7%) |
| $50,000 to $74,999 | 1,081 (12.1%) | 849 (17.9%) |
| $75,000 to $99,999 | 738 (8.3%) | 762 (16.1%) |
| $100,000 to $149,999 | 2,469 (27.8%) | 794 (16.7%) |
| $150,000 or more | 3,274 (36.8%) | 402 (8.5%) |
| Total | 8,898 (100.0%) | 4,742 (100.0%) |
Monthly Housing Cost Tiers in Woodstock
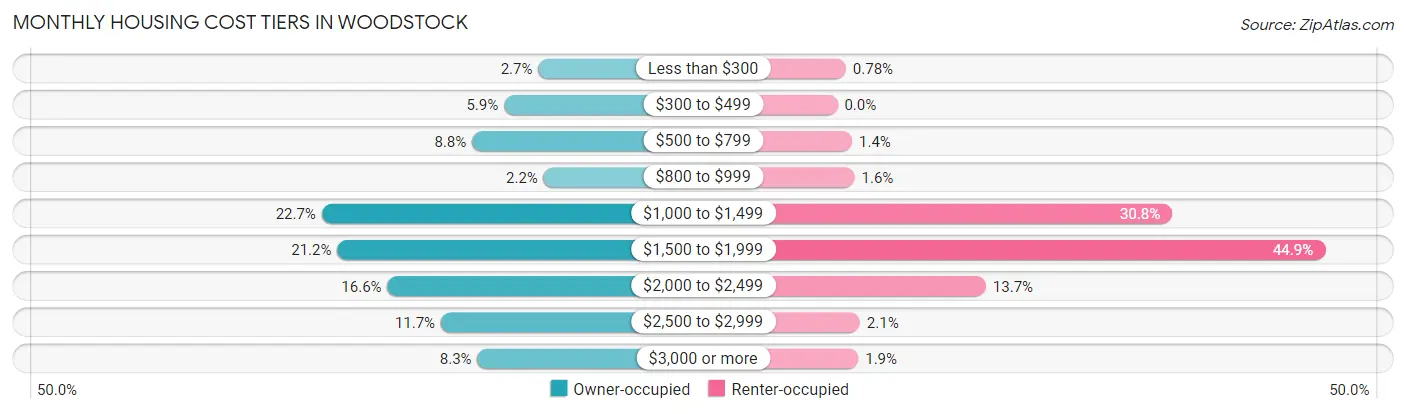
| Monthly Cost | Owner-occupied | Renter-occupied |
| Less than $300 | 241 (2.7%) | 37 (0.8%) |
| $300 to $499 | 521 (5.9%) | 0 (0.0%) |
| $500 to $799 | 783 (8.8%) | 64 (1.3%) |
| $800 to $999 | 197 (2.2%) | 75 (1.6%) |
| $1,000 to $1,499 | 2,015 (22.7%) | 1,461 (30.8%) |
| $1,500 to $1,999 | 1,887 (21.2%) | 2,128 (44.9%) |
| $2,000 to $2,499 | 1,477 (16.6%) | 648 (13.7%) |
| $2,500 to $2,999 | 1,038 (11.7%) | 98 (2.1%) |
| $3,000 or more | 739 (8.3%) | 91 (1.9%) |
| Total | 8,898 (100.0%) | 4,742 (100.0%) |
Physical Housing Characteristics in Woodstock
Housing Structures in Woodstock
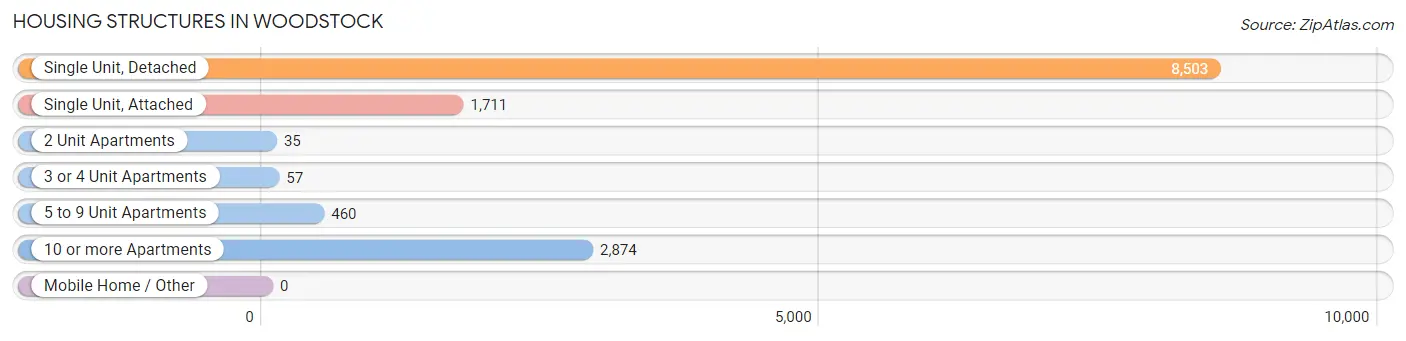
| Structure Type | # Housing Units | % Housing Units |
| Single Unit, Detached | 8,503 | 62.3% |
| Single Unit, Attached | 1,711 | 12.5% |
| 2 Unit Apartments | 35 | 0.3% |
| 3 or 4 Unit Apartments | 57 | 0.4% |
| 5 to 9 Unit Apartments | 460 | 3.4% |
| 10 or more Apartments | 2,874 | 21.1% |
| Mobile Home / Other | 0 | 0.0% |
| Total | 13,640 | 100.0% |
Housing Structures by Occupancy in Woodstock
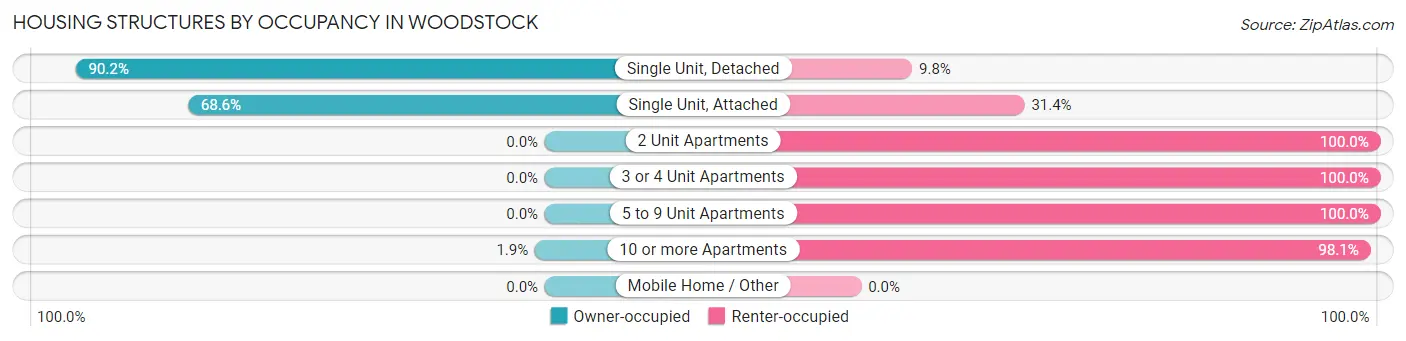
| Structure Type | Owner-occupied | Renter-occupied |
| Single Unit, Detached | 7,670 (90.2%) | 833 (9.8%) |
| Single Unit, Attached | 1,173 (68.6%) | 538 (31.4%) |
| 2 Unit Apartments | 0 (0.0%) | 35 (100.0%) |
| 3 or 4 Unit Apartments | 0 (0.0%) | 57 (100.0%) |
| 5 to 9 Unit Apartments | 0 (0.0%) | 460 (100.0%) |
| 10 or more Apartments | 55 (1.9%) | 2,819 (98.1%) |
| Mobile Home / Other | 0 (0.0%) | 0 (0.0%) |
| Total | 8,898 (65.2%) | 4,742 (34.8%) |
Housing Structures by Number of Rooms in Woodstock
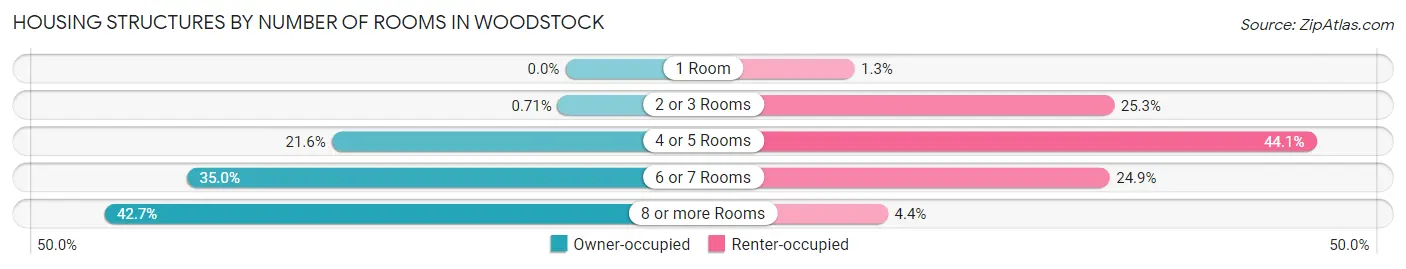
| Number of Rooms | Owner-occupied | Renter-occupied |
| 1 Room | 0 (0.0%) | 62 (1.3%) |
| 2 or 3 Rooms | 63 (0.7%) | 1,201 (25.3%) |
| 4 or 5 Rooms | 1,923 (21.6%) | 2,089 (44.1%) |
| 6 or 7 Rooms | 3,116 (35.0%) | 1,181 (24.9%) |
| 8 or more Rooms | 3,796 (42.7%) | 209 (4.4%) |
| Total | 8,898 (100.0%) | 4,742 (100.0%) |
Housing Structure by Heating Type in Woodstock
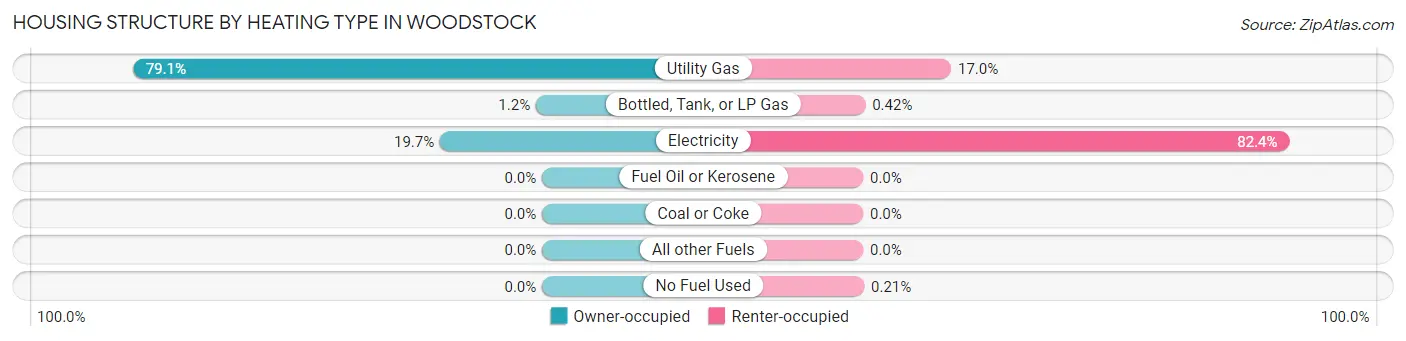
| Heating Type | Owner-occupied | Renter-occupied |
| Utility Gas | 7,038 (79.1%) | 806 (17.0%) |
| Bottled, Tank, or LP Gas | 105 (1.2%) | 20 (0.4%) |
| Electricity | 1,755 (19.7%) | 3,906 (82.4%) |
| Fuel Oil or Kerosene | 0 (0.0%) | 0 (0.0%) |
| Coal or Coke | 0 (0.0%) | 0 (0.0%) |
| All other Fuels | 0 (0.0%) | 0 (0.0%) |
| No Fuel Used | 0 (0.0%) | 10 (0.2%) |
| Total | 8,898 (100.0%) | 4,742 (100.0%) |
Household Vehicle Usage in Woodstock
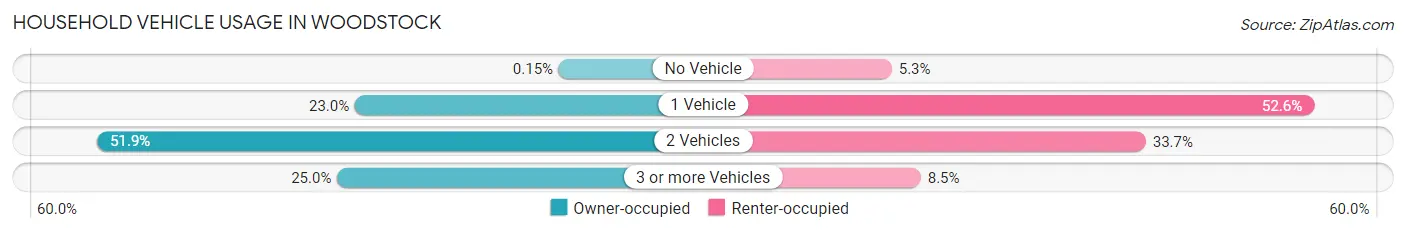
| Vehicles per Household | Owner-occupied | Renter-occupied |
| No Vehicle | 13 (0.2%) | 249 (5.2%) |
| 1 Vehicle | 2,045 (23.0%) | 2,492 (52.5%) |
| 2 Vehicles | 4,617 (51.9%) | 1,598 (33.7%) |
| 3 or more Vehicles | 2,223 (25.0%) | 403 (8.5%) |
| Total | 8,898 (100.0%) | 4,742 (100.0%) |
Real Estate & Mortgages in Woodstock
Real Estate and Mortgage Overview in Woodstock
| Characteristic | Without Mortgage | With Mortgage |
| Housing Units | 1,465 | 7,433 |
| Median Property Value | $318,800 | $371,000 |
| Median Household Income | $94,539 | $2,902 |
| Monthly Housing Costs | $490 | $719 |
| Real Estate Taxes | $1,745 | $82 |
Property Value by Mortgage Status in Woodstock
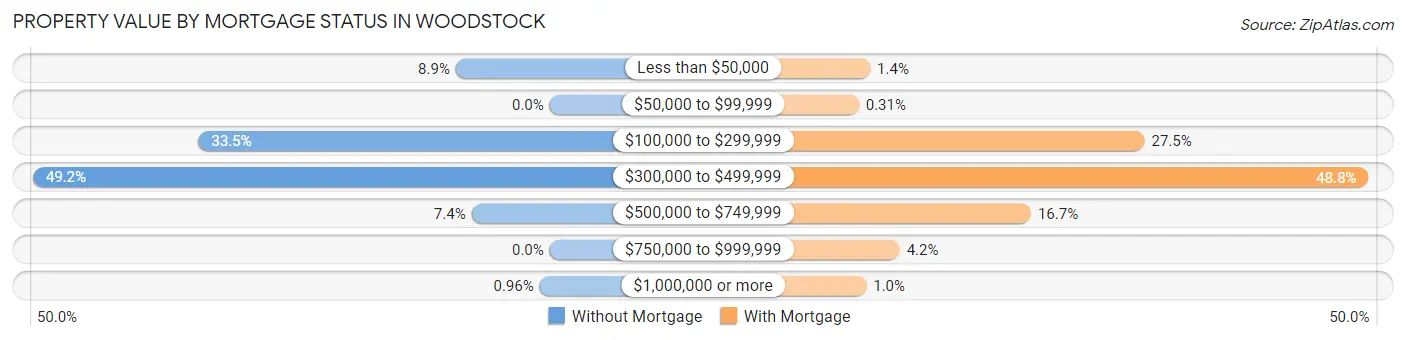
| Property Value | Without Mortgage | With Mortgage |
| Less than $50,000 | 131 (8.9%) | 103 (1.4%) |
| $50,000 to $99,999 | 0 (0.0%) | 23 (0.3%) |
| $100,000 to $299,999 | 490 (33.5%) | 2,046 (27.5%) |
| $300,000 to $499,999 | 721 (49.2%) | 3,630 (48.8%) |
| $500,000 to $749,999 | 109 (7.4%) | 1,242 (16.7%) |
| $750,000 to $999,999 | 0 (0.0%) | 313 (4.2%) |
| $1,000,000 or more | 14 (1.0%) | 76 (1.0%) |
| Total | 1,465 (100.0%) | 7,433 (100.0%) |
Household Income by Mortgage Status in Woodstock
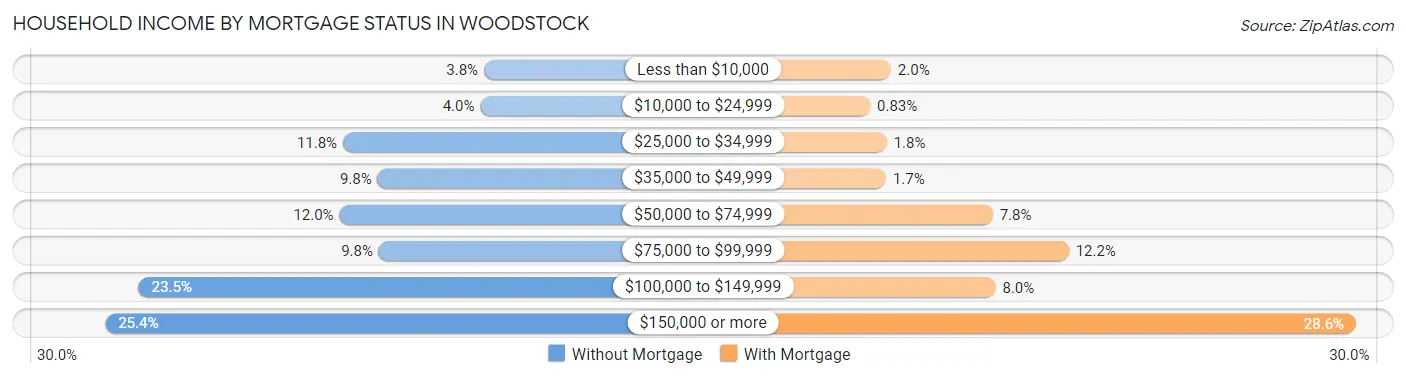
| Household Income | Without Mortgage | With Mortgage |
| Less than $10,000 | 55 (3.7%) | 150 (2.0%) |
| $10,000 to $24,999 | 58 (4.0%) | 62 (0.8%) |
| $25,000 to $34,999 | 173 (11.8%) | 132 (1.8%) |
| $35,000 to $49,999 | 144 (9.8%) | 129 (1.7%) |
| $50,000 to $74,999 | 176 (12.0%) | 583 (7.8%) |
| $75,000 to $99,999 | 143 (9.8%) | 905 (12.2%) |
| $100,000 to $149,999 | 344 (23.5%) | 595 (8.0%) |
| $150,000 or more | 372 (25.4%) | 2,125 (28.6%) |
| Total | 1,465 (100.0%) | 7,433 (100.0%) |
Property Value to Household Income Ratio in Woodstock
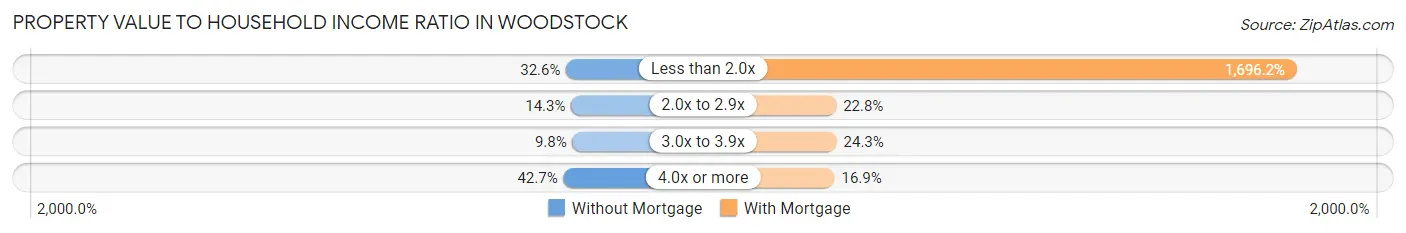
| Value-to-Income Ratio | Without Mortgage | With Mortgage |
| Less than 2.0x | 477 (32.6%) | 126,081 (1,696.2%) |
| 2.0x to 2.9x | 209 (14.3%) | 1,697 (22.8%) |
| 3.0x to 3.9x | 144 (9.8%) | 1,806 (24.3%) |
| 4.0x or more | 625 (42.7%) | 1,258 (16.9%) |
| Total | 1,465 (100.0%) | 7,433 (100.0%) |
Real Estate Taxes by Mortgage Status in Woodstock
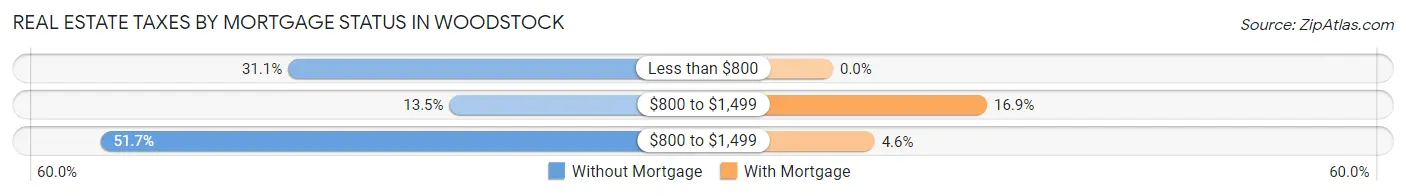
| Property Taxes | Without Mortgage | With Mortgage |
| Less than $800 | 456 (31.1%) | 0 (0.0%) |
| $800 to $1,499 | 197 (13.5%) | 1,255 (16.9%) |
| $800 to $1,499 | 757 (51.7%) | 340 (4.6%) |
| Total | 1,465 (100.0%) | 7,433 (100.0%) |
Health & Disability in Woodstock
Health Insurance Coverage by Age in Woodstock
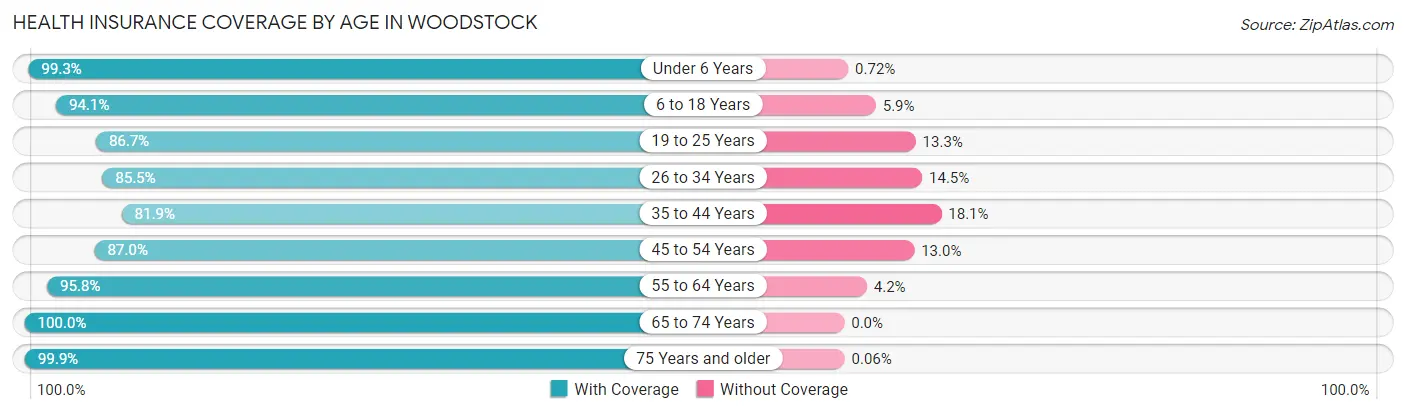
| Age Bracket | With Coverage | Without Coverage |
| Under 6 Years | 2,749 (99.3%) | 20 (0.7%) |
| 6 to 18 Years | 5,870 (94.1%) | 366 (5.9%) |
| 19 to 25 Years | 2,592 (86.7%) | 398 (13.3%) |
| 26 to 34 Years | 4,155 (85.5%) | 705 (14.5%) |
| 35 to 44 Years | 4,258 (81.9%) | 941 (18.1%) |
| 45 to 54 Years | 4,787 (87.0%) | 718 (13.0%) |
| 55 to 64 Years | 3,127 (95.8%) | 137 (4.2%) |
| 65 to 74 Years | 2,438 (100.0%) | 0 (0.0%) |
| 75 Years and older | 1,670 (99.9%) | 1 (0.1%) |
| Total | 31,646 (90.6%) | 3,286 (9.4%) |
Health Insurance Coverage by Citizenship Status in Woodstock
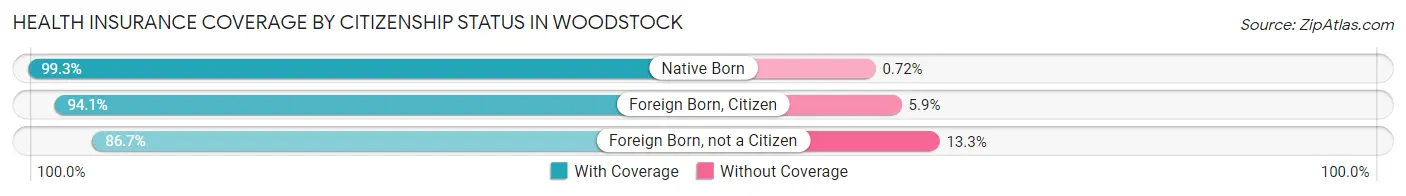
| Citizenship Status | With Coverage | Without Coverage |
| Native Born | 2,749 (99.3%) | 20 (0.7%) |
| Foreign Born, Citizen | 5,870 (94.1%) | 366 (5.9%) |
| Foreign Born, not a Citizen | 2,592 (86.7%) | 398 (13.3%) |
Health Insurance Coverage by Household Income in Woodstock
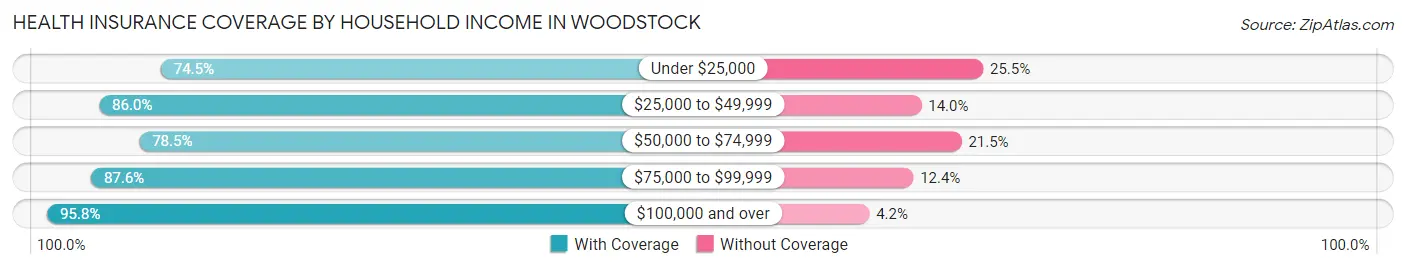
| Household Income | With Coverage | Without Coverage |
| Under $25,000 | 1,514 (74.5%) | 519 (25.5%) |
| $25,000 to $49,999 | 2,989 (86.0%) | 485 (14.0%) |
| $50,000 to $74,999 | 3,261 (78.5%) | 892 (21.5%) |
| $75,000 to $99,999 | 3,421 (87.6%) | 486 (12.4%) |
| $100,000 and over | 20,419 (95.8%) | 895 (4.2%) |
Public vs Private Health Insurance Coverage by Age in Woodstock
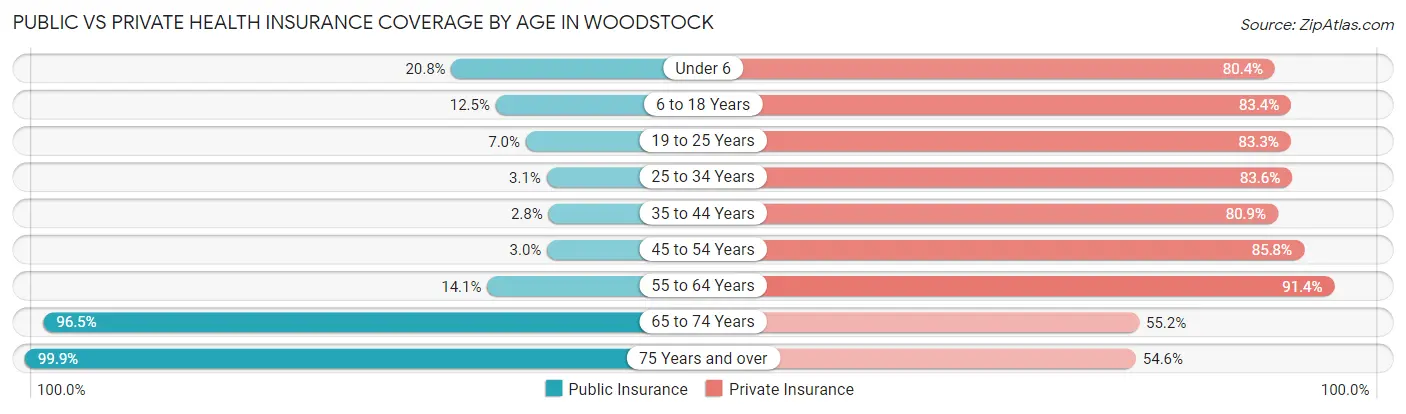
| Age Bracket | Public Insurance | Private Insurance |
| Under 6 | 575 (20.8%) | 2,226 (80.4%) |
| 6 to 18 Years | 782 (12.5%) | 5,200 (83.4%) |
| 19 to 25 Years | 208 (7.0%) | 2,491 (83.3%) |
| 25 to 34 Years | 150 (3.1%) | 4,061 (83.6%) |
| 35 to 44 Years | 143 (2.8%) | 4,207 (80.9%) |
| 45 to 54 Years | 165 (3.0%) | 4,721 (85.8%) |
| 55 to 64 Years | 461 (14.1%) | 2,984 (91.4%) |
| 65 to 74 Years | 2,353 (96.5%) | 1,345 (55.2%) |
| 75 Years and over | 1,670 (99.9%) | 912 (54.6%) |
| Total | 6,507 (18.6%) | 28,147 (80.6%) |
Disability Status by Sex by Age in Woodstock
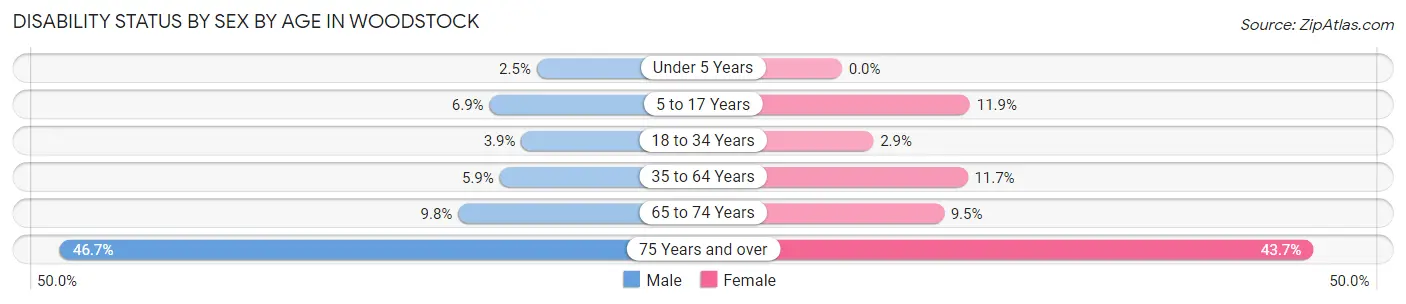
| Age Bracket | Male | Female |
| Under 5 Years | 30 (2.5%) | 0 (0.0%) |
| 5 to 17 Years | 209 (6.9%) | 364 (11.9%) |
| 18 to 34 Years | 143 (3.9%) | 132 (2.9%) |
| 35 to 64 Years | 410 (5.9%) | 821 (11.7%) |
| 65 to 74 Years | 77 (9.8%) | 156 (9.5%) |
| 75 Years and over | 348 (46.7%) | 405 (43.7%) |
Disability Class by Sex by Age in Woodstock
Disability Class: Hearing Difficulty
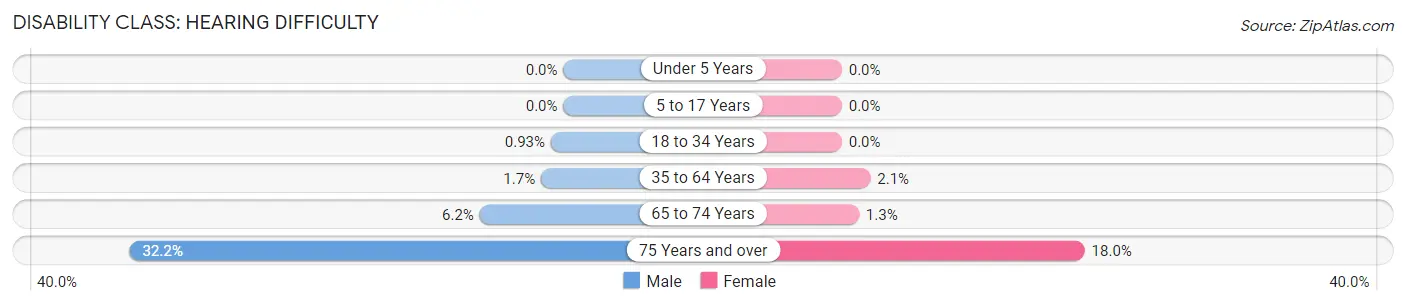
| Age Bracket | Male | Female |
| Under 5 Years | 0 (0.0%) | 0 (0.0%) |
| 5 to 17 Years | 0 (0.0%) | 0 (0.0%) |
| 18 to 34 Years | 34 (0.9%) | 0 (0.0%) |
| 35 to 64 Years | 115 (1.7%) | 149 (2.1%) |
| 65 to 74 Years | 49 (6.2%) | 21 (1.3%) |
| 75 Years and over | 240 (32.2%) | 167 (18.0%) |
Disability Class: Vision Difficulty
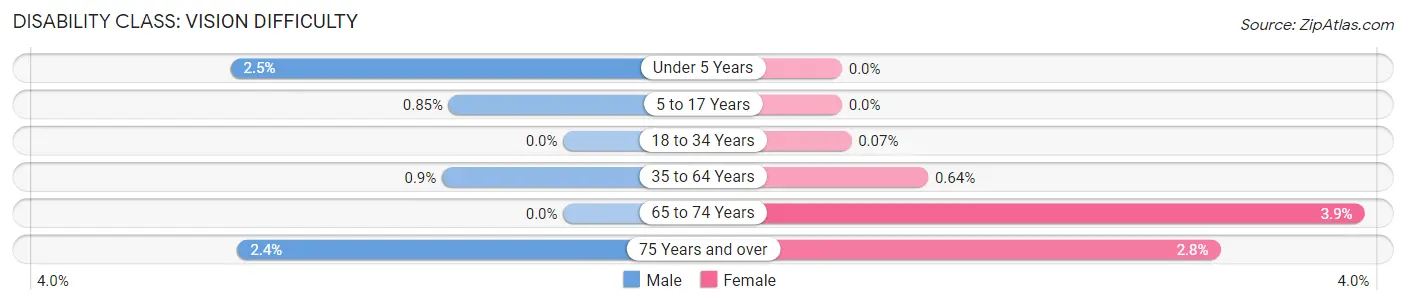
| Age Bracket | Male | Female |
| Under 5 Years | 30 (2.5%) | 0 (0.0%) |
| 5 to 17 Years | 26 (0.9%) | 0 (0.0%) |
| 18 to 34 Years | 0 (0.0%) | 3 (0.1%) |
| 35 to 64 Years | 62 (0.9%) | 45 (0.6%) |
| 65 to 74 Years | 0 (0.0%) | 64 (3.9%) |
| 75 Years and over | 18 (2.4%) | 26 (2.8%) |
Disability Class: Cognitive Difficulty
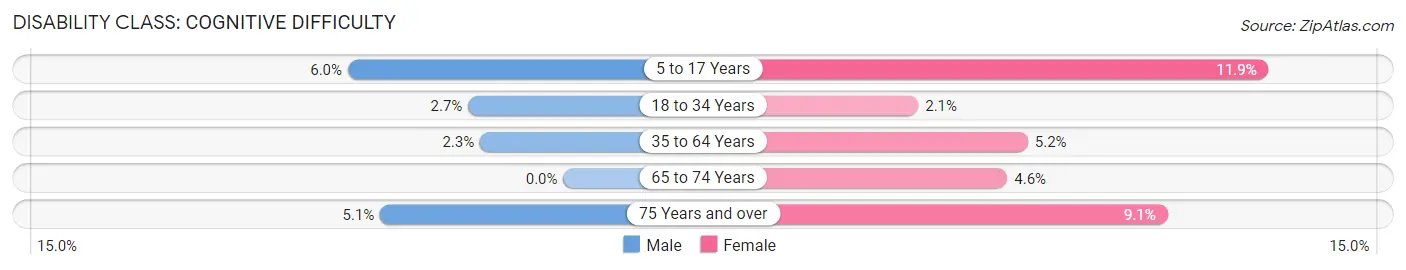
| Age Bracket | Male | Female |
| 5 to 17 Years | 183 (6.0%) | 364 (11.9%) |
| 18 to 34 Years | 97 (2.6%) | 96 (2.1%) |
| 35 to 64 Years | 161 (2.3%) | 365 (5.2%) |
| 65 to 74 Years | 0 (0.0%) | 76 (4.6%) |
| 75 Years and over | 38 (5.1%) | 84 (9.1%) |
Disability Class: Ambulatory Difficulty
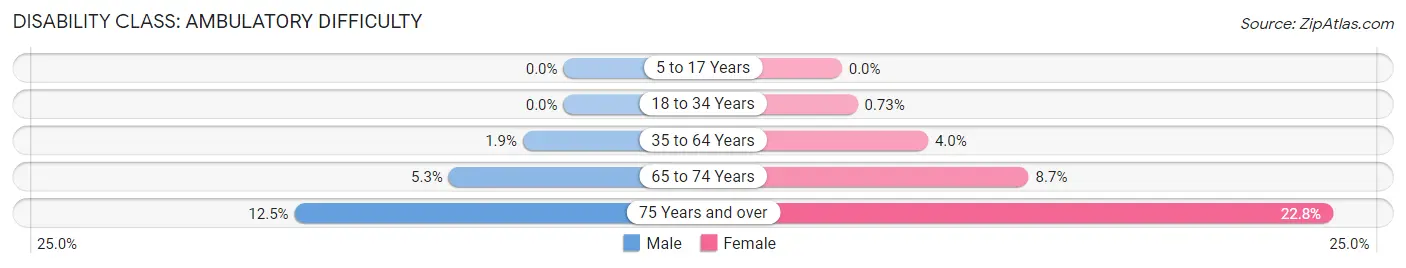
| Age Bracket | Male | Female |
| 5 to 17 Years | 0 (0.0%) | 0 (0.0%) |
| 18 to 34 Years | 0 (0.0%) | 33 (0.7%) |
| 35 to 64 Years | 130 (1.9%) | 282 (4.0%) |
| 65 to 74 Years | 42 (5.3%) | 143 (8.7%) |
| 75 Years and over | 93 (12.5%) | 211 (22.8%) |
Disability Class: Self-Care Difficulty
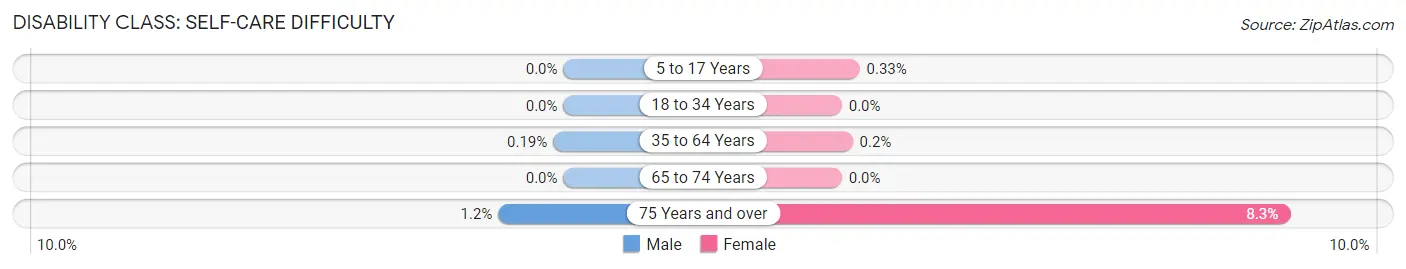
| Age Bracket | Male | Female |
| 5 to 17 Years | 0 (0.0%) | 10 (0.3%) |
| 18 to 34 Years | 0 (0.0%) | 0 (0.0%) |
| 35 to 64 Years | 13 (0.2%) | 14 (0.2%) |
| 65 to 74 Years | 0 (0.0%) | 0 (0.0%) |
| 75 Years and over | 9 (1.2%) | 77 (8.3%) |
Technology Access in Woodstock
Computing Device Access in Woodstock
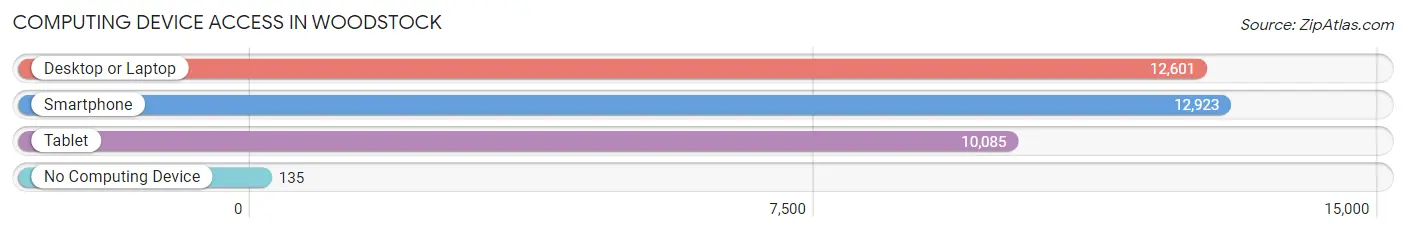
| Device Type | # Households | % Households |
| Desktop or Laptop | 12,601 | 92.4% |
| Smartphone | 12,923 | 94.7% |
| Tablet | 10,085 | 73.9% |
| No Computing Device | 135 | 1.0% |
| Total | 13,640 | 100.0% |
Internet Access in Woodstock
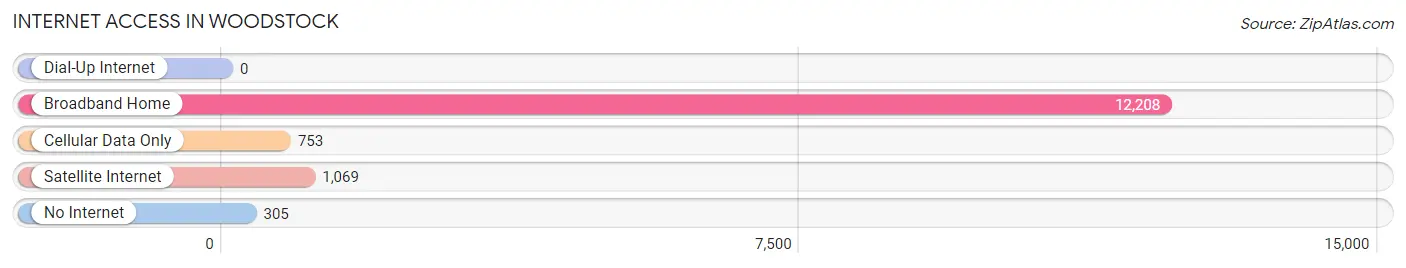
| Internet Type | # Households | % Households |
| Dial-Up Internet | 0 | 0.0% |
| Broadband Home | 12,208 | 89.5% |
| Cellular Data Only | 753 | 5.5% |
| Satellite Internet | 1,069 | 7.8% |
| No Internet | 305 | 2.2% |
| Total | 13,640 | 100.0% |
Woodstock Summary
History
The city of Woodstock, Georgia is located in Cherokee County, approximately 30 miles north of Atlanta. The city was founded in 1879 by a group of settlers from Woodstock, Connecticut. The city was named after the Connecticut town, and the settlers brought with them the same New England values and traditions. The city was incorporated in 1897 and has since grown to become a thriving suburban community.
The city of Woodstock has a rich history that dates back to the early 1800s. The area was originally inhabited by the Cherokee Indians, who were forced to move westward in the 1830s as part of the Indian Removal Act. The area was then settled by European-American settlers, who established farms and businesses. The city was officially founded in 1879 and was named after the Connecticut town.
The city of Woodstock experienced rapid growth in the late 19th and early 20th centuries. The city was connected to the rest of the state by the Marietta and North Georgia Railroad in 1881, and the city was incorporated in 1897. The city was a popular destination for tourists, and the downtown area was filled with shops, restaurants, and other businesses.
The city of Woodstock experienced a period of decline in the mid-20th century, as many of the businesses and factories closed. However, the city experienced a resurgence in the late 20th century, as the city was transformed into a suburban community. The city has experienced rapid growth in recent years, and the population has more than doubled since 2000.
Geography
Woodstock is located in the foothills of the Blue Ridge Mountains in Cherokee County, Georgia. The city is situated on the Etowah River, and the city is surrounded by rolling hills and forests. The city is located approximately 30 miles north of Atlanta, and the city is easily accessible by Interstate 575.
The city of Woodstock covers an area of approximately 10 square miles, and the city has an elevation of 890 feet. The city has a humid subtropical climate, with hot, humid summers and mild winters. The average annual temperature is around 60 degrees Fahrenheit, and the average annual precipitation is around 50 inches.
Economy
The city of Woodstock has a diverse economy, and the city is home to a variety of businesses and industries. The city is home to several large employers, including WellStar Health System, Home Depot, and the Cherokee County School District. The city is also home to several small businesses, including restaurants, retail stores, and professional services.
The city of Woodstock is also home to several major shopping centers, including Towne Lake Hills Shopping Center and The Outlet Shoppes at Atlanta. The city is also home to several parks and recreational facilities, including the Woodstock City Park and the Woodstock Golf Club.
Demographics
The city of Woodstock has a population of approximately 25,000 people, and the city has a population density of 2,500 people per square mile. The city is home to a diverse population, and the city has a median age of 36. The city is majority white, with approximately 70% of the population identifying as white. The city is also home to a large Hispanic population, with approximately 20% of the population identifying as Hispanic. The city is also home to a small African American population, with approximately 5% of the population identifying as African American. The city is also home to a small Asian population, with approximately 3% of the population identifying as Asian. The city is also home to a small Native American population, with approximately 1% of the population identifying as Native American.
Common Questions
What is Per Capita Income in Woodstock?
Per Capita income in Woodstock is $47,009.
What is the Median Family Income in Woodstock?
Median Family Income in Woodstock is $118,200.
What is the Median Household income in Woodstock?
Median Household Income in Woodstock is $100,913.
What is Income or Wage Gap in Woodstock?
Income or Wage Gap in Woodstock is 35.7%.
Women in Woodstock earn 64.3 cents for every dollar earned by a man.
What is Family Income Deficit in Woodstock?
Family Income Deficit in Woodstock is $7,890.
Families that are below poverty line in Woodstock earn $7,890 less on average than the poverty threshold level.
What is Inequality or Gini Index in Woodstock?
Inequality or Gini Index in Woodstock is 0.39.
What is the Total Population of Woodstock?
Total Population of Woodstock is 35,171.
What is the Total Male Population of Woodstock?
Total Male Population of Woodstock is 16,489.
What is the Total Female Population of Woodstock?
Total Female Population of Woodstock is 18,682.
What is the Ratio of Males per 100 Females in Woodstock?
There are 88.26 Males per 100 Females in Woodstock.
What is the Ratio of Females per 100 Males in Woodstock?
There are 113.30 Females per 100 Males in Woodstock.
What is the Median Population Age in Woodstock?
Median Population Age in Woodstock is 36.4 Years.
What is the Average Family Size in Woodstock
Average Family Size in Woodstock is 3.2 People.
What is the Average Household Size in Woodstock
Average Household Size in Woodstock is 2.6 People.
How Large is the Labor Force in Woodstock?
There are 20,710 People in the Labor Forcein in Woodstock.
What is the Percentage of People in the Labor Force in Woodstock?
75.3% of People are in the Labor Force in Woodstock.
What is the Unemployment Rate in Woodstock?
Unemployment Rate in Woodstock is 2.8%.