Oxford, GA Map & Demographics
Oxford Map
Oxford Overview
$26,567
PER CAPITA INCOME
$63,125
AVG FAMILY INCOME
$51,995
AVG HOUSEHOLD INCOME
51.9%
WAGE / INCOME GAP [ % ]
48.1¢/ $1
WAGE / INCOME GAP [ $ ]
$6,891
FAMILY INCOME DEFICIT
0.46
INEQUALITY / GINI INDEX
2,033
TOTAL POPULATION
835
MALE POPULATION
1,198
FEMALE POPULATION
69.70
MALES / 100 FEMALES
143.47
FEMALES / 100 MALES
24.4
MEDIAN AGE
3.2
AVG FAMILY SIZE
2.4
AVG HOUSEHOLD SIZE
939
LABOR FORCE [ PEOPLE ]
55.6%
PERCENT IN LABOR FORCE
4.6%
UNEMPLOYMENT RATE
Oxford Zip Codes
Oxford Area Codes
Income in Oxford
Income Overview in Oxford
Per Capita Income in Oxford is $26,567, while median incomes of families and households are $63,125 and $51,995 respectively.
| Characteristic | Number | Measure |
| Per Capita Income | 2,033 | $26,567 |
| Median Family Income | 357 | $63,125 |
| Mean Family Income | 357 | $84,998 |
| Median Household Income | 661 | $51,995 |
| Mean Household Income | 661 | $73,051 |
| Income Deficit | 357 | $6,891 |
| Wage / Income Gap (%) | 2,033 | 51.93% |
| Wage / Income Gap ($) | 2,033 | 48.07¢ per $1 |
| Gini / Inequality Index | 2,033 | 0.46 |
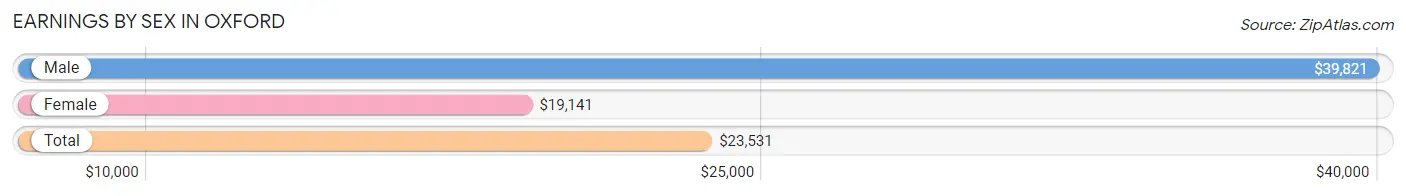
Earnings by Sex in Oxford
Average Earnings in Oxford are $23,531, $39,821 for men and $19,141 for women, a difference of 51.9%.
| Sex | Number | Average Earnings |
| Male | 483 (43.5%) | $39,821 |
| Female | 627 (56.5%) | $19,141 |
| Total | 1,110 (100.0%) | $23,531 |
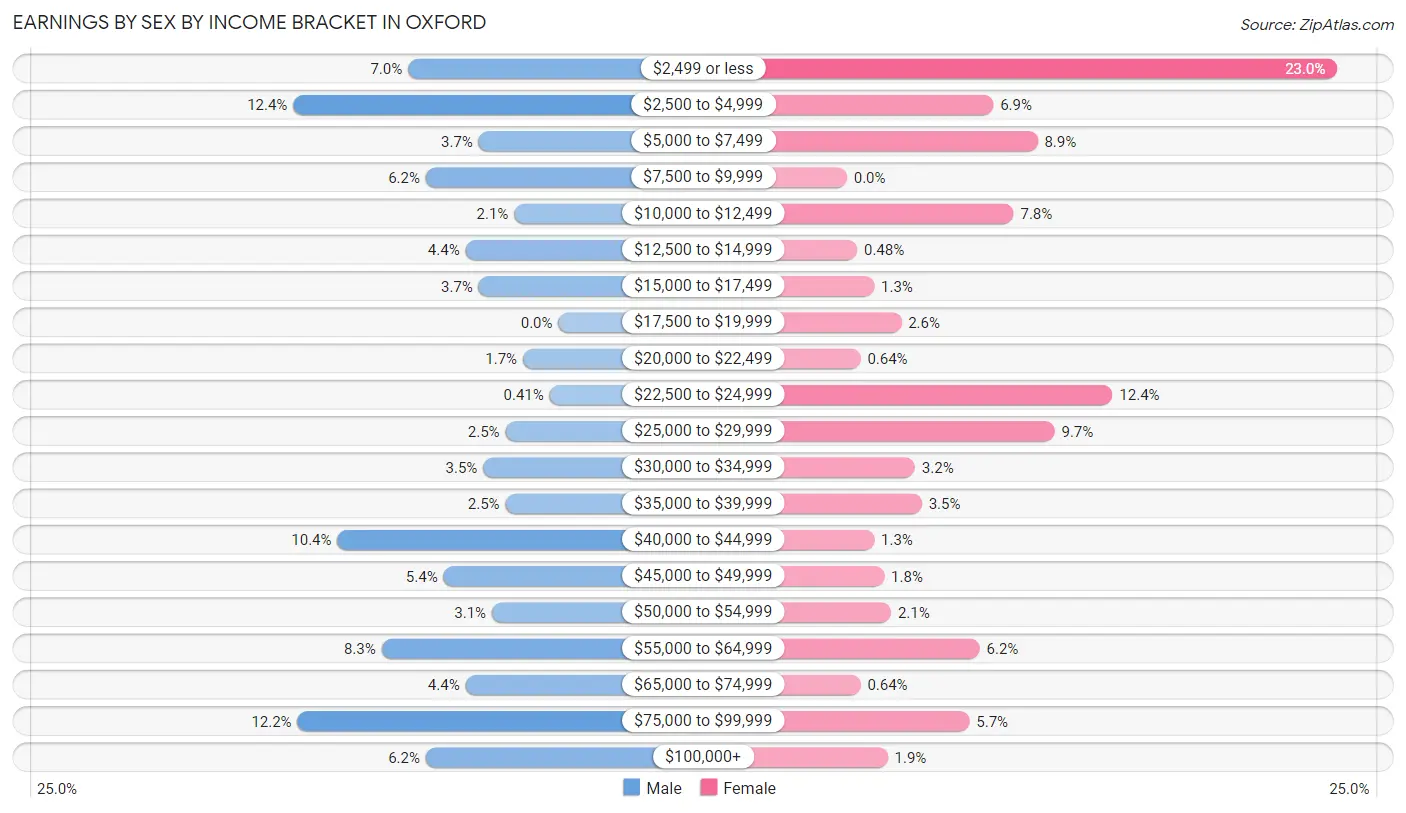
Earnings by Sex by Income Bracket in Oxford
The most common earnings brackets in Oxford are $2,500 to $4,999 for men (60 | 12.4%) and $2,499 or less for women (144 | 23.0%).
| Income | Male | Female |
| $2,499 or less | 34 (7.0%) | 144 (23.0%) |
| $2,500 to $4,999 | 60 (12.4%) | 43 (6.9%) |
| $5,000 to $7,499 | 18 (3.7%) | 56 (8.9%) |
| $7,500 to $9,999 | 30 (6.2%) | 0 (0.0%) |
| $10,000 to $12,499 | 10 (2.1%) | 49 (7.8%) |
| $12,500 to $14,999 | 21 (4.3%) | 3 (0.5%) |
| $15,000 to $17,499 | 18 (3.7%) | 8 (1.3%) |
| $17,500 to $19,999 | 0 (0.0%) | 16 (2.5%) |
| $20,000 to $22,499 | 8 (1.7%) | 4 (0.6%) |
| $22,500 to $24,999 | 2 (0.4%) | 78 (12.4%) |
| $25,000 to $29,999 | 12 (2.5%) | 61 (9.7%) |
| $30,000 to $34,999 | 17 (3.5%) | 20 (3.2%) |
| $35,000 to $39,999 | 12 (2.5%) | 22 (3.5%) |
| $40,000 to $44,999 | 50 (10.3%) | 8 (1.3%) |
| $45,000 to $49,999 | 26 (5.4%) | 11 (1.8%) |
| $50,000 to $54,999 | 15 (3.1%) | 13 (2.1%) |
| $55,000 to $64,999 | 40 (8.3%) | 39 (6.2%) |
| $65,000 to $74,999 | 21 (4.3%) | 4 (0.6%) |
| $75,000 to $99,999 | 59 (12.2%) | 36 (5.7%) |
| $100,000+ | 30 (6.2%) | 12 (1.9%) |
| Total | 483 (100.0%) | 627 (100.0%) |
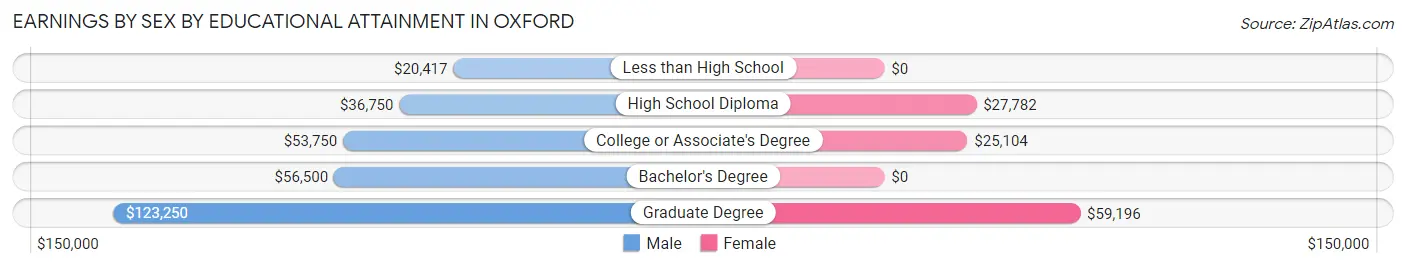
Earnings by Sex by Educational Attainment in Oxford
Average earnings in Oxford are $46,250 for men and $27,778 for women, a difference of 39.9%. Men with an educational attainment of graduate degree enjoy the highest average annual earnings of $123,250, while those with less than high school education earn the least with $20,417. Women with an educational attainment of graduate degree earn the most with the average annual earnings of $59,196, while those with college or associate's degree education have the smallest earnings of $25,104.
| Educational Attainment | Male Income | Female Income |
| Less than High School | $20,417 | $0 |
| High School Diploma | $36,750 | $27,782 |
| College or Associate's Degree | $53,750 | $25,104 |
| Bachelor's Degree | $56,500 | $0 |
| Graduate Degree | $123,250 | $59,196 |
| Total | $46,250 | $27,778 |
Family Income in Oxford
Family Income Brackets in Oxford
According to the Oxford family income data, there are 86 families falling into the $50,000 to $74,999 income range, which is the most common income bracket and makes up 24.1% of all families. Conversely, the less than $10,000 income bracket is the least frequent group with only 5 families (1.4%) belonging to this category.
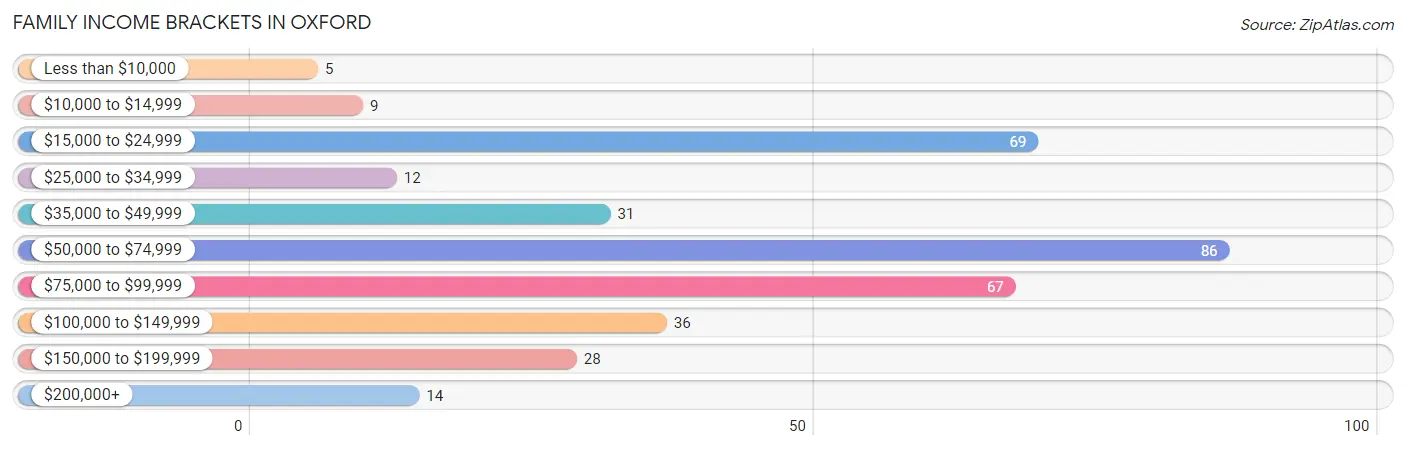
| Income Bracket | # Families | % Families |
| Less than $10,000 | 5 | 1.4% |
| $10,000 to $14,999 | 9 | 2.5% |
| $15,000 to $24,999 | 69 | 19.3% |
| $25,000 to $34,999 | 12 | 3.4% |
| $35,000 to $49,999 | 31 | 8.7% |
| $50,000 to $74,999 | 86 | 24.1% |
| $75,000 to $99,999 | 67 | 18.8% |
| $100,000 to $149,999 | 36 | 10.1% |
| $150,000 to $199,999 | 28 | 7.8% |
| $200,000+ | 14 | 3.9% |
Family Income by Famaliy Size in Oxford
4-person families (24 | 6.7%) account for the highest median family income in Oxford with $86,250 per family, while 3-person families (71 | 19.9%) have the highest median income of $27,679 per family member.
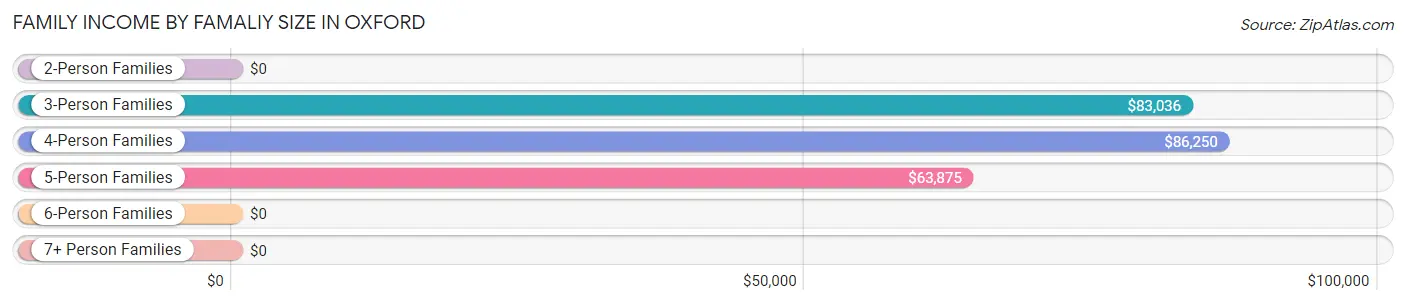
| Income Bracket | # Families | Median Income |
| 2-Person Families | 184 (51.5%) | $0 |
| 3-Person Families | 71 (19.9%) | $83,036 |
| 4-Person Families | 24 (6.7%) | $86,250 |
| 5-Person Families | 65 (18.2%) | $63,875 |
| 6-Person Families | 10 (2.8%) | $0 |
| 7+ Person Families | 3 (0.8%) | $0 |
| Total | 357 (100.0%) | $63,125 |
Family Income by Number of Earners in Oxford
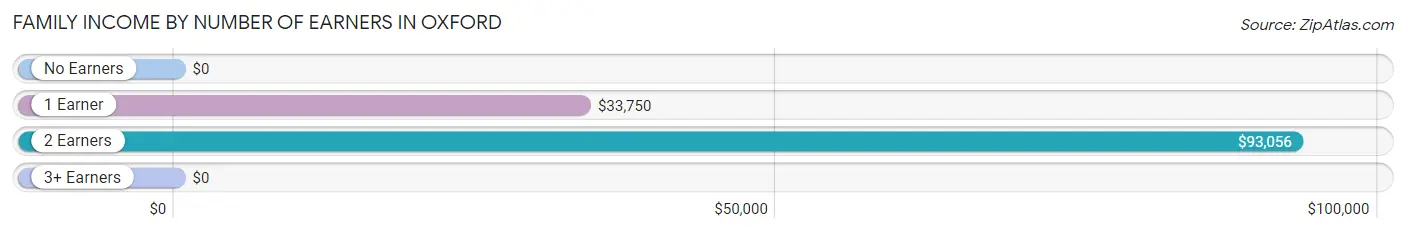
| Number of Earners | # Families | Median Income |
| No Earners | 46 (12.9%) | $0 |
| 1 Earner | 150 (42.0%) | $33,750 |
| 2 Earners | 146 (40.9%) | $93,056 |
| 3+ Earners | 15 (4.2%) | $0 |
| Total | 357 (100.0%) | $63,125 |
Household Income in Oxford
Household Income Brackets in Oxford
With 167 households falling in the category, the $50,000 to $74,999 income range is the most frequent in Oxford, accounting for 25.3% of all households. In contrast, only 20 households (3.0%) fall into the $200,000+ income bracket, making it the least populous group.
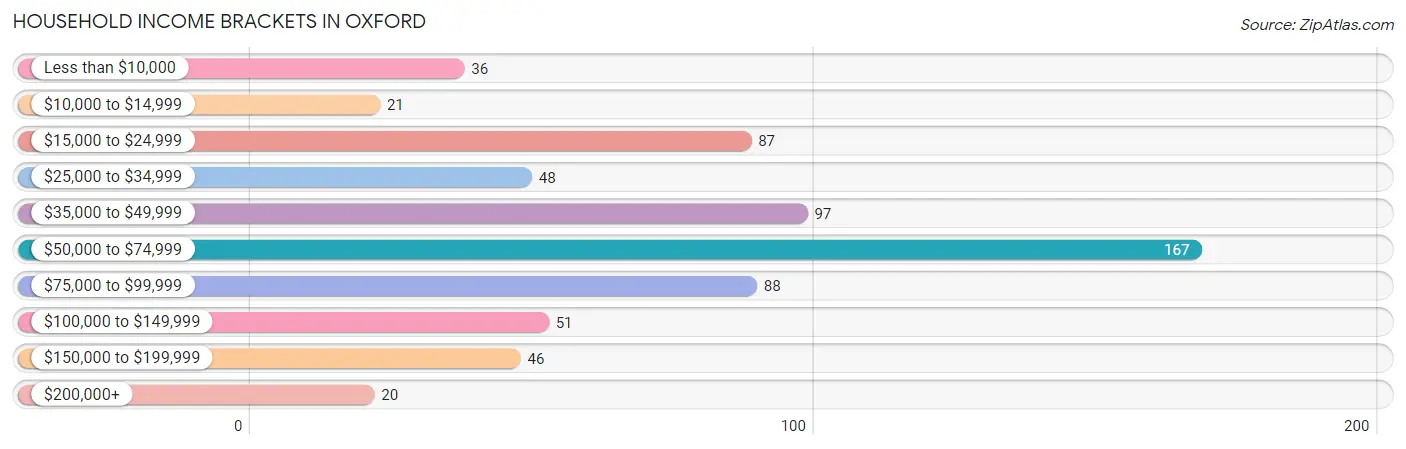
| Income Bracket | # Households | % Households |
| Less than $10,000 | 36 | 5.4% |
| $10,000 to $14,999 | 21 | 3.2% |
| $15,000 to $24,999 | 87 | 13.2% |
| $25,000 to $34,999 | 48 | 7.3% |
| $35,000 to $49,999 | 97 | 14.7% |
| $50,000 to $74,999 | 167 | 25.3% |
| $75,000 to $99,999 | 88 | 13.3% |
| $100,000 to $149,999 | 51 | 7.7% |
| $150,000 to $199,999 | 46 | 7.0% |
| $200,000+ | 20 | 3.0% |
Household Income by Householder Age in Oxford
The median household income in Oxford is $51,995, with the highest median household income of $61,875 found in the 25 to 44 years age bracket for the primary householder. A total of 239 households (36.2%) fall into this category. Meanwhile, the 15 to 24 years age bracket for the primary householder has the lowest median household income of $0, with 33 households (5.0%) in this group.
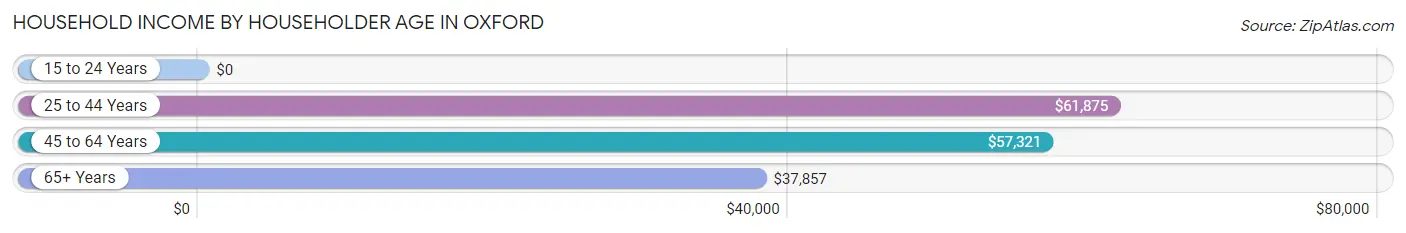
| Income Bracket | # Households | Median Income |
| 15 to 24 Years | 33 (5.0%) | $0 |
| 25 to 44 Years | 239 (36.2%) | $61,875 |
| 45 to 64 Years | 183 (27.7%) | $57,321 |
| 65+ Years | 206 (31.2%) | $37,857 |
| Total | 661 (100.0%) | $51,995 |
Poverty in Oxford
Income Below Poverty by Sex and Age in Oxford
With 12.3% poverty level for males and 10.5% for females among the residents of Oxford, 15 year old males and under 5 year old females are the most vulnerable to poverty, with 4 males (100.0%) and 4 females (100.0%) in their respective age groups living below the poverty level.
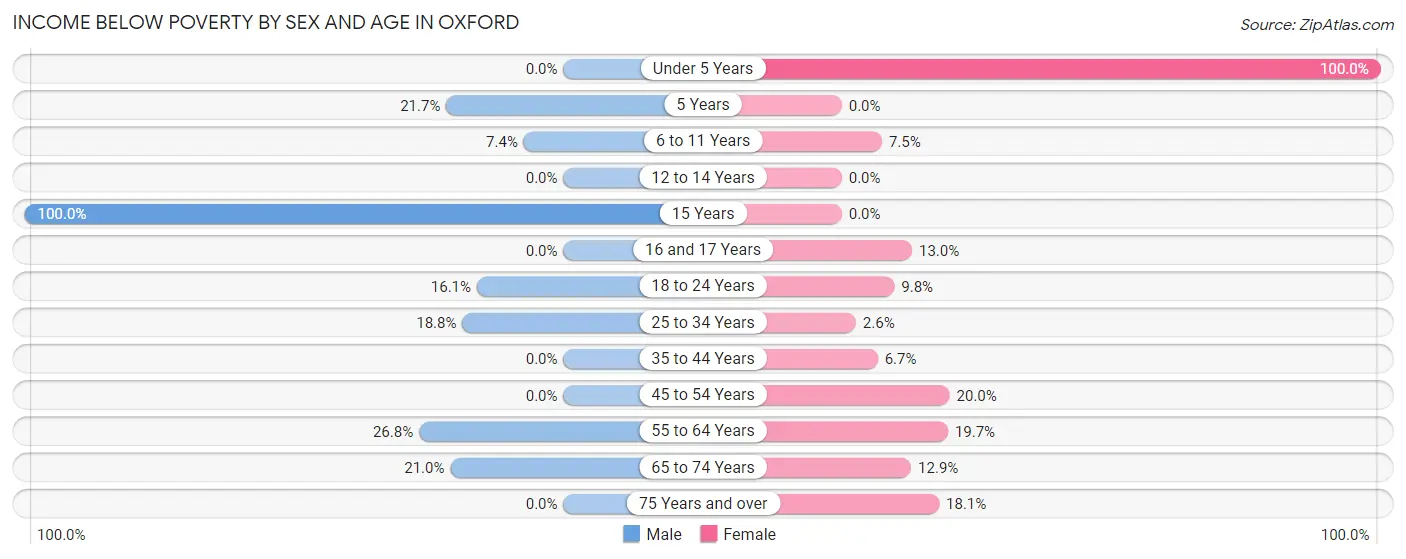
| Age Bracket | Male | Female |
| Under 5 Years | 0 (0.0%) | 4 (100.0%) |
| 5 Years | 5 (21.7%) | 0 (0.0%) |
| 6 to 11 Years | 5 (7.3%) | 5 (7.5%) |
| 12 to 14 Years | 0 (0.0%) | 0 (0.0%) |
| 15 Years | 4 (100.0%) | 0 (0.0%) |
| 16 and 17 Years | 0 (0.0%) | 3 (13.0%) |
| 18 to 24 Years | 13 (16.1%) | 12 (9.8%) |
| 25 to 34 Years | 18 (18.8%) | 5 (2.6%) |
| 35 to 44 Years | 0 (0.0%) | 4 (6.7%) |
| 45 to 54 Years | 0 (0.0%) | 14 (20.0%) |
| 55 to 64 Years | 26 (26.8%) | 13 (19.7%) |
| 65 to 74 Years | 17 (21.0%) | 13 (12.9%) |
| 75 Years and over | 0 (0.0%) | 13 (18.1%) |
| Total | 88 (12.3%) | 86 (10.5%) |
Income Above Poverty by Sex and Age in Oxford
According to the poverty statistics in Oxford, males aged under 5 years and females aged 12 to 14 years are the age groups that are most secure financially, with 100.0% of males and 100.0% of females in these age groups living above the poverty line.
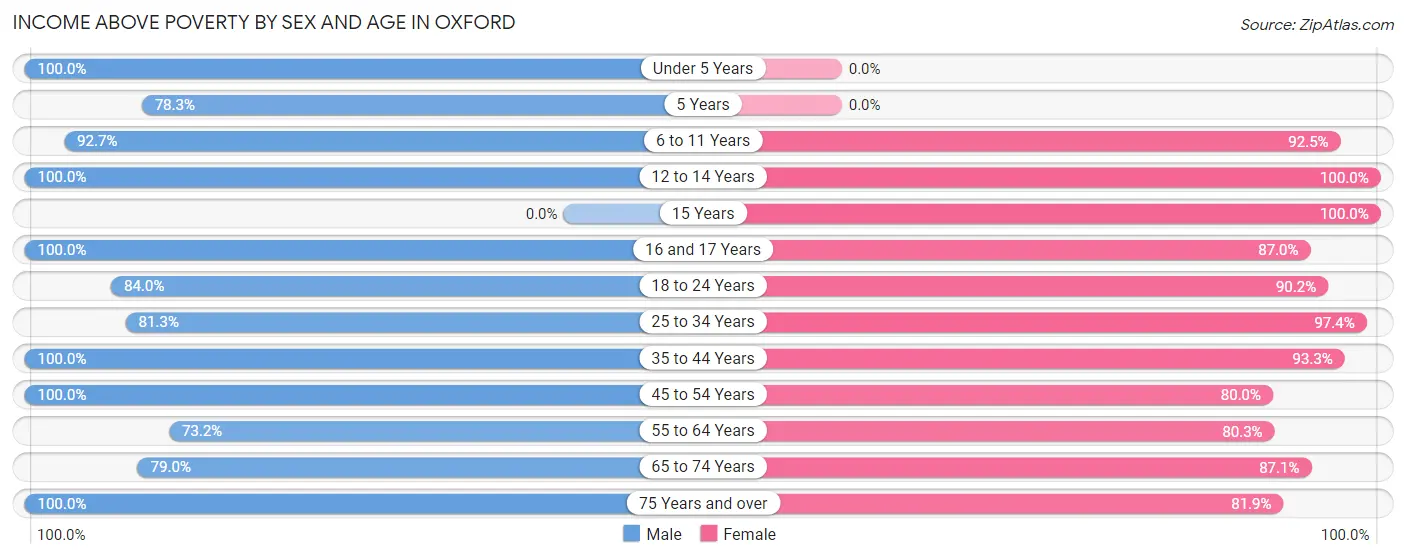
| Age Bracket | Male | Female |
| Under 5 Years | 73 (100.0%) | 0 (0.0%) |
| 5 Years | 18 (78.3%) | 0 (0.0%) |
| 6 to 11 Years | 63 (92.6%) | 62 (92.5%) |
| 12 to 14 Years | 19 (100.0%) | 34 (100.0%) |
| 15 Years | 0 (0.0%) | 5 (100.0%) |
| 16 and 17 Years | 14 (100.0%) | 20 (87.0%) |
| 18 to 24 Years | 68 (84.0%) | 111 (90.2%) |
| 25 to 34 Years | 78 (81.2%) | 186 (97.4%) |
| 35 to 44 Years | 91 (100.0%) | 56 (93.3%) |
| 45 to 54 Years | 42 (100.0%) | 56 (80.0%) |
| 55 to 64 Years | 71 (73.2%) | 53 (80.3%) |
| 65 to 74 Years | 64 (79.0%) | 88 (87.1%) |
| 75 Years and over | 28 (100.0%) | 59 (81.9%) |
| Total | 629 (87.7%) | 730 (89.5%) |
Income Below Poverty Among Married-Couple Families in Oxford
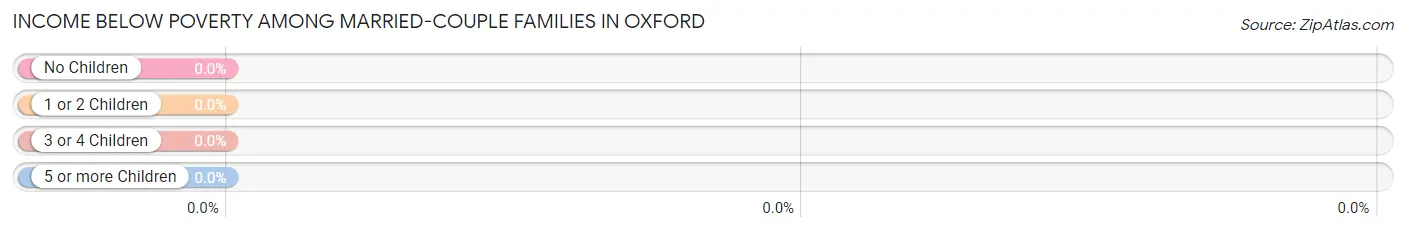
| Children | Above Poverty | Below Poverty |
| No Children | 96 (100.0%) | 0 (0.0%) |
| 1 or 2 Children | 76 (100.0%) | 0 (0.0%) |
| 3 or 4 Children | 36 (100.0%) | 0 (0.0%) |
| 5 or more Children | 0 (0.0%) | 0 (0.0%) |
| Total | 208 (100.0%) | 0 (0.0%) |
Income Below Poverty Among Single-Parent Households in Oxford
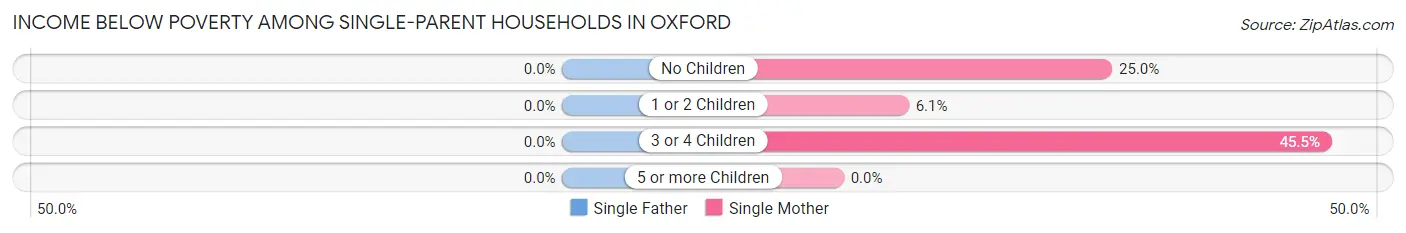
| Children | Single Father | Single Mother |
| No Children | 0 (0.0%) | 14 (25.0%) |
| 1 or 2 Children | 0 (0.0%) | 4 (6.1%) |
| 3 or 4 Children | 0 (0.0%) | 5 (45.5%) |
| 5 or more Children | 0 (0.0%) | 0 (0.0%) |
| Total | 0 (0.0%) | 23 (17.3%) |
Income Below Poverty Among Married-Couple vs Single-Parent Households in Oxford
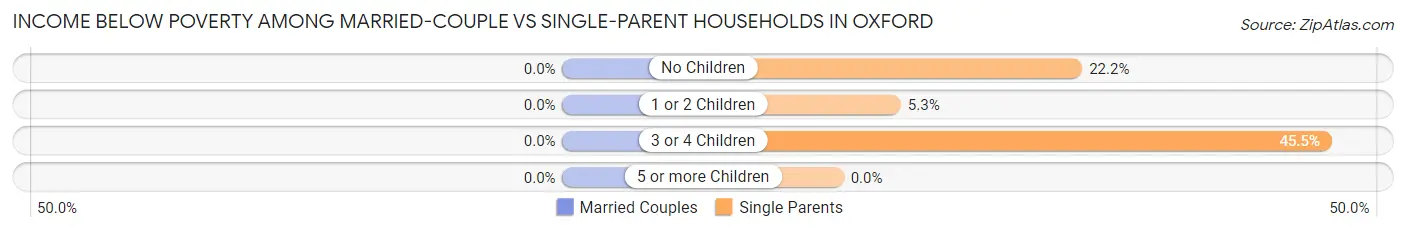
| Children | Married-Couple Families | Single-Parent Households |
| No Children | 0 (0.0%) | 14 (22.2%) |
| 1 or 2 Children | 0 (0.0%) | 4 (5.3%) |
| 3 or 4 Children | 0 (0.0%) | 5 (45.5%) |
| 5 or more Children | 0 (0.0%) | 0 (0.0%) |
| Total | 0 (0.0%) | 23 (15.4%) |
Race in Oxford
The most populous races in Oxford are White / Caucasian (1,078 | 53.0%), Black / African American (548 | 27.0%), and Asian (266 | 13.1%).
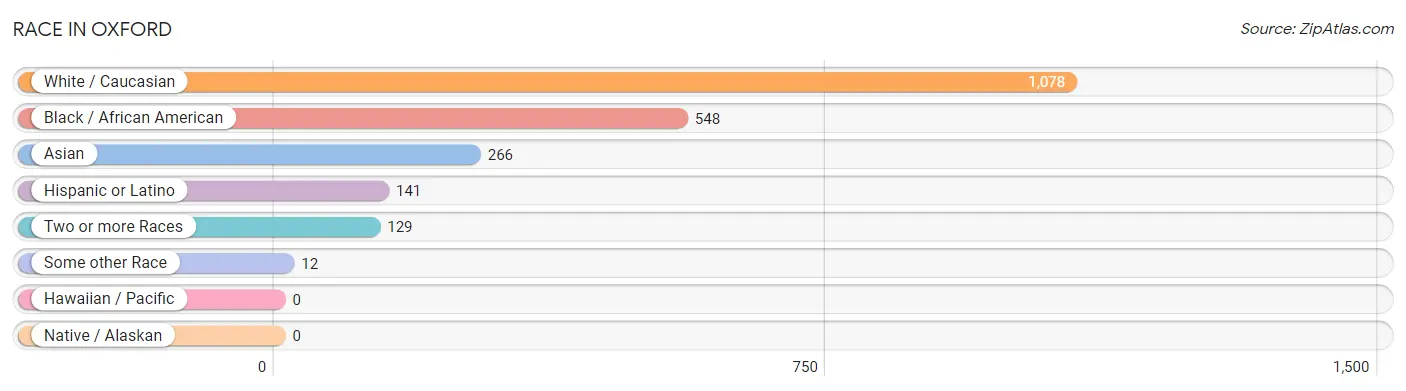
| Race | # Population | % Population |
| Asian | 266 | 13.1% |
| Black / African American | 548 | 27.0% |
| Hawaiian / Pacific | 0 | 0.0% |
| Hispanic or Latino | 141 | 6.9% |
| Native / Alaskan | 0 | 0.0% |
| White / Caucasian | 1,078 | 53.0% |
| Two or more Races | 129 | 6.4% |
| Some other Race | 12 | 0.6% |
| Total | 2,033 | 100.0% |
Ancestry in Oxford
The most populous ancestries reported in Oxford are Irish (226 | 11.1%), American (202 | 9.9%), English (190 | 9.3%), Indian (Asian) (159 | 7.8%), and German (123 | 6.0%), together accounting for 44.3% of all Oxford residents.
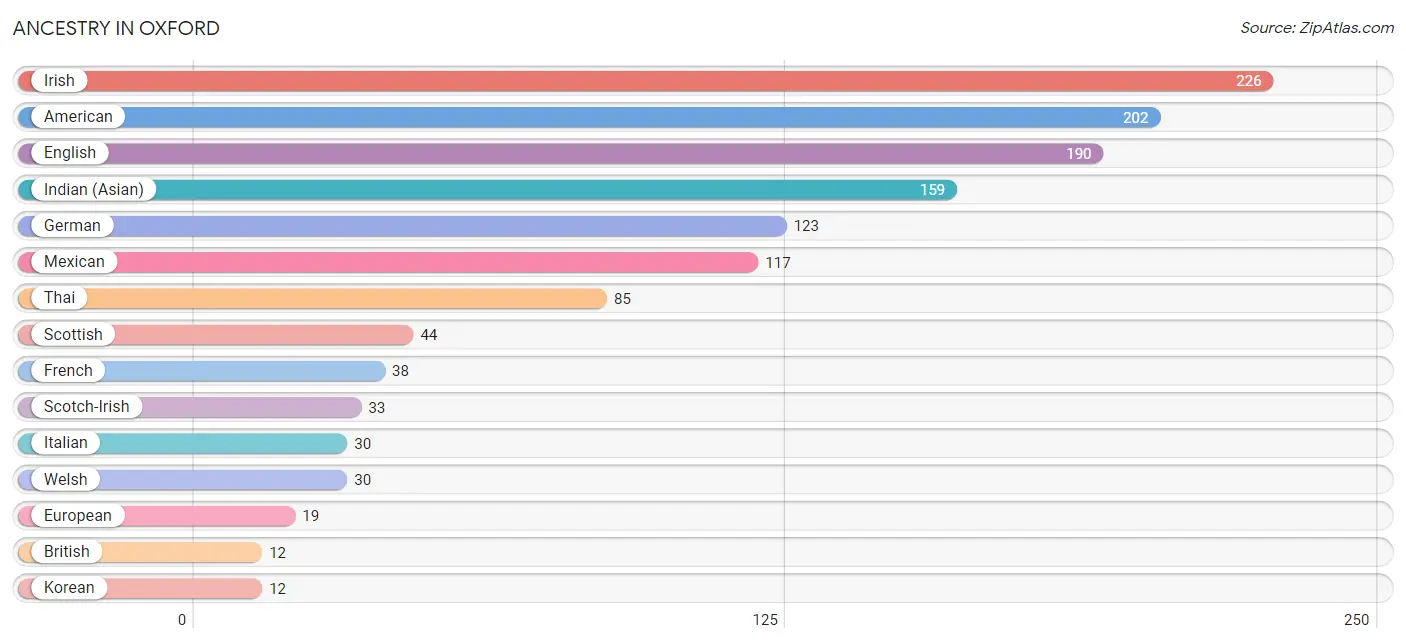
| Ancestry | # Population | % Population |
| American | 202 | 9.9% |
| Arab | 10 | 0.5% |
| Belgian | 5 | 0.3% |
| Bhutanese | 1 | 0.1% |
| British | 12 | 0.6% |
| Bulgarian | 2 | 0.1% |
| Burmese | 7 | 0.3% |
| Canadian | 4 | 0.2% |
| Central American | 3 | 0.2% |
| Chilean | 5 | 0.3% |
| Colombian | 2 | 0.1% |
| Cuban | 3 | 0.2% |
| Danish | 7 | 0.3% |
| Dutch | 11 | 0.5% |
| English | 190 | 9.3% |
| European | 19 | 0.9% |
| Filipino | 2 | 0.1% |
| French | 38 | 1.9% |
| German | 123 | 6.0% |
| Indian (Asian) | 159 | 7.8% |
| Irish | 226 | 11.1% |
| Italian | 30 | 1.5% |
| Korean | 12 | 0.6% |
| Lebanese | 10 | 0.5% |
| Lithuanian | 3 | 0.2% |
| Mexican | 117 | 5.8% |
| Nigerian | 6 | 0.3% |
| Norwegian | 8 | 0.4% |
| Polish | 2 | 0.1% |
| Puerto Rican | 8 | 0.4% |
| Salvadoran | 3 | 0.2% |
| Scotch-Irish | 33 | 1.6% |
| Scottish | 44 | 2.2% |
| Senegalese | 3 | 0.2% |
| South American | 7 | 0.3% |
| Spaniard | 3 | 0.2% |
| Subsaharan African | 9 | 0.4% |
| Thai | 85 | 4.2% |
| Welsh | 30 | 1.5% | View All 39 Rows |
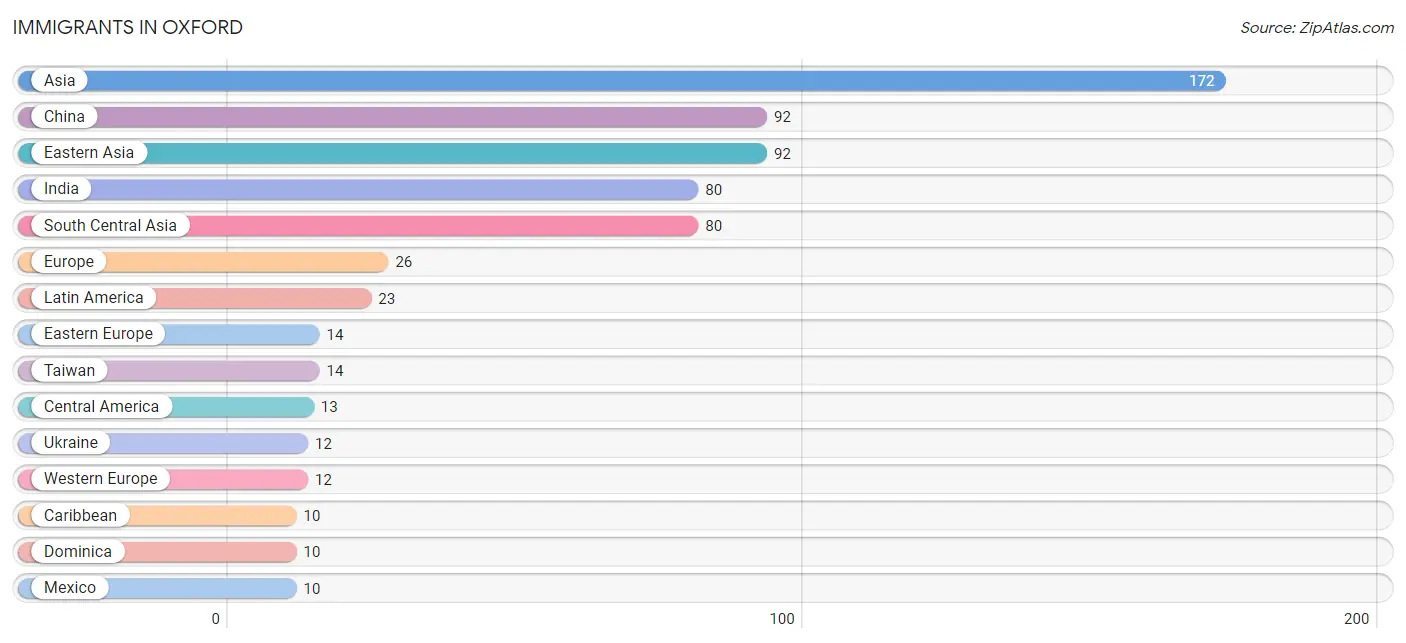
Immigrants in Oxford
The most numerous immigrant groups reported in Oxford came from Asia (172 | 8.5%), China (92 | 4.5%), Eastern Asia (92 | 4.5%), India (80 | 3.9%), and South Central Asia (80 | 3.9%), together accounting for 25.4% of all Oxford residents.
| Immigration Origin | # Population | % Population |
| Asia | 172 | 8.5% |
| Bulgaria | 2 | 0.1% |
| Caribbean | 10 | 0.5% |
| Central America | 13 | 0.6% |
| China | 92 | 4.5% |
| Dominica | 10 | 0.5% |
| Eastern Asia | 92 | 4.5% |
| Eastern Europe | 14 | 0.7% |
| El Salvador | 3 | 0.2% |
| Europe | 26 | 1.3% |
| France | 5 | 0.3% |
| Germany | 7 | 0.3% |
| India | 80 | 3.9% |
| Latin America | 23 | 1.1% |
| Mexico | 10 | 0.5% |
| South Central Asia | 80 | 3.9% |
| Taiwan | 14 | 0.7% |
| Ukraine | 12 | 0.6% |
| Western Europe | 12 | 0.6% | View All 19 Rows |
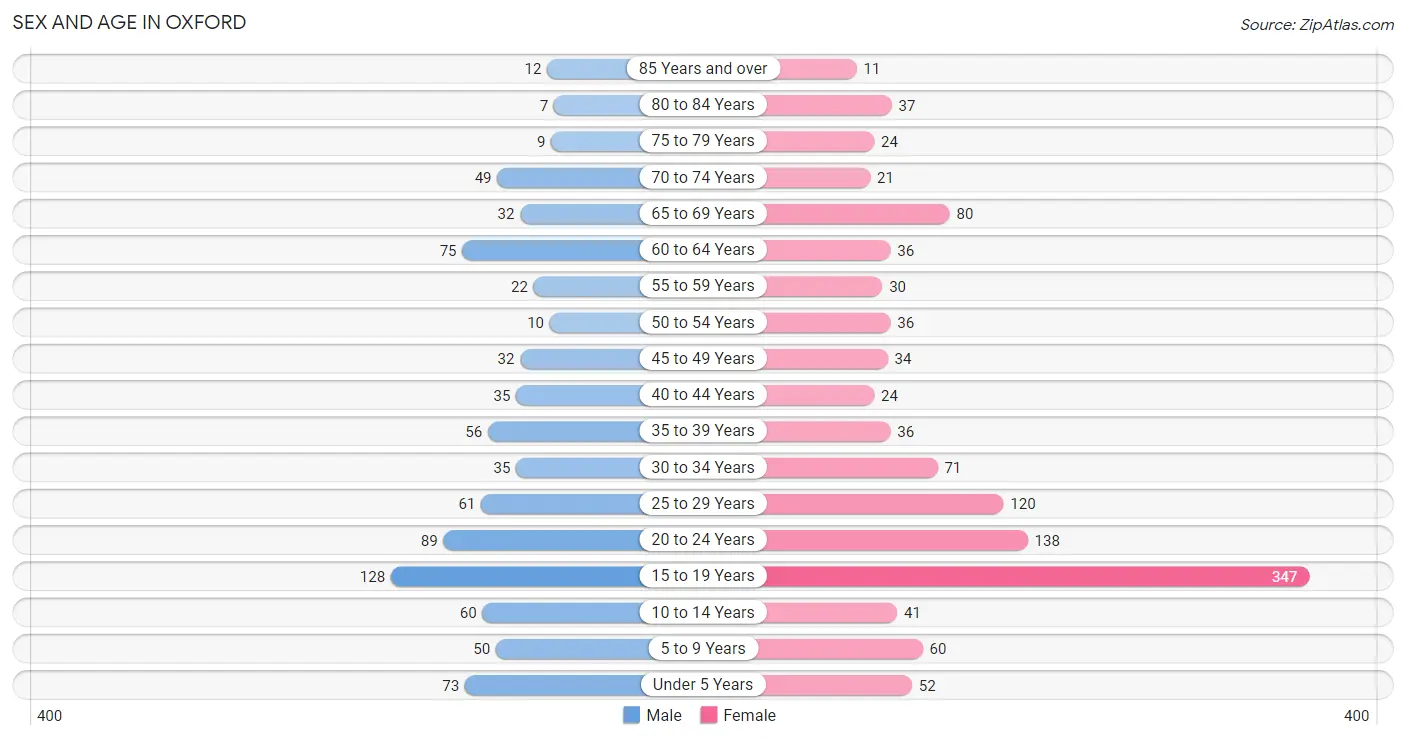
Sex and Age in Oxford
Sex and Age in Oxford
The most populous age groups in Oxford are 15 to 19 Years (128 | 15.3%) for men and 15 to 19 Years (347 | 29.0%) for women.
| Age Bracket | Male | Female |
| Under 5 Years | 73 (8.7%) | 52 (4.3%) |
| 5 to 9 Years | 50 (6.0%) | 60 (5.0%) |
| 10 to 14 Years | 60 (7.2%) | 41 (3.4%) |
| 15 to 19 Years | 128 (15.3%) | 347 (29.0%) |
| 20 to 24 Years | 89 (10.7%) | 138 (11.5%) |
| 25 to 29 Years | 61 (7.3%) | 120 (10.0%) |
| 30 to 34 Years | 35 (4.2%) | 71 (5.9%) |
| 35 to 39 Years | 56 (6.7%) | 36 (3.0%) |
| 40 to 44 Years | 35 (4.2%) | 24 (2.0%) |
| 45 to 49 Years | 32 (3.8%) | 34 (2.8%) |
| 50 to 54 Years | 10 (1.2%) | 36 (3.0%) |
| 55 to 59 Years | 22 (2.6%) | 30 (2.5%) |
| 60 to 64 Years | 75 (9.0%) | 36 (3.0%) |
| 65 to 69 Years | 32 (3.8%) | 80 (6.7%) |
| 70 to 74 Years | 49 (5.9%) | 21 (1.8%) |
| 75 to 79 Years | 9 (1.1%) | 24 (2.0%) |
| 80 to 84 Years | 7 (0.8%) | 37 (3.1%) |
| 85 Years and over | 12 (1.4%) | 11 (0.9%) |
| Total | 835 (100.0%) | 1,198 (100.0%) |
Families and Households in Oxford
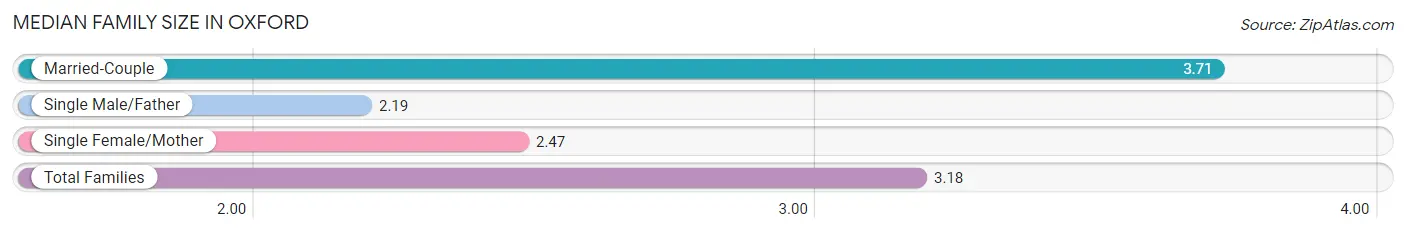
Median Family Size in Oxford
The median family size in Oxford is 3.18 persons per family, with married-couple families (208 | 58.3%) accounting for the largest median family size of 3.71 persons per family. On the other hand, single male/father families (16 | 4.5%) represent the smallest median family size with 2.19 persons per family.
| Family Type | # Families | Family Size |
| Married-Couple | 208 (58.3%) | 3.71 |
| Single Male/Father | 16 (4.5%) | 2.19 |
| Single Female/Mother | 133 (37.2%) | 2.47 |
| Total Families | 357 (100.0%) | 3.18 |
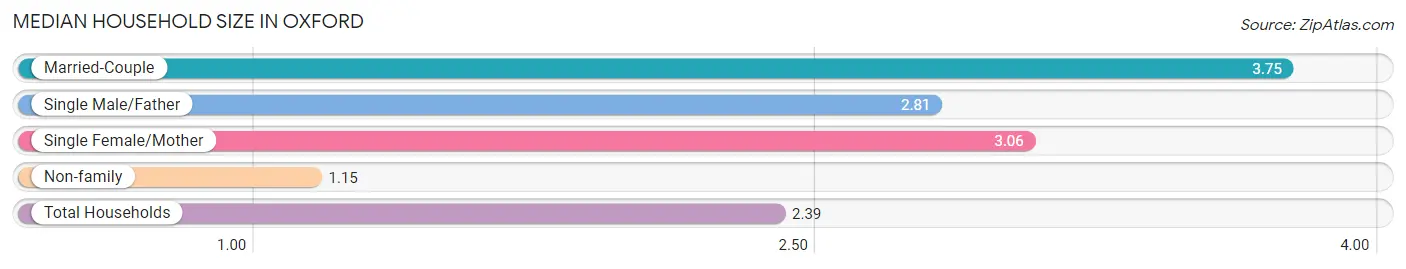
Median Household Size in Oxford
The median household size in Oxford is 2.39 persons per household, with married-couple households (208 | 31.5%) accounting for the largest median household size of 3.75 persons per household. non-family households (304 | 46.0%) represent the smallest median household size with 1.15 persons per household.
| Household Type | # Households | Household Size |
| Married-Couple | 208 (31.5%) | 3.75 |
| Single Male/Father | 16 (2.4%) | 2.81 |
| Single Female/Mother | 133 (20.1%) | 3.06 |
| Non-family | 304 (46.0%) | 1.15 |
| Total Households | 661 (100.0%) | 2.39 |
Household Size by Marriage Status in Oxford
Out of a total of 661 households in Oxford, 357 (54.0%) are family households, while 304 (46.0%) are nonfamily households. The most numerous type of family households are 2-person households, comprising 136, and the most common type of nonfamily households are 1-person households, comprising 256.
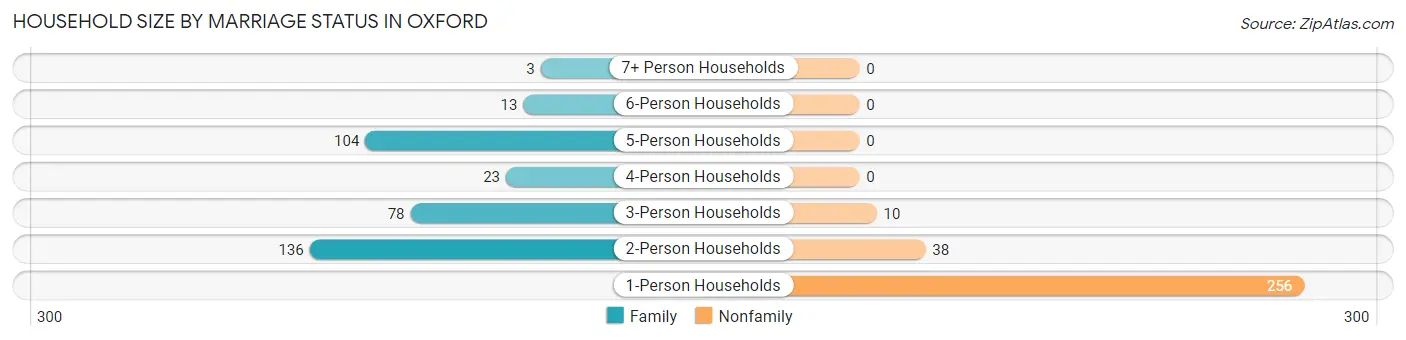
| Household Size | Family Households | Nonfamily Households |
| 1-Person Households | - | 256 (38.7%) |
| 2-Person Households | 136 (20.6%) | 38 (5.8%) |
| 3-Person Households | 78 (11.8%) | 10 (1.5%) |
| 4-Person Households | 23 (3.5%) | 0 (0.0%) |
| 5-Person Households | 104 (15.7%) | 0 (0.0%) |
| 6-Person Households | 13 (2.0%) | 0 (0.0%) |
| 7+ Person Households | 3 (0.4%) | 0 (0.0%) |
| Total | 357 (54.0%) | 304 (46.0%) |
Female Fertility in Oxford
Fertility by Age in Oxford
Average fertility rate in Oxford is 52.0 births per 1,000 women. Women in the age bracket of 20 to 34 years have the highest fertility rate with 125.0 births per 1,000 women. Women in the age bracket of 20 to 34 years acount for 100.0% of all women with births.
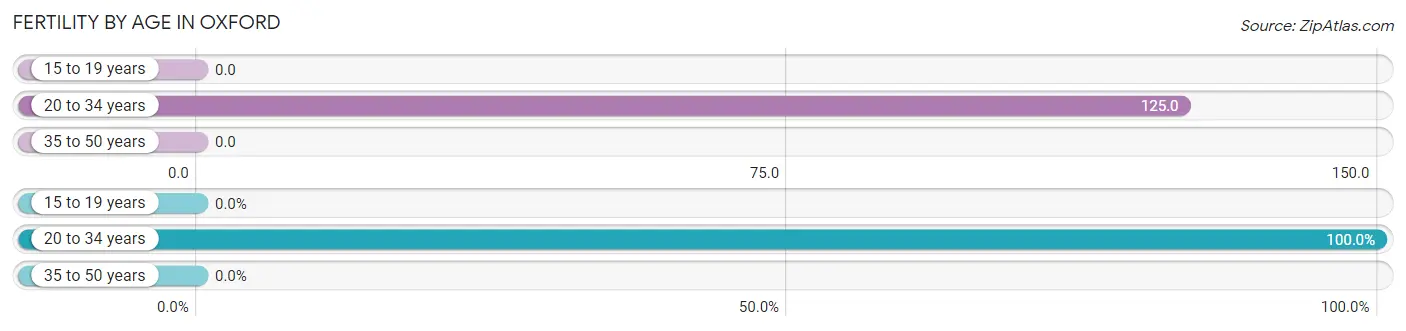
| Age Bracket | Women with Births | Births / 1,000 Women |
| 15 to 19 years | 0 (0.0%) | 0.0 |
| 20 to 34 years | 41 (100.0%) | 125.0 |
| 35 to 50 years | 0 (0.0%) | 0.0 |
| Total | 41 (100.0%) | 52.0 |
Fertility by Age by Marriage Status in Oxford
24.4% of women with births (41) in Oxford are married. The highest percentage of unmarried women with births falls into 20 to 34 years age bracket with 75.6% of them unmarried at the time of birth, while the lowest percentage of unmarried women with births belong to 20 to 34 years age bracket with 75.6% of them unmarried.
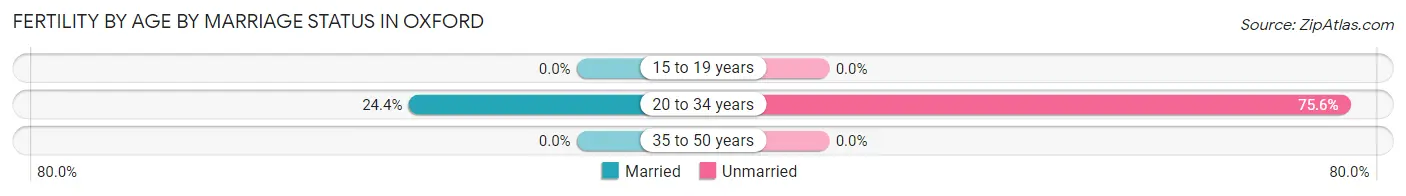
| Age Bracket | Married | Unmarried |
| 15 to 19 years | 0 (0.0%) | 0 (0.0%) |
| 20 to 34 years | 10 (24.4%) | 31 (75.6%) |
| 35 to 50 years | 0 (0.0%) | 0 (0.0%) |
| Total | 10 (24.4%) | 31 (75.6%) |
Fertility by Education in Oxford
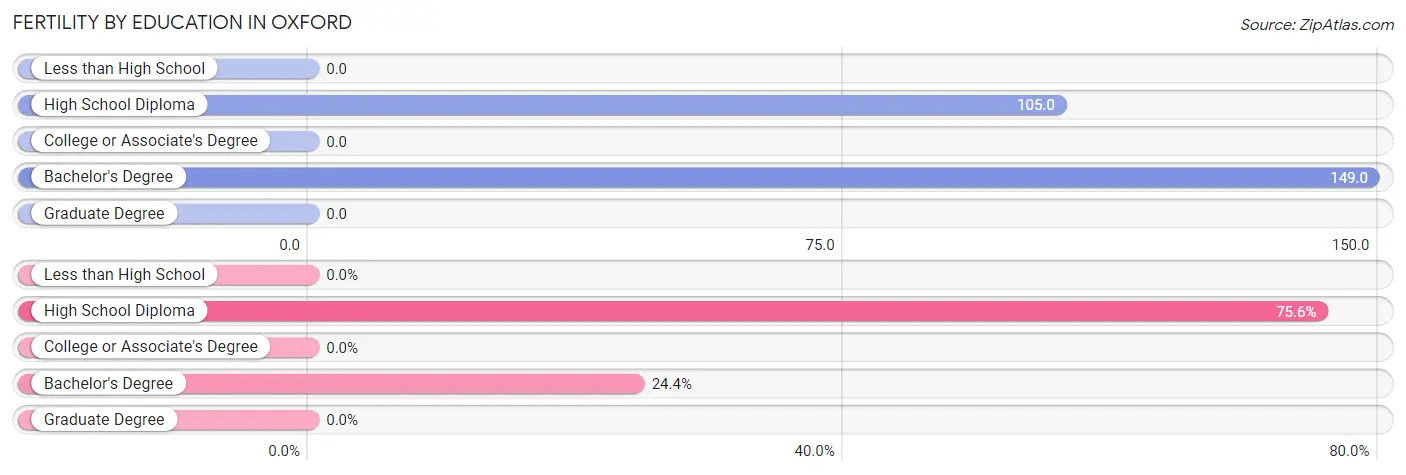
| Educational Attainment | Women with Births | Births / 1,000 Women |
| Less than High School | 0 (0.0%) | 0.0 |
| High School Diploma | 31 (75.6%) | 105.0 |
| College or Associate's Degree | 0 (0.0%) | 0.0 |
| Bachelor's Degree | 10 (24.4%) | 149.0 |
| Graduate Degree | 0 (0.0%) | 0.0 |
| Total | 41 (100.0%) | 52.0 |
Fertility by Education by Marriage Status in Oxford
75.6% of women with births in Oxford are unmarried. Women with the educational attainment of bachelor's degree are most likely to be married with 100.0% of them married at childbirth, while women with the educational attainment of high school diploma are least likely to be married with 100.0% of them unmarried at childbirth.
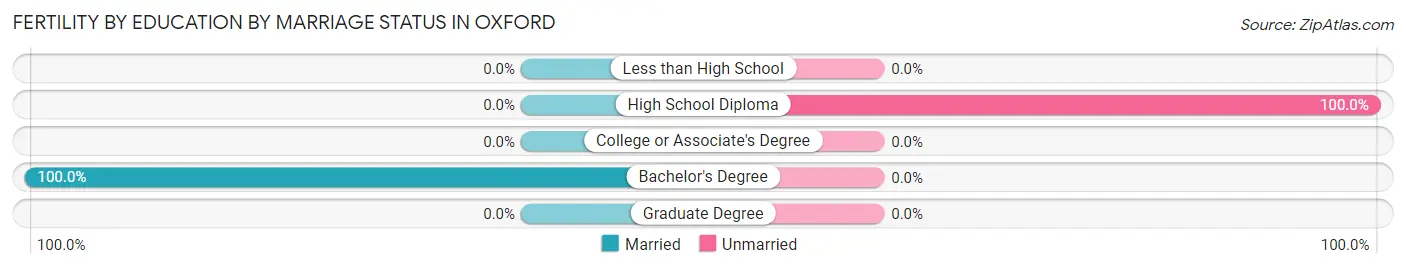
| Educational Attainment | Married | Unmarried |
| Less than High School | 0 (0.0%) | 0 (0.0%) |
| High School Diploma | 0 (0.0%) | 31 (100.0%) |
| College or Associate's Degree | 0 (0.0%) | 0 (0.0%) |
| Bachelor's Degree | 10 (100.0%) | 0 (0.0%) |
| Graduate Degree | 0 (0.0%) | 0 (0.0%) |
| Total | 10 (24.4%) | 31 (75.6%) |
Employment Characteristics in Oxford
Employment by Class of Employer in Oxford
Among the 887 employed individuals in Oxford, private company employees (617 | 69.6%), not-for-profit organizations (120 | 13.5%), and local government employees (78 | 8.8%) make up the most common classes of employment.
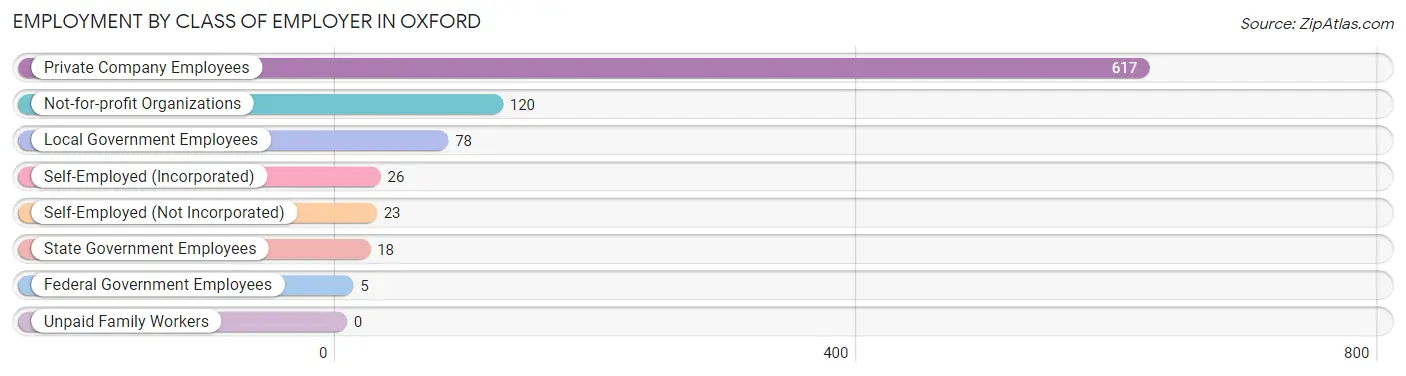
| Employer Class | # Employees | % Employees |
| Private Company Employees | 617 | 69.6% |
| Self-Employed (Incorporated) | 26 | 2.9% |
| Self-Employed (Not Incorporated) | 23 | 2.6% |
| Not-for-profit Organizations | 120 | 13.5% |
| Local Government Employees | 78 | 8.8% |
| State Government Employees | 18 | 2.0% |
| Federal Government Employees | 5 | 0.6% |
| Unpaid Family Workers | 0 | 0.0% |
| Total | 887 | 100.0% |
Employment Status by Age in Oxford
According to the labor force statistics for Oxford, out of the total population over 16 years of age (1,688), 55.6% or 939 individuals are in the labor force, with 4.6% or 43 of them unemployed. The age group with the highest labor force participation rate is 35 to 44 years, with 96.0% or 145 individuals in the labor force. Within the labor force, the 60 to 64 years age range has the highest percentage of unemployed individuals, with 16.4% or 9 of them being unemployed.
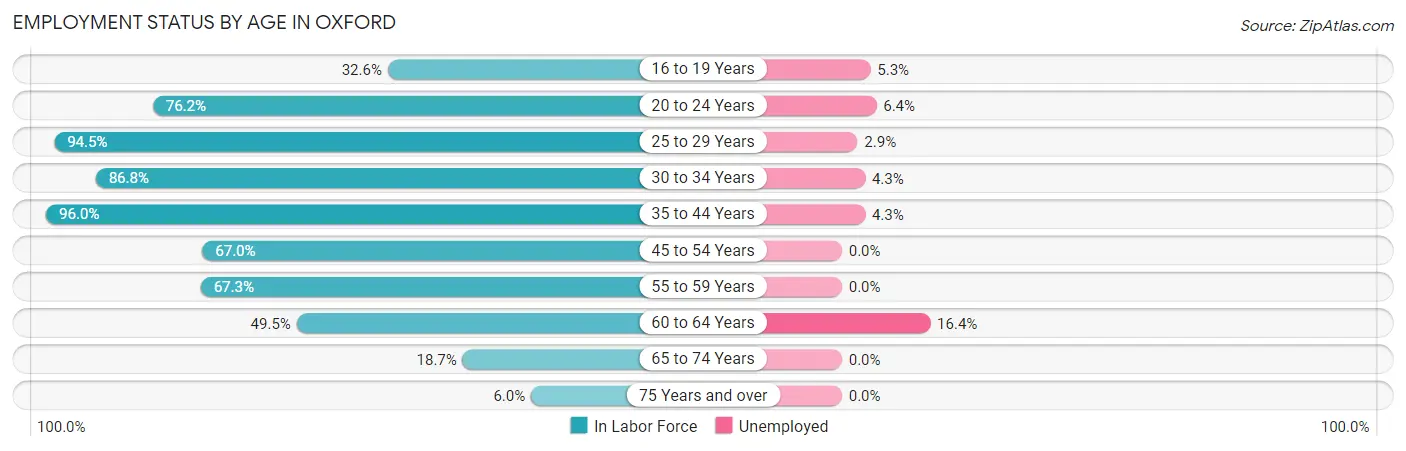
| Age Bracket | In Labor Force | Unemployed |
| 16 to 19 Years | 152 (32.6%) | 8 (5.3%) |
| 20 to 24 Years | 173 (76.2%) | 11 (6.4%) |
| 25 to 29 Years | 171 (94.5%) | 5 (2.9%) |
| 30 to 34 Years | 92 (86.8%) | 4 (4.3%) |
| 35 to 44 Years | 145 (96.0%) | 6 (4.3%) |
| 45 to 54 Years | 75 (67.0%) | 0 (0.0%) |
| 55 to 59 Years | 35 (67.3%) | 0 (0.0%) |
| 60 to 64 Years | 55 (49.5%) | 9 (16.4%) |
| 65 to 74 Years | 34 (18.7%) | 0 (0.0%) |
| 75 Years and over | 6 (6.0%) | 0 (0.0%) |
| Total | 939 (55.6%) | 43 (4.6%) |
Employment Status by Educational Attainment in Oxford
According to labor force statistics for Oxford, 80.4% of individuals (573) out of the total population between 25 and 64 years of age (713) are in the labor force, with 4.2% or 24 of them being unemployed. The group with the highest labor force participation rate are those with the educational attainment of bachelor's degree or higher, with 87.2% or 198 individuals in the labor force. Within the labor force, individuals with high school diploma education have the highest percentage of unemployment, with 7.0% or 15 of them being unemployed.
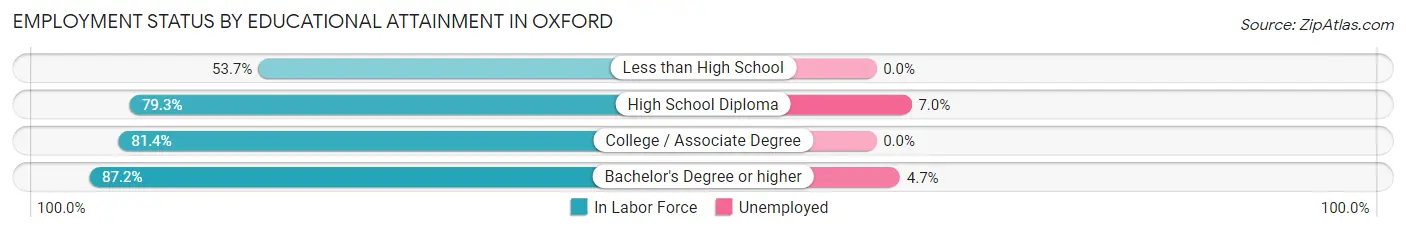
| Educational Attainment | In Labor Force | Unemployed |
| Less than High School | 29 (53.7%) | 0 (0.0%) |
| High School Diploma | 215 (79.3%) | 19 (7.0%) |
| College / Associate Degree | 131 (81.4%) | 0 (0.0%) |
| Bachelor's Degree or higher | 198 (87.2%) | 11 (4.7%) |
| Total | 573 (80.4%) | 30 (4.2%) |
Employment Occupations by Sex in Oxford
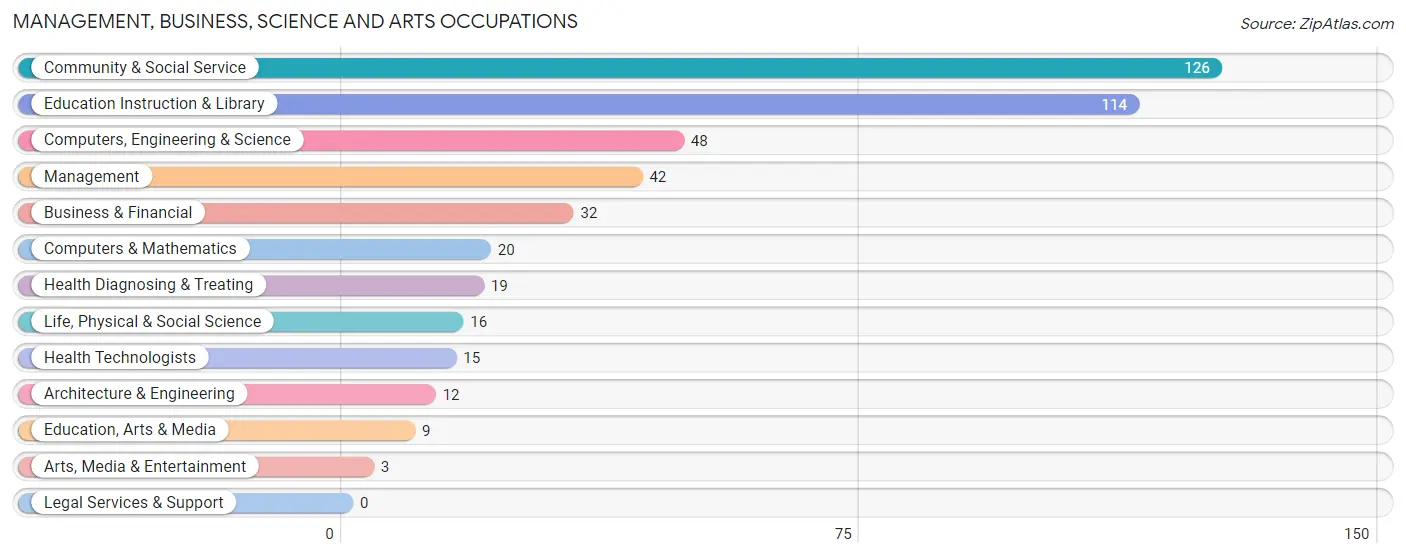
Management, Business, Science and Arts Occupations
The most common Management, Business, Science and Arts occupations in Oxford are Community & Social Service (126 | 14.2%), Education Instruction & Library (114 | 12.8%), Computers, Engineering & Science (48 | 5.4%), Management (42 | 4.7%), and Business & Financial (32 | 3.6%).
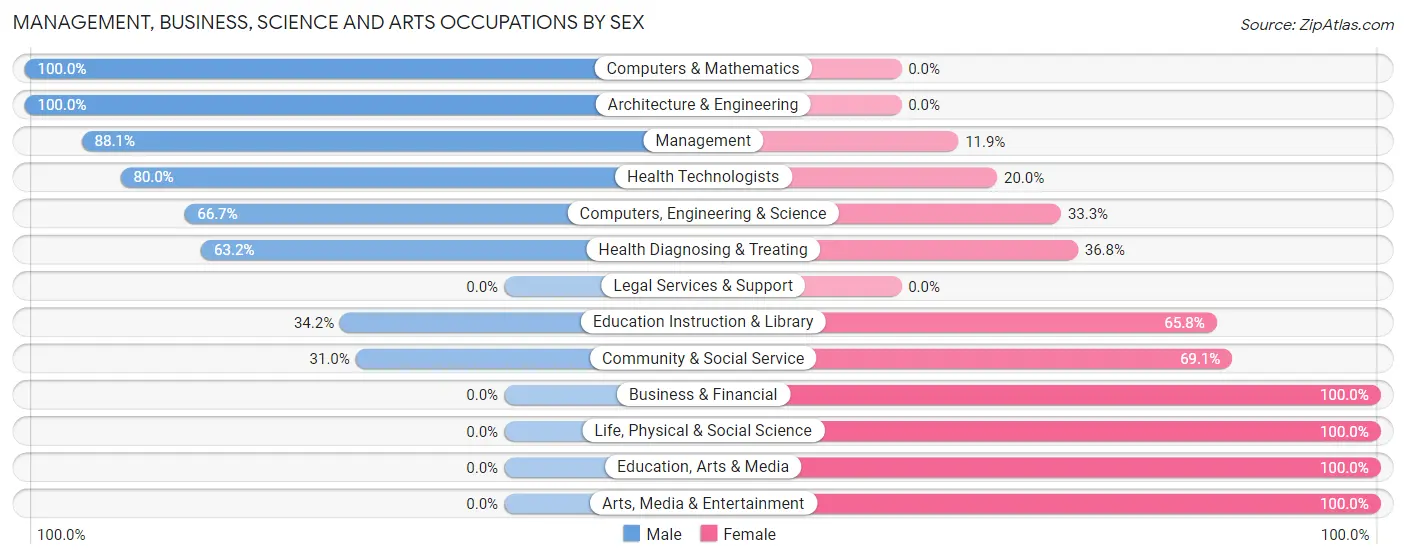
Management, Business, Science and Arts Occupations by Sex
Within the Management, Business, Science and Arts occupations in Oxford, the most male-oriented occupations are Computers & Mathematics (100.0%), Architecture & Engineering (100.0%), and Management (88.1%), while the most female-oriented occupations are Business & Financial (100.0%), Life, Physical & Social Science (100.0%), and Education, Arts & Media (100.0%).
| Occupation | Male | Female |
| Management | 37 (88.1%) | 5 (11.9%) |
| Business & Financial | 0 (0.0%) | 32 (100.0%) |
| Computers, Engineering & Science | 32 (66.7%) | 16 (33.3%) |
| Computers & Mathematics | 20 (100.0%) | 0 (0.0%) |
| Architecture & Engineering | 12 (100.0%) | 0 (0.0%) |
| Life, Physical & Social Science | 0 (0.0%) | 16 (100.0%) |
| Community & Social Service | 39 (30.9%) | 87 (69.1%) |
| Education, Arts & Media | 0 (0.0%) | 9 (100.0%) |
| Legal Services & Support | 0 (0.0%) | 0 (0.0%) |
| Education Instruction & Library | 39 (34.2%) | 75 (65.8%) |
| Arts, Media & Entertainment | 0 (0.0%) | 3 (100.0%) |
| Health Diagnosing & Treating | 12 (63.2%) | 7 (36.8%) |
| Health Technologists | 12 (80.0%) | 3 (20.0%) |
| Total (Category) | 120 (44.9%) | 147 (55.1%) |
| Total (Overall) | 429 (48.2%) | 461 (51.8%) |
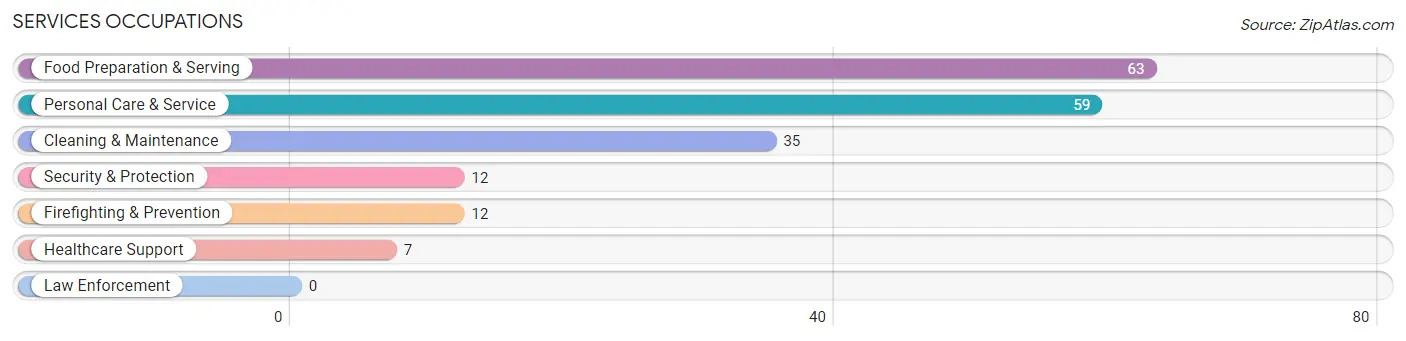
Services Occupations
The most common Services occupations in Oxford are Food Preparation & Serving (63 | 7.1%), Personal Care & Service (59 | 6.6%), Cleaning & Maintenance (35 | 3.9%), Security & Protection (12 | 1.3%), and Firefighting & Prevention (12 | 1.3%).
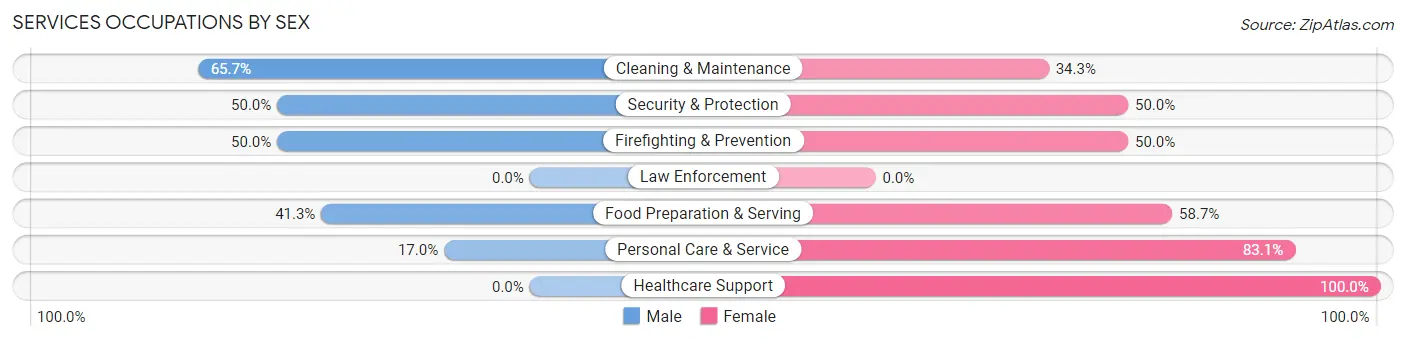
Services Occupations by Sex
Within the Services occupations in Oxford, the most male-oriented occupations are Cleaning & Maintenance (65.7%), Security & Protection (50.0%), and Firefighting & Prevention (50.0%), while the most female-oriented occupations are Healthcare Support (100.0%), Personal Care & Service (83.1%), and Food Preparation & Serving (58.7%).
| Occupation | Male | Female |
| Healthcare Support | 0 (0.0%) | 7 (100.0%) |
| Security & Protection | 6 (50.0%) | 6 (50.0%) |
| Firefighting & Prevention | 6 (50.0%) | 6 (50.0%) |
| Law Enforcement | 0 (0.0%) | 0 (0.0%) |
| Food Preparation & Serving | 26 (41.3%) | 37 (58.7%) |
| Cleaning & Maintenance | 23 (65.7%) | 12 (34.3%) |
| Personal Care & Service | 10 (17.0%) | 49 (83.1%) |
| Total (Category) | 65 (36.9%) | 111 (63.1%) |
| Total (Overall) | 429 (48.2%) | 461 (51.8%) |
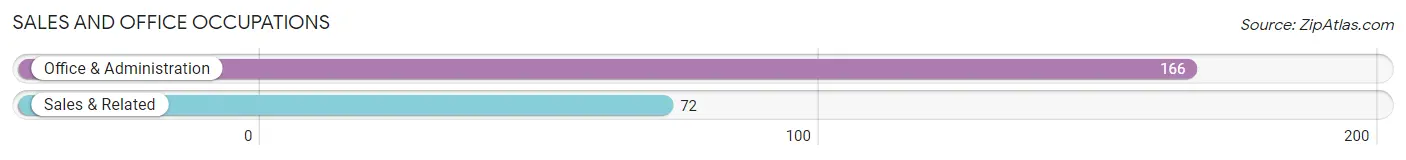
Sales and Office Occupations
The most common Sales and Office occupations in Oxford are Office & Administration (166 | 18.6%), and Sales & Related (72 | 8.1%).
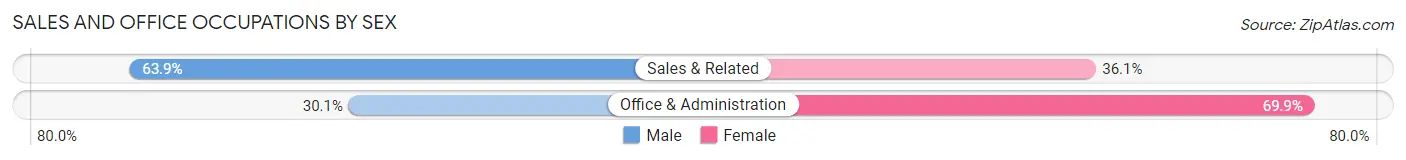
Sales and Office Occupations by Sex
| Occupation | Male | Female |
| Sales & Related | 46 (63.9%) | 26 (36.1%) |
| Office & Administration | 50 (30.1%) | 116 (69.9%) |
| Total (Category) | 96 (40.3%) | 142 (59.7%) |
| Total (Overall) | 429 (48.2%) | 461 (51.8%) |
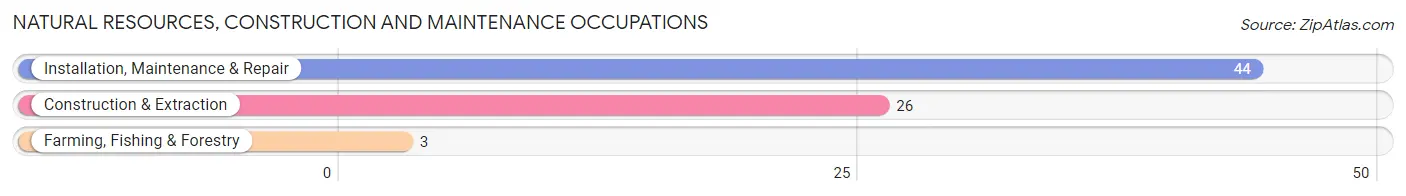
Natural Resources, Construction and Maintenance Occupations
The most common Natural Resources, Construction and Maintenance occupations in Oxford are Installation, Maintenance & Repair (44 | 4.9%), Construction & Extraction (26 | 2.9%), and Farming, Fishing & Forestry (3 | 0.3%).
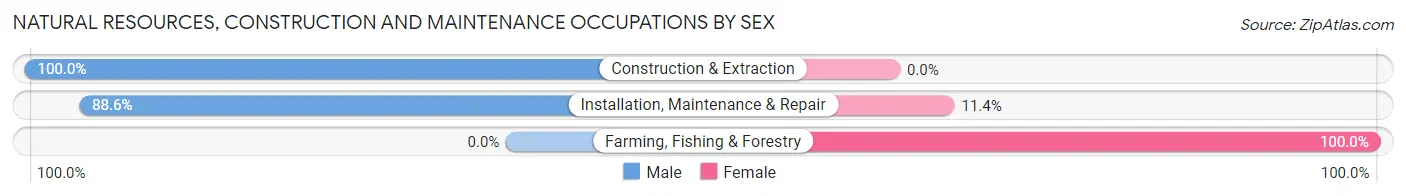
Natural Resources, Construction and Maintenance Occupations by Sex
| Occupation | Male | Female |
| Farming, Fishing & Forestry | 0 (0.0%) | 3 (100.0%) |
| Construction & Extraction | 26 (100.0%) | 0 (0.0%) |
| Installation, Maintenance & Repair | 39 (88.6%) | 5 (11.4%) |
| Total (Category) | 65 (89.0%) | 8 (11.0%) |
| Total (Overall) | 429 (48.2%) | 461 (51.8%) |
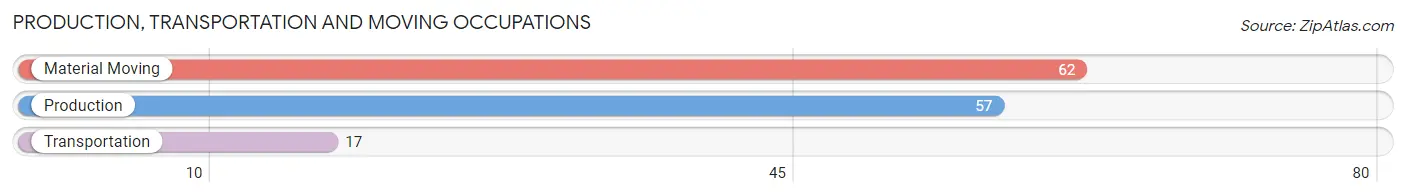
Production, Transportation and Moving Occupations
The most common Production, Transportation and Moving occupations in Oxford are Material Moving (62 | 7.0%), Production (57 | 6.4%), and Transportation (17 | 1.9%).
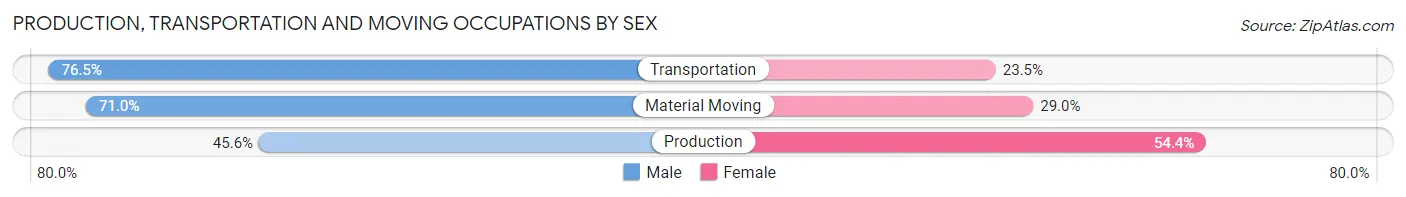
Production, Transportation and Moving Occupations by Sex
| Occupation | Male | Female |
| Production | 26 (45.6%) | 31 (54.4%) |
| Transportation | 13 (76.5%) | 4 (23.5%) |
| Material Moving | 44 (71.0%) | 18 (29.0%) |
| Total (Category) | 83 (61.0%) | 53 (39.0%) |
| Total (Overall) | 429 (48.2%) | 461 (51.8%) |
Employment Industries by Sex in Oxford
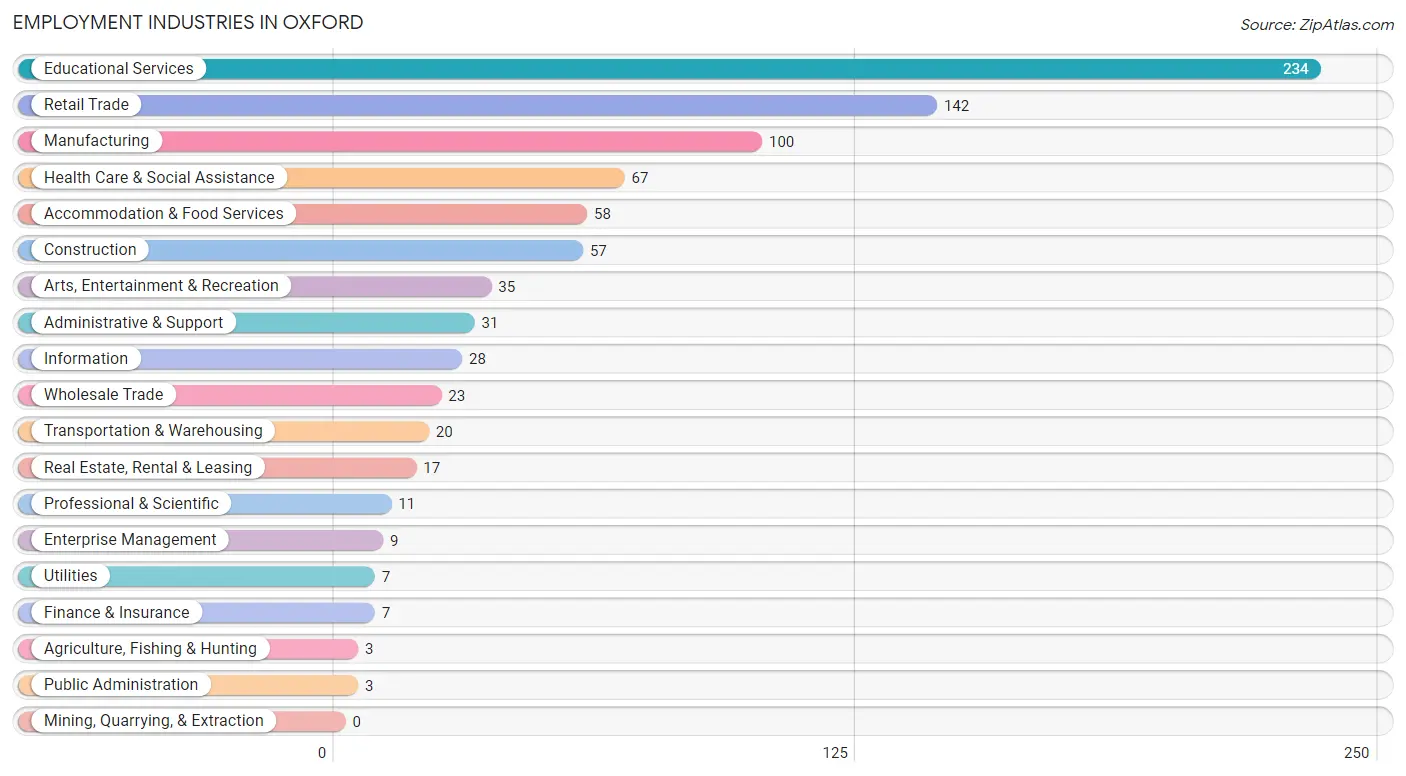
Employment Industries in Oxford
The major employment industries in Oxford include Educational Services (234 | 26.3%), Retail Trade (142 | 16.0%), Manufacturing (100 | 11.2%), Health Care & Social Assistance (67 | 7.5%), and Accommodation & Food Services (58 | 6.5%).
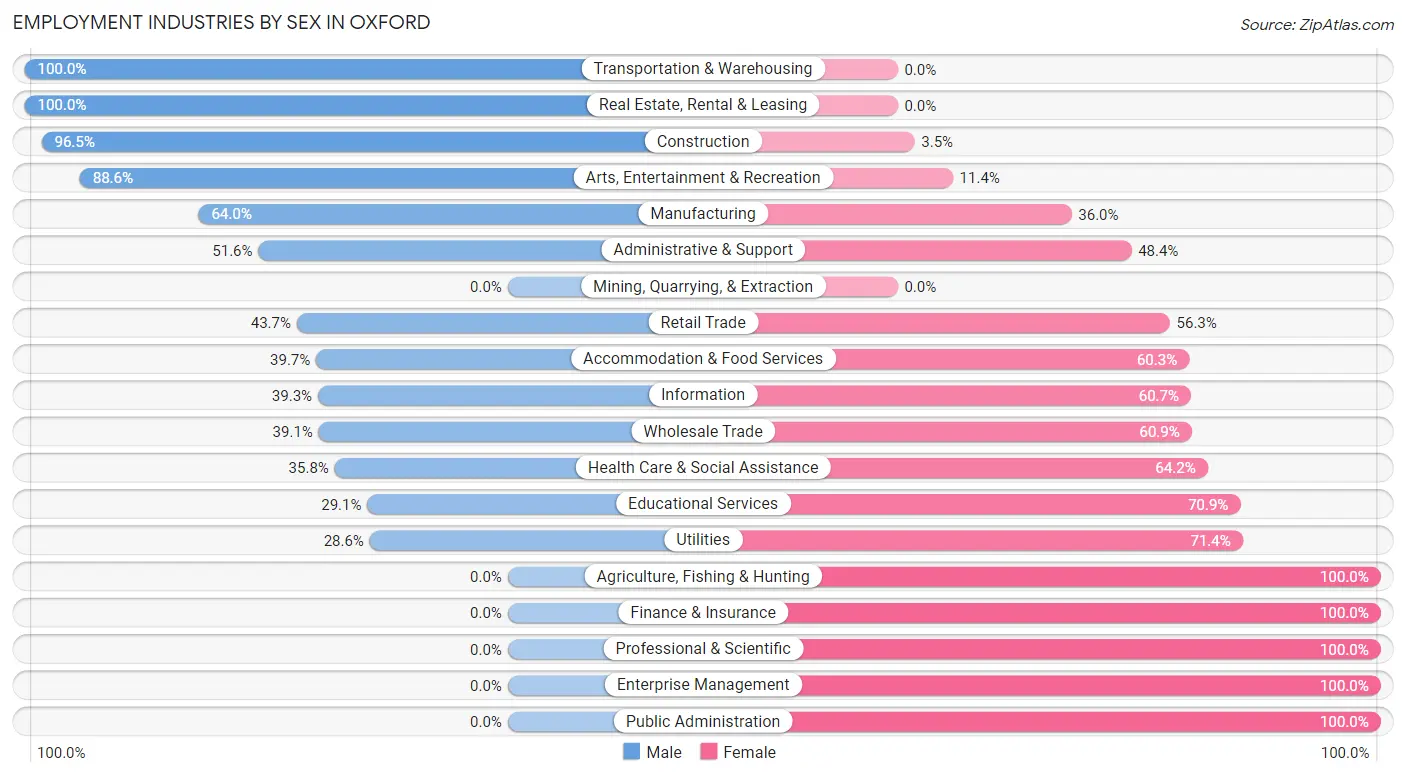
Employment Industries by Sex in Oxford
The Oxford industries that see more men than women are Transportation & Warehousing (100.0%), Real Estate, Rental & Leasing (100.0%), and Construction (96.5%), whereas the industries that tend to have a higher number of women are Agriculture, Fishing & Hunting (100.0%), Finance & Insurance (100.0%), and Professional & Scientific (100.0%).
| Industry | Male | Female |
| Agriculture, Fishing & Hunting | 0 (0.0%) | 3 (100.0%) |
| Mining, Quarrying, & Extraction | 0 (0.0%) | 0 (0.0%) |
| Construction | 55 (96.5%) | 2 (3.5%) |
| Manufacturing | 64 (64.0%) | 36 (36.0%) |
| Wholesale Trade | 9 (39.1%) | 14 (60.9%) |
| Retail Trade | 62 (43.7%) | 80 (56.3%) |
| Transportation & Warehousing | 20 (100.0%) | 0 (0.0%) |
| Utilities | 2 (28.6%) | 5 (71.4%) |
| Information | 11 (39.3%) | 17 (60.7%) |
| Finance & Insurance | 0 (0.0%) | 7 (100.0%) |
| Real Estate, Rental & Leasing | 17 (100.0%) | 0 (0.0%) |
| Professional & Scientific | 0 (0.0%) | 11 (100.0%) |
| Enterprise Management | 0 (0.0%) | 9 (100.0%) |
| Administrative & Support | 16 (51.6%) | 15 (48.4%) |
| Educational Services | 68 (29.1%) | 166 (70.9%) |
| Health Care & Social Assistance | 24 (35.8%) | 43 (64.2%) |
| Arts, Entertainment & Recreation | 31 (88.6%) | 4 (11.4%) |
| Accommodation & Food Services | 23 (39.7%) | 35 (60.3%) |
| Public Administration | 0 (0.0%) | 3 (100.0%) |
| Total | 429 (48.2%) | 461 (51.8%) |
Education in Oxford
School Enrollment in Oxford
The most common levels of schooling among the 847 students in Oxford are college / undergraduate (530 | 62.6%), elementary school (96 | 11.3%), and high school (78 | 9.2%).
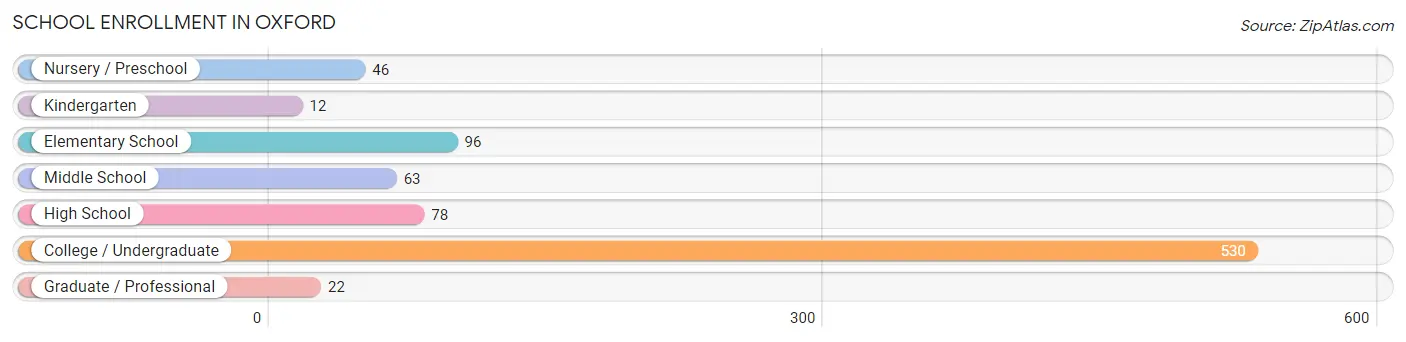
| School Level | # Students | % Students |
| Nursery / Preschool | 46 | 5.4% |
| Kindergarten | 12 | 1.4% |
| Elementary School | 96 | 11.3% |
| Middle School | 63 | 7.4% |
| High School | 78 | 9.2% |
| College / Undergraduate | 530 | 62.6% |
| Graduate / Professional | 22 | 2.6% |
| Total | 847 | 100.0% |
School Enrollment by Age by Funding Source in Oxford
Out of a total of 847 students who are enrolled in schools in Oxford, 529 (62.5%) attend a private institution, while the remaining 318 (37.5%) are enrolled in public schools. The age group of 18 to 19 year olds has the highest likelihood of being enrolled in private schools, with 368 (89.8% in the age bracket) enrolled. Conversely, the age group of 35 years and over has the lowest likelihood of being enrolled in a private school, with 22 (100.0% in the age bracket) attending a public institution.
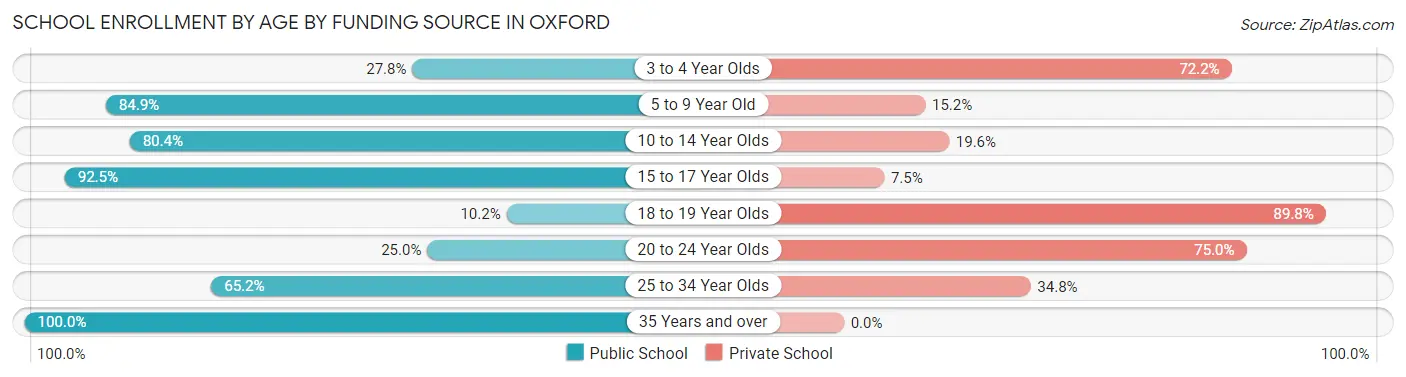
| Age Bracket | Public School | Private School |
| 3 to 4 Year Olds | 10 (27.8%) | 26 (72.2%) |
| 5 to 9 Year Old | 84 (84.9%) | 15 (15.1%) |
| 10 to 14 Year Olds | 78 (80.4%) | 19 (19.6%) |
| 15 to 17 Year Olds | 37 (92.5%) | 3 (7.5%) |
| 18 to 19 Year Olds | 42 (10.2%) | 368 (89.8%) |
| 20 to 24 Year Olds | 30 (25.0%) | 90 (75.0%) |
| 25 to 34 Year Olds | 15 (65.2%) | 8 (34.8%) |
| 35 Years and over | 22 (100.0%) | 0 (0.0%) |
| Total | 318 (37.5%) | 529 (62.5%) |
Educational Attainment by Field of Study in Oxford
Education (63 | 19.5%), liberal arts & history (52 | 16.1%), physical & health sciences (37 | 11.5%), communications (30 | 9.3%), and social sciences (24 | 7.4%) are the most common fields of study among 323 individuals in Oxford who have obtained a bachelor's degree or higher.
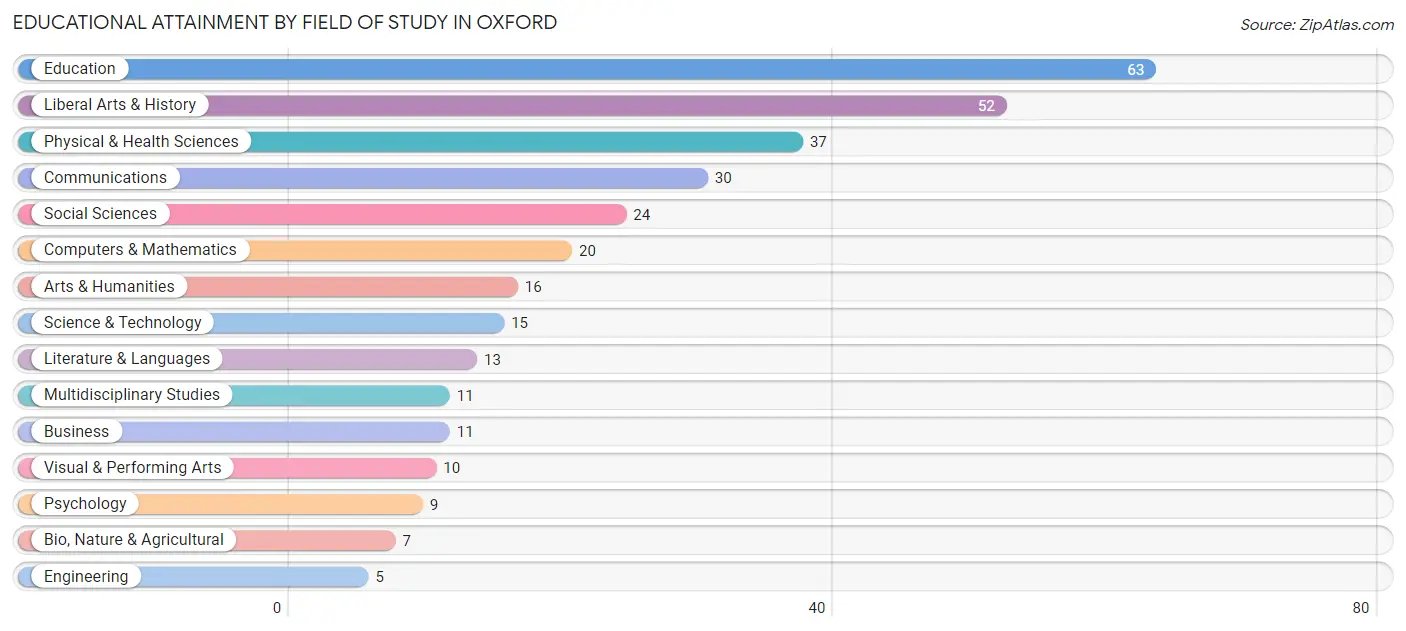
| Field of Study | # Graduates | % Graduates |
| Computers & Mathematics | 20 | 6.2% |
| Bio, Nature & Agricultural | 7 | 2.2% |
| Physical & Health Sciences | 37 | 11.5% |
| Psychology | 9 | 2.8% |
| Social Sciences | 24 | 7.4% |
| Engineering | 5 | 1.5% |
| Multidisciplinary Studies | 11 | 3.4% |
| Science & Technology | 15 | 4.6% |
| Business | 11 | 3.4% |
| Education | 63 | 19.5% |
| Literature & Languages | 13 | 4.0% |
| Liberal Arts & History | 52 | 16.1% |
| Visual & Performing Arts | 10 | 3.1% |
| Communications | 30 | 9.3% |
| Arts & Humanities | 16 | 5.0% |
| Total | 323 | 100.0% |
Transportation & Commute in Oxford
Vehicle Availability by Sex in Oxford
The most prevalent vehicle ownership categories in Oxford are males with 2 vehicles (138, accounting for 36.7%) and females with 2 vehicles (175, making up 38.2%).
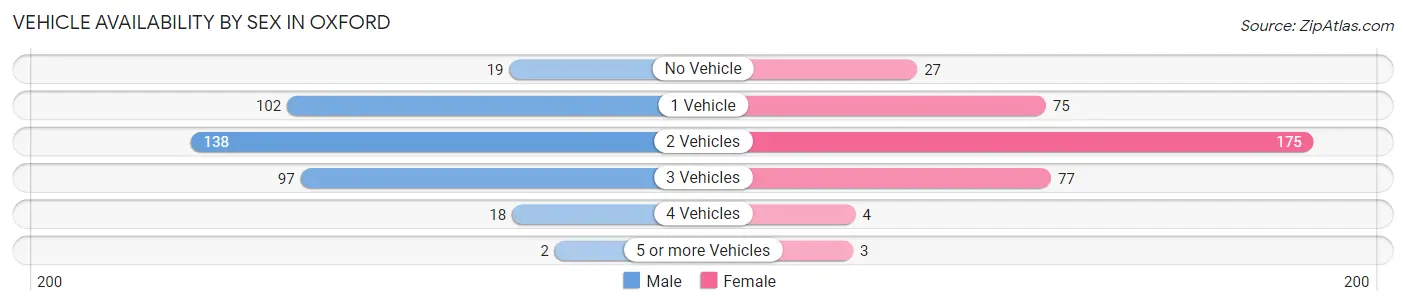
| Vehicles Available | Male | Female |
| No Vehicle | 19 (5.1%) | 27 (7.5%) |
| 1 Vehicle | 102 (27.1%) | 75 (20.8%) |
| 2 Vehicles | 138 (36.7%) | 175 (48.5%) |
| 3 Vehicles | 97 (25.8%) | 77 (21.3%) |
| 4 Vehicles | 18 (4.8%) | 4 (1.1%) |
| 5 or more Vehicles | 2 (0.5%) | 3 (0.8%) |
| Total | 376 (100.0%) | 361 (100.0%) |
Commute Time in Oxford
The most frequently occuring commute durations in Oxford are 10 to 14 minutes (143 commuters, 16.7%), 20 to 24 minutes (120 commuters, 14.0%), and less than 5 minutes (111 commuters, 13.0%).
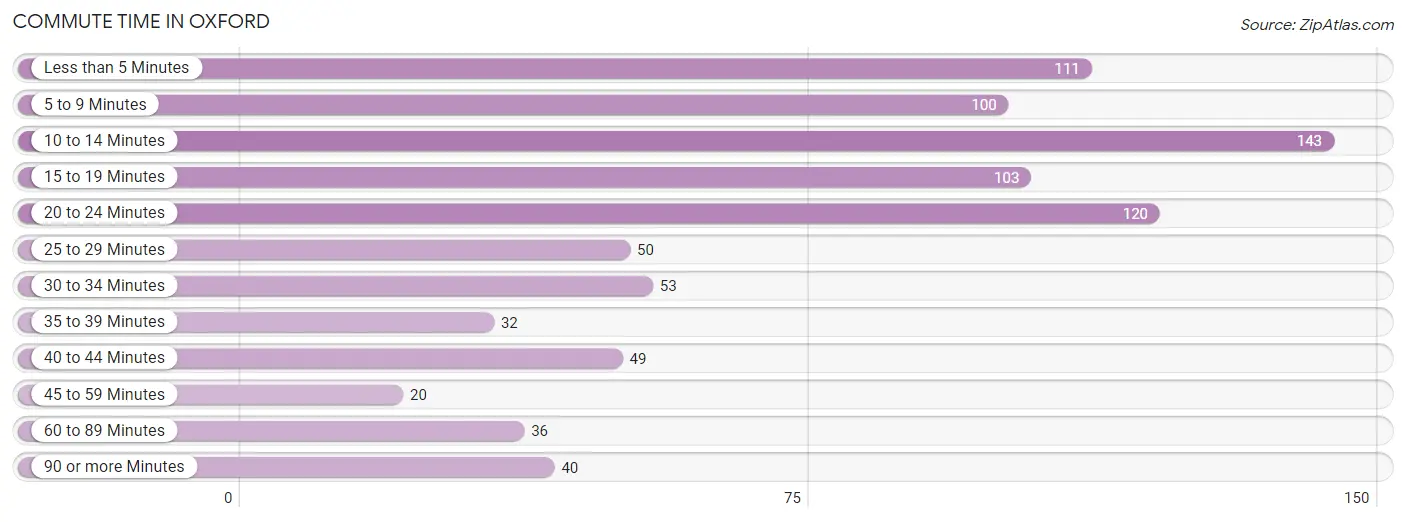
| Commute Time | # Commuters | % Commuters |
| Less than 5 Minutes | 111 | 13.0% |
| 5 to 9 Minutes | 100 | 11.7% |
| 10 to 14 Minutes | 143 | 16.7% |
| 15 to 19 Minutes | 103 | 12.0% |
| 20 to 24 Minutes | 120 | 14.0% |
| 25 to 29 Minutes | 50 | 5.8% |
| 30 to 34 Minutes | 53 | 6.2% |
| 35 to 39 Minutes | 32 | 3.7% |
| 40 to 44 Minutes | 49 | 5.7% |
| 45 to 59 Minutes | 20 | 2.3% |
| 60 to 89 Minutes | 36 | 4.2% |
| 90 or more Minutes | 40 | 4.7% |
Commute Time by Sex in Oxford
The most common commute times in Oxford are 15 to 19 minutes (86 commuters, 20.2%) for males and 20 to 24 minutes (99 commuters, 23.0%) for females.
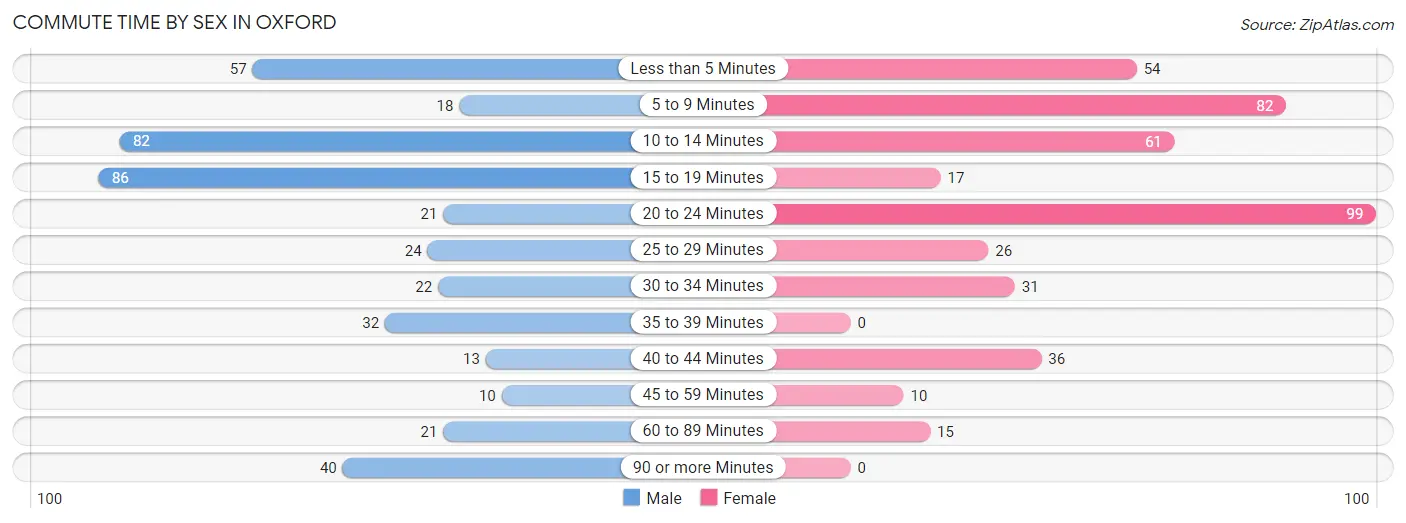
| Commute Time | Male | Female |
| Less than 5 Minutes | 57 (13.4%) | 54 (12.5%) |
| 5 to 9 Minutes | 18 (4.2%) | 82 (19.0%) |
| 10 to 14 Minutes | 82 (19.3%) | 61 (14.1%) |
| 15 to 19 Minutes | 86 (20.2%) | 17 (3.9%) |
| 20 to 24 Minutes | 21 (4.9%) | 99 (23.0%) |
| 25 to 29 Minutes | 24 (5.6%) | 26 (6.0%) |
| 30 to 34 Minutes | 22 (5.2%) | 31 (7.2%) |
| 35 to 39 Minutes | 32 (7.5%) | 0 (0.0%) |
| 40 to 44 Minutes | 13 (3.0%) | 36 (8.4%) |
| 45 to 59 Minutes | 10 (2.4%) | 10 (2.3%) |
| 60 to 89 Minutes | 21 (4.9%) | 15 (3.5%) |
| 90 or more Minutes | 40 (9.4%) | 0 (0.0%) |
Time of Departure to Work by Sex in Oxford
The most frequent times of departure to work in Oxford are 6:00 AM to 6:29 AM (61, 14.3%) for males and 4:00 PM to 11:59 PM (72, 16.7%) for females.
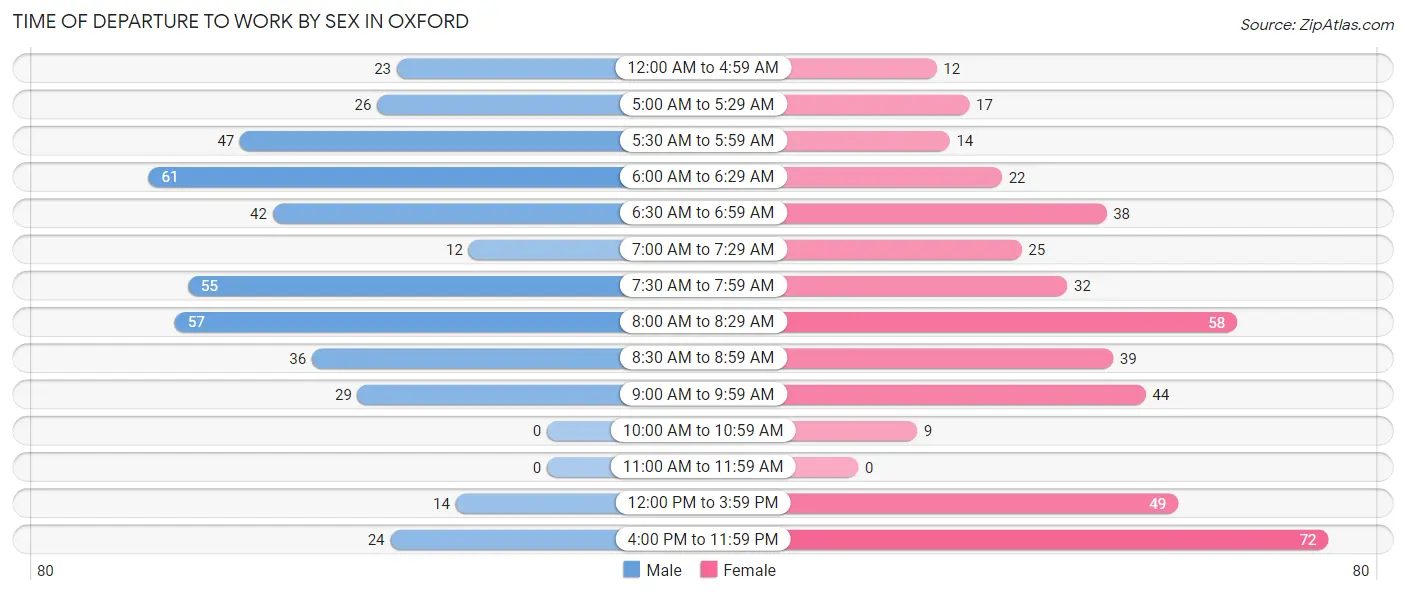
| Time of Departure | Male | Female |
| 12:00 AM to 4:59 AM | 23 (5.4%) | 12 (2.8%) |
| 5:00 AM to 5:29 AM | 26 (6.1%) | 17 (3.9%) |
| 5:30 AM to 5:59 AM | 47 (11.0%) | 14 (3.3%) |
| 6:00 AM to 6:29 AM | 61 (14.3%) | 22 (5.1%) |
| 6:30 AM to 6:59 AM | 42 (9.9%) | 38 (8.8%) |
| 7:00 AM to 7:29 AM | 12 (2.8%) | 25 (5.8%) |
| 7:30 AM to 7:59 AM | 55 (12.9%) | 32 (7.4%) |
| 8:00 AM to 8:29 AM | 57 (13.4%) | 58 (13.5%) |
| 8:30 AM to 8:59 AM | 36 (8.5%) | 39 (9.0%) |
| 9:00 AM to 9:59 AM | 29 (6.8%) | 44 (10.2%) |
| 10:00 AM to 10:59 AM | 0 (0.0%) | 9 (2.1%) |
| 11:00 AM to 11:59 AM | 0 (0.0%) | 0 (0.0%) |
| 12:00 PM to 3:59 PM | 14 (3.3%) | 49 (11.4%) |
| 4:00 PM to 11:59 PM | 24 (5.6%) | 72 (16.7%) |
| Total | 426 (100.0%) | 431 (100.0%) |
Housing Occupancy in Oxford
Occupancy by Ownership in Oxford
Of the total 661 dwellings in Oxford, owner-occupied units account for 382 (57.8%), while renter-occupied units make up 279 (42.2%).
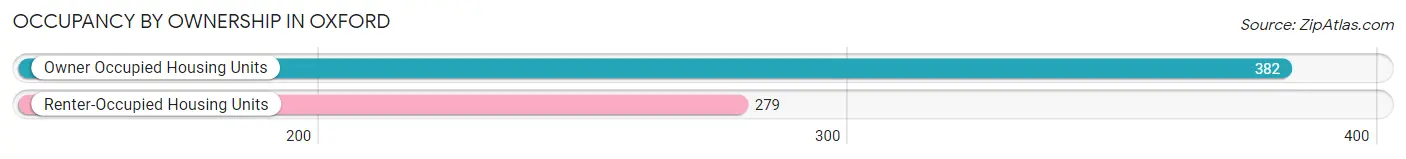
| Occupancy | # Housing Units | % Housing Units |
| Owner Occupied Housing Units | 382 | 57.8% |
| Renter-Occupied Housing Units | 279 | 42.2% |
| Total Occupied Housing Units | 661 | 100.0% |
Occupancy by Household Size in Oxford
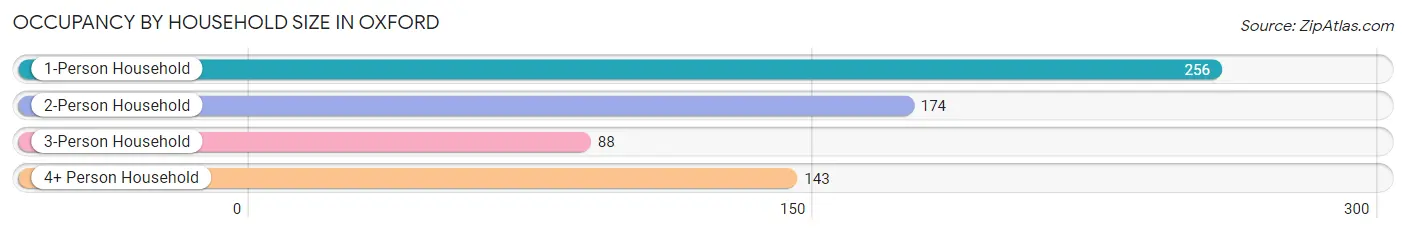
| Household Size | # Housing Units | % Housing Units |
| 1-Person Household | 256 | 38.7% |
| 2-Person Household | 174 | 26.3% |
| 3-Person Household | 88 | 13.3% |
| 4+ Person Household | 143 | 21.6% |
| Total Housing Units | 661 | 100.0% |
Occupancy by Ownership by Household Size in Oxford
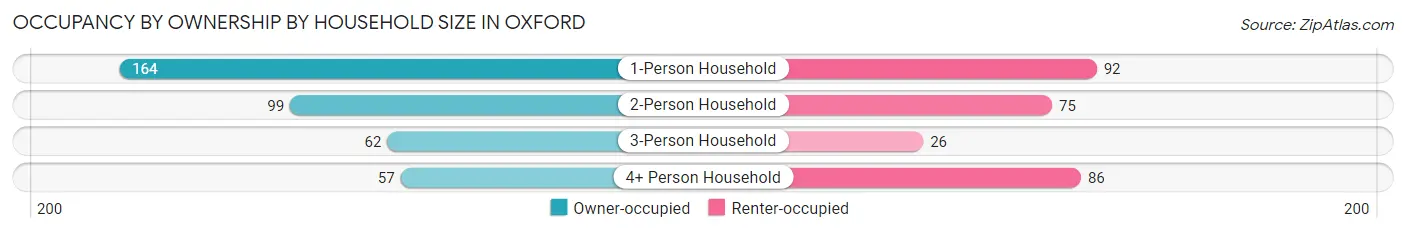
| Household Size | Owner-occupied | Renter-occupied |
| 1-Person Household | 164 (64.1%) | 92 (35.9%) |
| 2-Person Household | 99 (56.9%) | 75 (43.1%) |
| 3-Person Household | 62 (70.5%) | 26 (29.5%) |
| 4+ Person Household | 57 (39.9%) | 86 (60.1%) |
| Total Housing Units | 382 (57.8%) | 279 (42.2%) |
Occupancy by Educational Attainment in Oxford
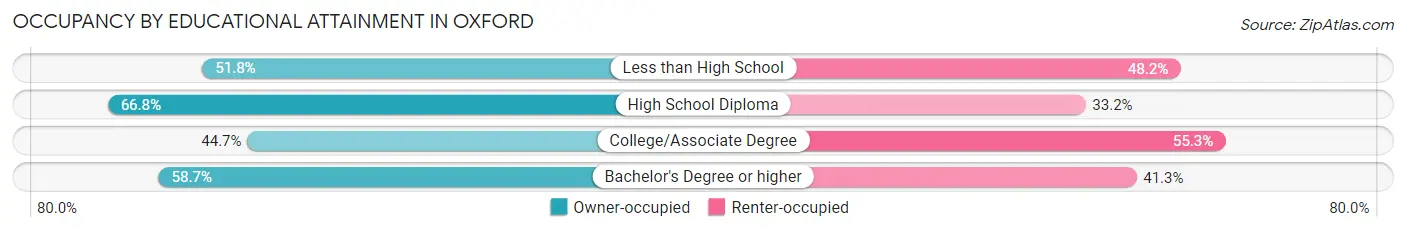
| Household Size | Owner-occupied | Renter-occupied |
| Less than High School | 29 (51.8%) | 27 (48.2%) |
| High School Diploma | 155 (66.8%) | 77 (33.2%) |
| College/Associate Degree | 67 (44.7%) | 83 (55.3%) |
| Bachelor's Degree or higher | 131 (58.7%) | 92 (41.3%) |
Occupancy by Age of Householder in Oxford
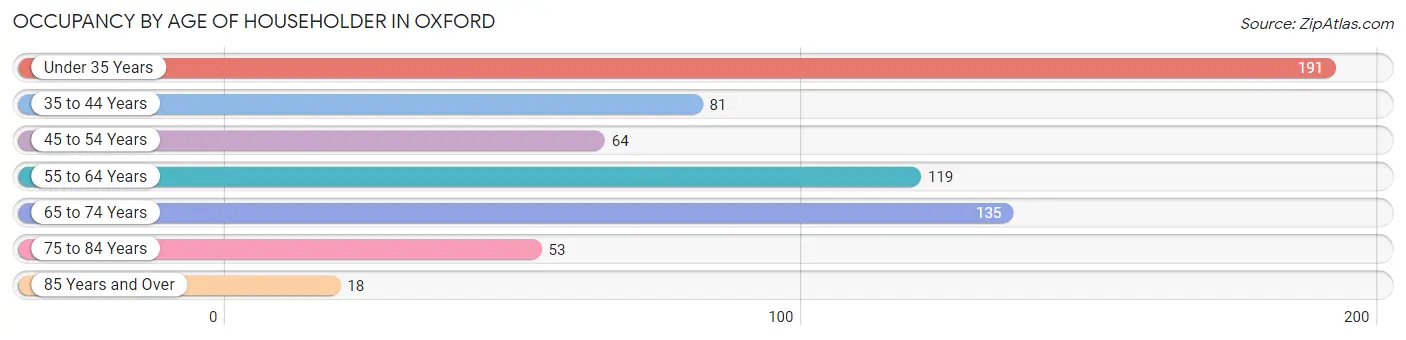
| Age Bracket | # Households | % Households |
| Under 35 Years | 191 | 28.9% |
| 35 to 44 Years | 81 | 12.2% |
| 45 to 54 Years | 64 | 9.7% |
| 55 to 64 Years | 119 | 18.0% |
| 65 to 74 Years | 135 | 20.4% |
| 75 to 84 Years | 53 | 8.0% |
| 85 Years and Over | 18 | 2.7% |
| Total | 661 | 100.0% |
Housing Finances in Oxford
Median Income by Occupancy in Oxford

| Occupancy Type | # Households | Median Income |
| Owner-Occupied | 382 (57.8%) | $61,625 |
| Renter-Occupied | 279 (42.2%) | $50,028 |
| Average | 661 (100.0%) | $51,995 |
Occupancy by Householder Income Bracket in Oxford
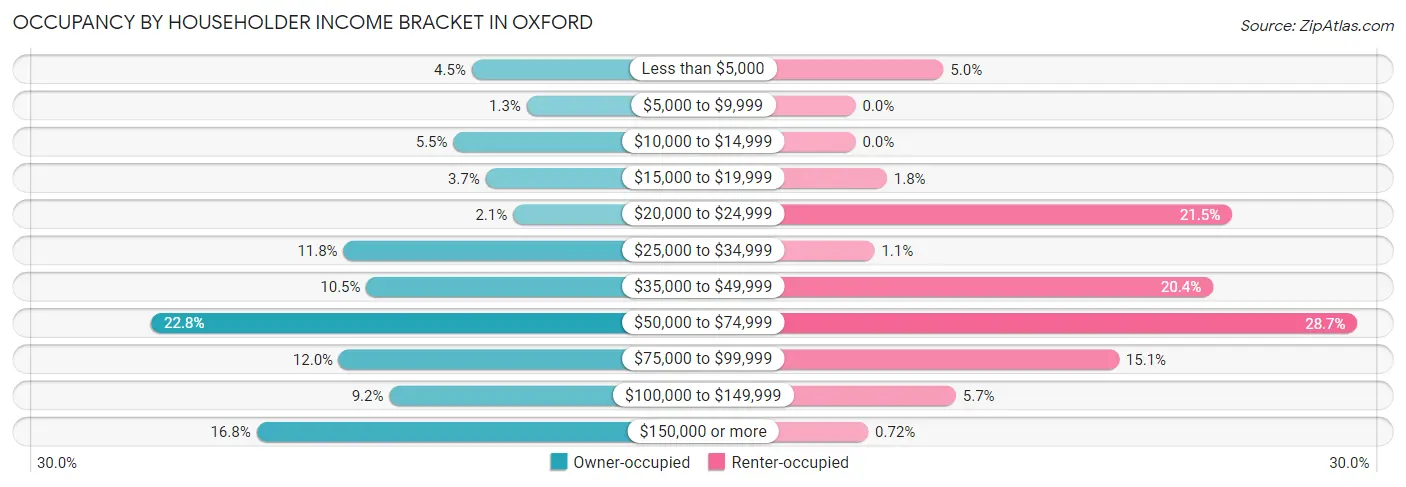
| Income Bracket | Owner-occupied | Renter-occupied |
| Less than $5,000 | 17 (4.4%) | 14 (5.0%) |
| $5,000 to $9,999 | 5 (1.3%) | 0 (0.0%) |
| $10,000 to $14,999 | 21 (5.5%) | 0 (0.0%) |
| $15,000 to $19,999 | 14 (3.7%) | 5 (1.8%) |
| $20,000 to $24,999 | 8 (2.1%) | 60 (21.5%) |
| $25,000 to $34,999 | 45 (11.8%) | 3 (1.1%) |
| $35,000 to $49,999 | 40 (10.5%) | 57 (20.4%) |
| $50,000 to $74,999 | 87 (22.8%) | 80 (28.7%) |
| $75,000 to $99,999 | 46 (12.0%) | 42 (15.0%) |
| $100,000 to $149,999 | 35 (9.2%) | 16 (5.7%) |
| $150,000 or more | 64 (16.8%) | 2 (0.7%) |
| Total | 382 (100.0%) | 279 (100.0%) |
Monthly Housing Cost Tiers in Oxford
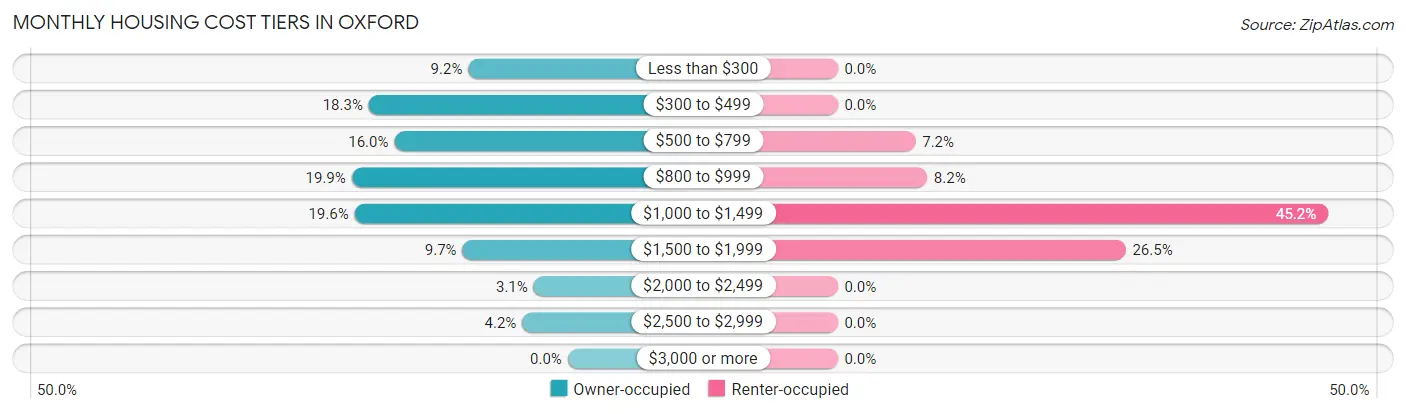
| Monthly Cost | Owner-occupied | Renter-occupied |
| Less than $300 | 35 (9.2%) | 0 (0.0%) |
| $300 to $499 | 70 (18.3%) | 0 (0.0%) |
| $500 to $799 | 61 (16.0%) | 20 (7.2%) |
| $800 to $999 | 76 (19.9%) | 23 (8.2%) |
| $1,000 to $1,499 | 75 (19.6%) | 126 (45.2%) |
| $1,500 to $1,999 | 37 (9.7%) | 74 (26.5%) |
| $2,000 to $2,499 | 12 (3.1%) | 0 (0.0%) |
| $2,500 to $2,999 | 16 (4.2%) | 0 (0.0%) |
| $3,000 or more | 0 (0.0%) | 0 (0.0%) |
| Total | 382 (100.0%) | 279 (100.0%) |
Physical Housing Characteristics in Oxford
Housing Structures in Oxford
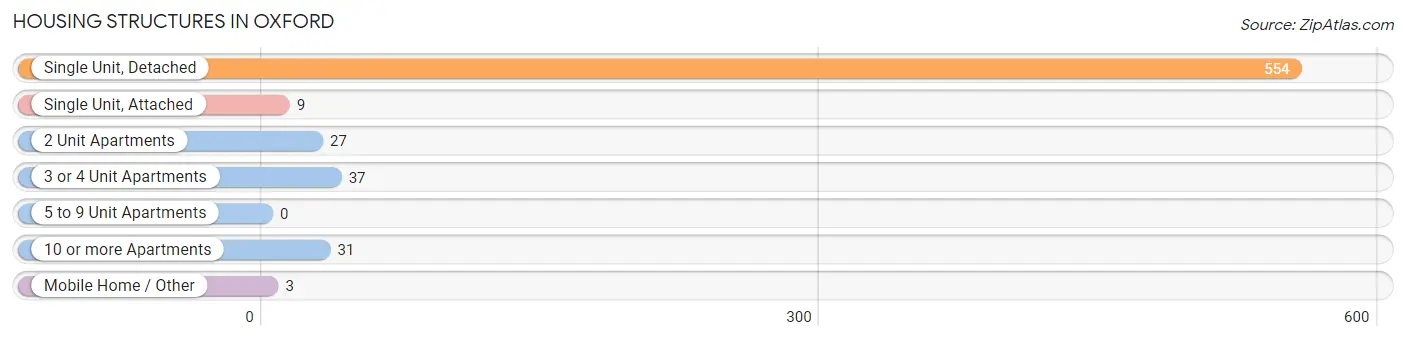
| Structure Type | # Housing Units | % Housing Units |
| Single Unit, Detached | 554 | 83.8% |
| Single Unit, Attached | 9 | 1.4% |
| 2 Unit Apartments | 27 | 4.1% |
| 3 or 4 Unit Apartments | 37 | 5.6% |
| 5 to 9 Unit Apartments | 0 | 0.0% |
| 10 or more Apartments | 31 | 4.7% |
| Mobile Home / Other | 3 | 0.4% |
| Total | 661 | 100.0% |
Housing Structures by Occupancy in Oxford
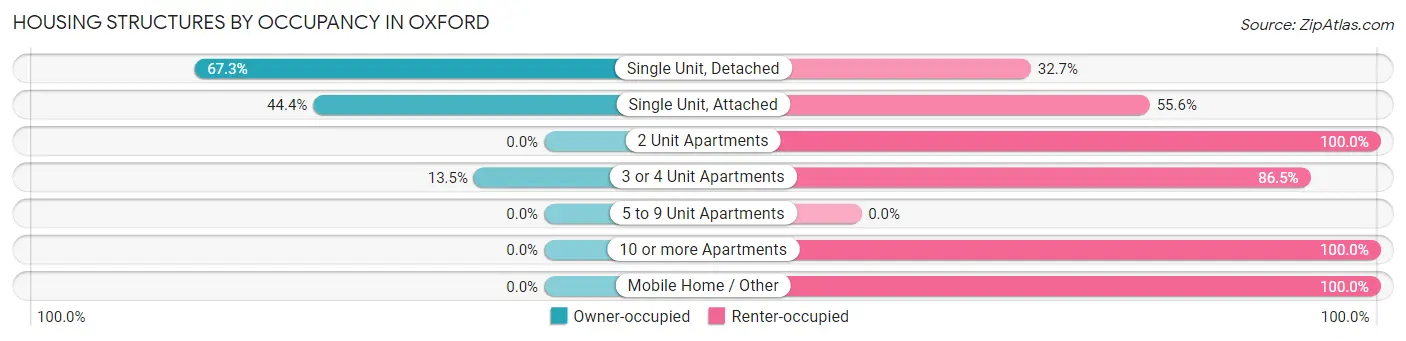
| Structure Type | Owner-occupied | Renter-occupied |
| Single Unit, Detached | 373 (67.3%) | 181 (32.7%) |
| Single Unit, Attached | 4 (44.4%) | 5 (55.6%) |
| 2 Unit Apartments | 0 (0.0%) | 27 (100.0%) |
| 3 or 4 Unit Apartments | 5 (13.5%) | 32 (86.5%) |
| 5 to 9 Unit Apartments | 0 (0.0%) | 0 (0.0%) |
| 10 or more Apartments | 0 (0.0%) | 31 (100.0%) |
| Mobile Home / Other | 0 (0.0%) | 3 (100.0%) |
| Total | 382 (57.8%) | 279 (42.2%) |
Housing Structures by Number of Rooms in Oxford
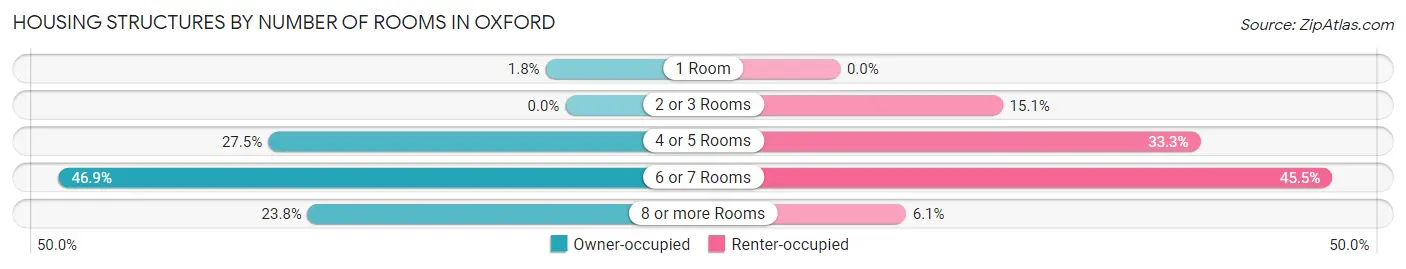
| Number of Rooms | Owner-occupied | Renter-occupied |
| 1 Room | 7 (1.8%) | 0 (0.0%) |
| 2 or 3 Rooms | 0 (0.0%) | 42 (15.0%) |
| 4 or 5 Rooms | 105 (27.5%) | 93 (33.3%) |
| 6 or 7 Rooms | 179 (46.9%) | 127 (45.5%) |
| 8 or more Rooms | 91 (23.8%) | 17 (6.1%) |
| Total | 382 (100.0%) | 279 (100.0%) |
Housing Structure by Heating Type in Oxford
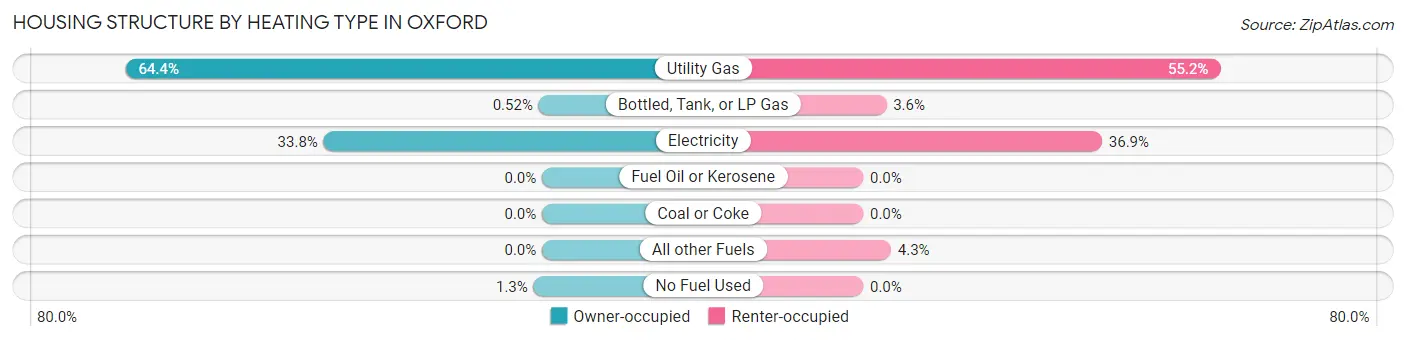
| Heating Type | Owner-occupied | Renter-occupied |
| Utility Gas | 246 (64.4%) | 154 (55.2%) |
| Bottled, Tank, or LP Gas | 2 (0.5%) | 10 (3.6%) |
| Electricity | 129 (33.8%) | 103 (36.9%) |
| Fuel Oil or Kerosene | 0 (0.0%) | 0 (0.0%) |
| Coal or Coke | 0 (0.0%) | 0 (0.0%) |
| All other Fuels | 0 (0.0%) | 12 (4.3%) |
| No Fuel Used | 5 (1.3%) | 0 (0.0%) |
| Total | 382 (100.0%) | 279 (100.0%) |
Household Vehicle Usage in Oxford
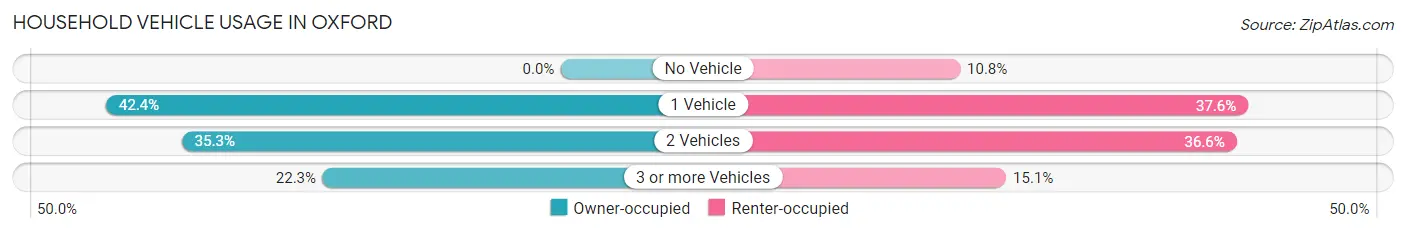
| Vehicles per Household | Owner-occupied | Renter-occupied |
| No Vehicle | 0 (0.0%) | 30 (10.7%) |
| 1 Vehicle | 162 (42.4%) | 105 (37.6%) |
| 2 Vehicles | 135 (35.3%) | 102 (36.6%) |
| 3 or more Vehicles | 85 (22.3%) | 42 (15.0%) |
| Total | 382 (100.0%) | 279 (100.0%) |
Real Estate & Mortgages in Oxford
Real Estate and Mortgage Overview in Oxford
| Characteristic | Without Mortgage | With Mortgage |
| Housing Units | 157 | 225 |
| Median Property Value | $137,000 | $160,200 |
| Median Household Income | $56,094 | $44 |
| Monthly Housing Costs | $451 | $0 |
| Real Estate Taxes | $1,011 | $0 |
Property Value by Mortgage Status in Oxford
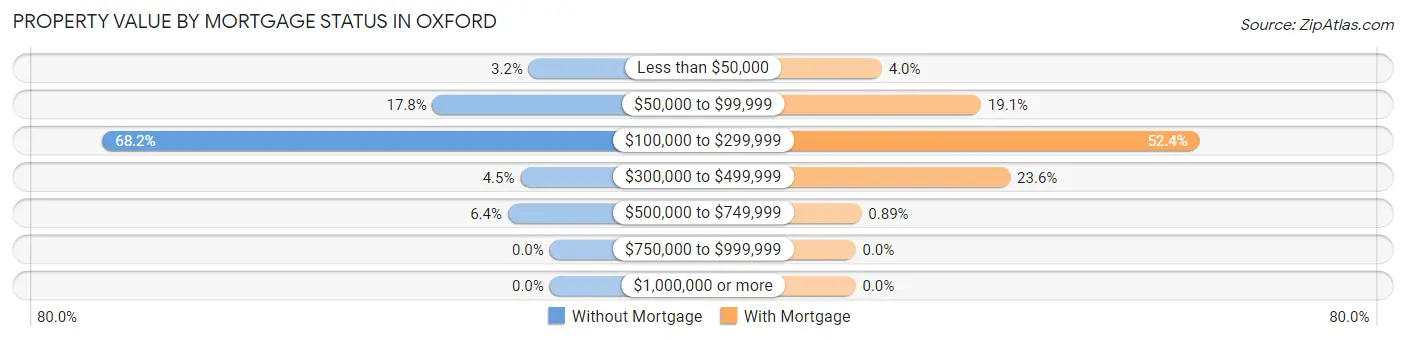
| Property Value | Without Mortgage | With Mortgage |
| Less than $50,000 | 5 (3.2%) | 9 (4.0%) |
| $50,000 to $99,999 | 28 (17.8%) | 43 (19.1%) |
| $100,000 to $299,999 | 107 (68.1%) | 118 (52.4%) |
| $300,000 to $499,999 | 7 (4.5%) | 53 (23.6%) |
| $500,000 to $749,999 | 10 (6.4%) | 2 (0.9%) |
| $750,000 to $999,999 | 0 (0.0%) | 0 (0.0%) |
| $1,000,000 or more | 0 (0.0%) | 0 (0.0%) |
| Total | 157 (100.0%) | 225 (100.0%) |
Household Income by Mortgage Status in Oxford
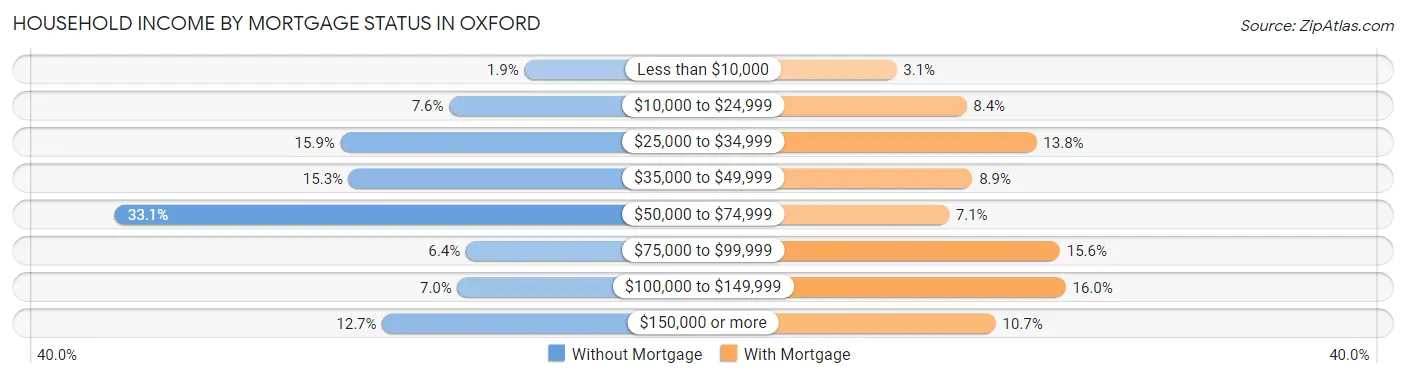
| Household Income | Without Mortgage | With Mortgage |
| Less than $10,000 | 3 (1.9%) | 7 (3.1%) |
| $10,000 to $24,999 | 12 (7.6%) | 19 (8.4%) |
| $25,000 to $34,999 | 25 (15.9%) | 31 (13.8%) |
| $35,000 to $49,999 | 24 (15.3%) | 20 (8.9%) |
| $50,000 to $74,999 | 52 (33.1%) | 16 (7.1%) |
| $75,000 to $99,999 | 10 (6.4%) | 35 (15.6%) |
| $100,000 to $149,999 | 11 (7.0%) | 36 (16.0%) |
| $150,000 or more | 20 (12.7%) | 24 (10.7%) |
| Total | 157 (100.0%) | 225 (100.0%) |
Property Value to Household Income Ratio in Oxford
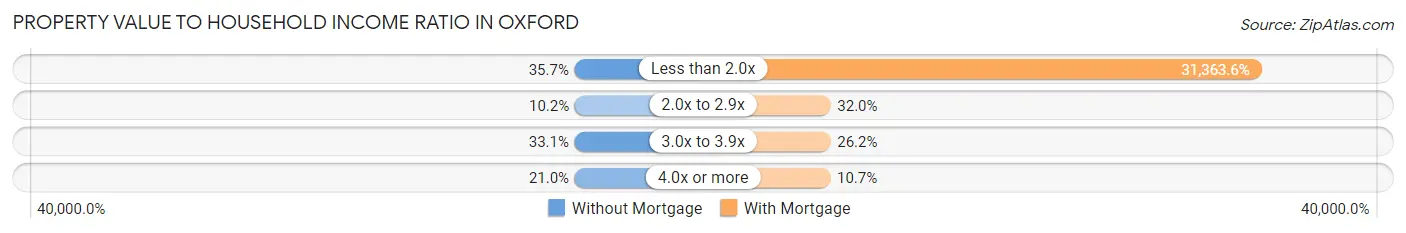
| Value-to-Income Ratio | Without Mortgage | With Mortgage |
| Less than 2.0x | 56 (35.7%) | 70,568 (31,363.6%) |
| 2.0x to 2.9x | 16 (10.2%) | 72 (32.0%) |
| 3.0x to 3.9x | 52 (33.1%) | 59 (26.2%) |
| 4.0x or more | 33 (21.0%) | 24 (10.7%) |
| Total | 157 (100.0%) | 225 (100.0%) |
Real Estate Taxes by Mortgage Status in Oxford
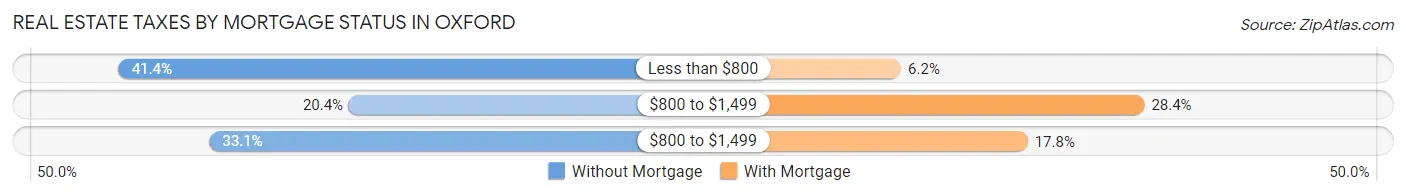
| Property Taxes | Without Mortgage | With Mortgage |
| Less than $800 | 65 (41.4%) | 14 (6.2%) |
| $800 to $1,499 | 32 (20.4%) | 64 (28.4%) |
| $800 to $1,499 | 52 (33.1%) | 40 (17.8%) |
| Total | 157 (100.0%) | 225 (100.0%) |
Health & Disability in Oxford
Health Insurance Coverage by Age in Oxford
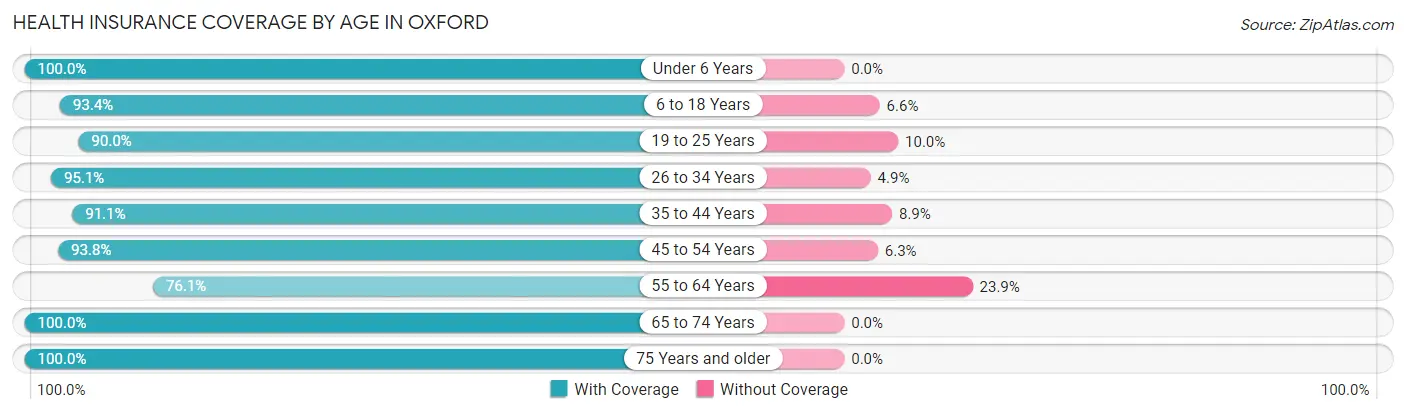
| Age Bracket | With Coverage | Without Coverage |
| Under 6 Years | 148 (100.0%) | 0 (0.0%) |
| 6 to 18 Years | 397 (93.4%) | 28 (6.6%) |
| 19 to 25 Years | 439 (90.0%) | 49 (10.0%) |
| 26 to 34 Years | 251 (95.1%) | 13 (4.9%) |
| 35 to 44 Years | 133 (91.1%) | 13 (8.9%) |
| 45 to 54 Years | 105 (93.8%) | 7 (6.2%) |
| 55 to 64 Years | 124 (76.1%) | 39 (23.9%) |
| 65 to 74 Years | 182 (100.0%) | 0 (0.0%) |
| 75 Years and older | 100 (100.0%) | 0 (0.0%) |
| Total | 1,879 (92.6%) | 149 (7.3%) |
Health Insurance Coverage by Citizenship Status in Oxford
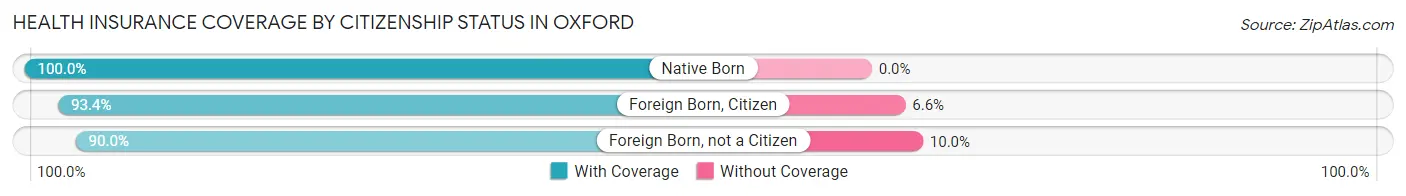
| Citizenship Status | With Coverage | Without Coverage |
| Native Born | 148 (100.0%) | 0 (0.0%) |
| Foreign Born, Citizen | 397 (93.4%) | 28 (6.6%) |
| Foreign Born, not a Citizen | 439 (90.0%) | 49 (10.0%) |
Health Insurance Coverage by Household Income in Oxford
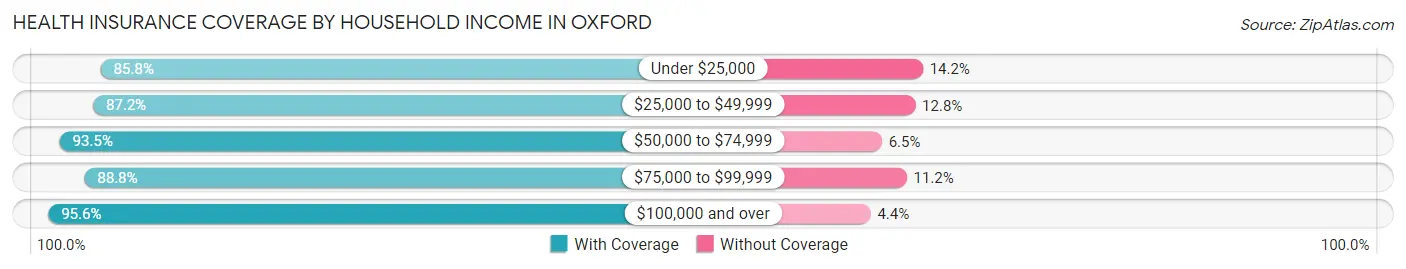
| Household Income | With Coverage | Without Coverage |
| Under $25,000 | 193 (85.8%) | 32 (14.2%) |
| $25,000 to $49,999 | 211 (87.2%) | 31 (12.8%) |
| $50,000 to $74,999 | 457 (93.5%) | 32 (6.5%) |
| $75,000 to $99,999 | 230 (88.8%) | 29 (11.2%) |
| $100,000 and over | 345 (95.6%) | 16 (4.4%) |
Public vs Private Health Insurance Coverage by Age in Oxford
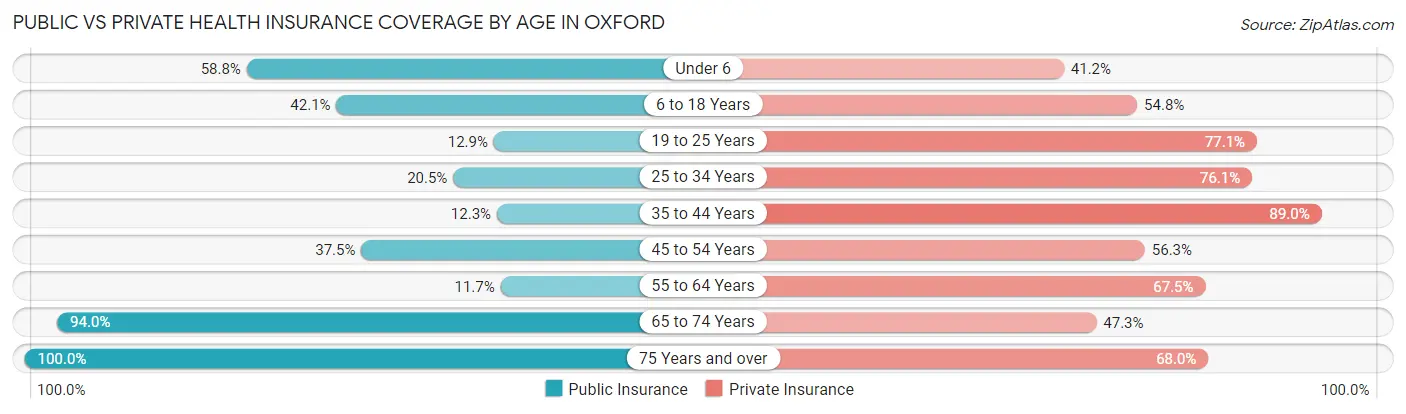
| Age Bracket | Public Insurance | Private Insurance |
| Under 6 | 87 (58.8%) | 61 (41.2%) |
| 6 to 18 Years | 179 (42.1%) | 233 (54.8%) |
| 19 to 25 Years | 63 (12.9%) | 376 (77.0%) |
| 25 to 34 Years | 54 (20.4%) | 201 (76.1%) |
| 35 to 44 Years | 18 (12.3%) | 130 (89.0%) |
| 45 to 54 Years | 42 (37.5%) | 63 (56.2%) |
| 55 to 64 Years | 19 (11.7%) | 110 (67.5%) |
| 65 to 74 Years | 171 (94.0%) | 86 (47.2%) |
| 75 Years and over | 100 (100.0%) | 68 (68.0%) |
| Total | 733 (36.1%) | 1,328 (65.5%) |
Disability Status by Sex by Age in Oxford
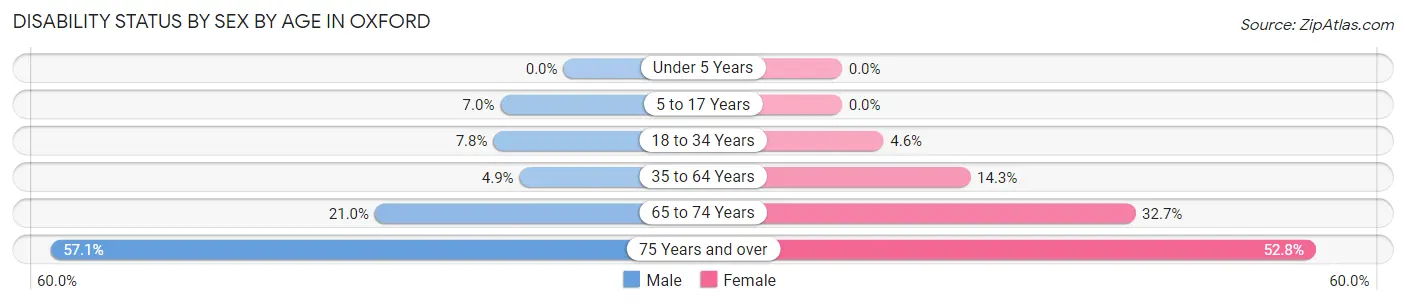
| Age Bracket | Male | Female |
| Under 5 Years | 0 (0.0%) | 0 (0.0%) |
| 5 to 17 Years | 9 (7.0%) | 0 (0.0%) |
| 18 to 34 Years | 23 (7.8%) | 30 (4.6%) |
| 35 to 64 Years | 11 (4.9%) | 28 (14.3%) |
| 65 to 74 Years | 17 (21.0%) | 33 (32.7%) |
| 75 Years and over | 16 (57.1%) | 38 (52.8%) |
Disability Class by Sex by Age in Oxford
Disability Class: Hearing Difficulty
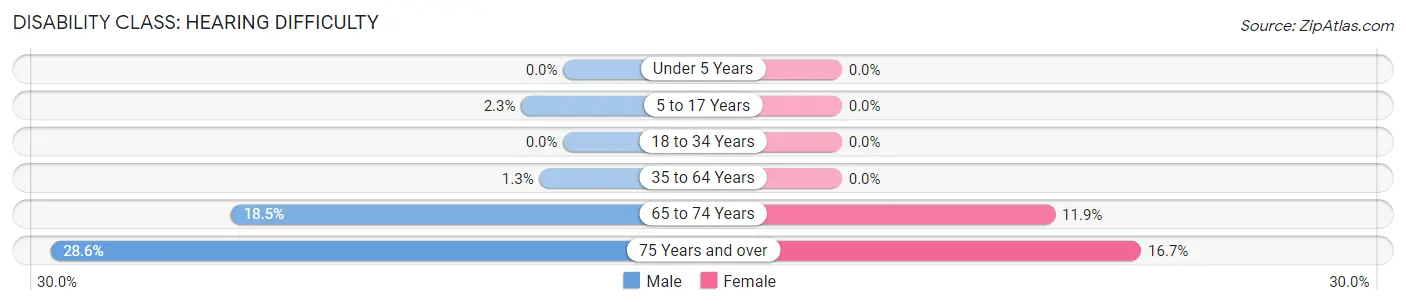
| Age Bracket | Male | Female |
| Under 5 Years | 0 (0.0%) | 0 (0.0%) |
| 5 to 17 Years | 3 (2.3%) | 0 (0.0%) |
| 18 to 34 Years | 0 (0.0%) | 0 (0.0%) |
| 35 to 64 Years | 3 (1.3%) | 0 (0.0%) |
| 65 to 74 Years | 15 (18.5%) | 12 (11.9%) |
| 75 Years and over | 8 (28.6%) | 12 (16.7%) |
Disability Class: Vision Difficulty
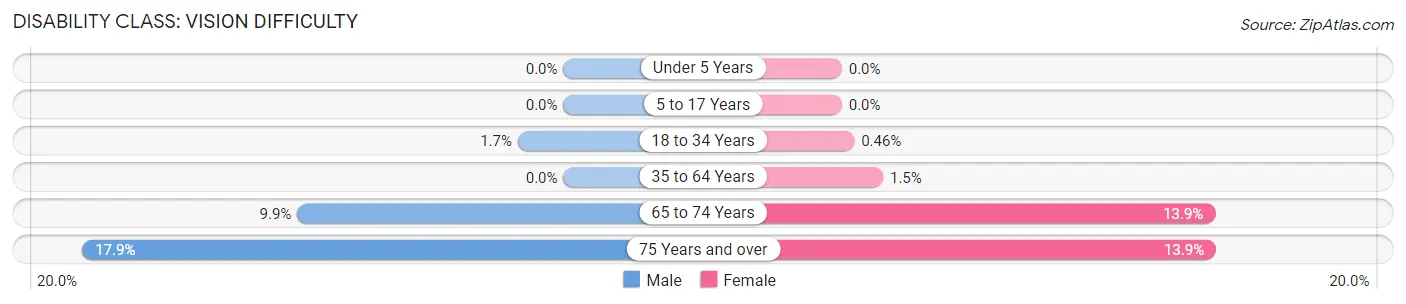
| Age Bracket | Male | Female |
| Under 5 Years | 0 (0.0%) | 0 (0.0%) |
| 5 to 17 Years | 0 (0.0%) | 0 (0.0%) |
| 18 to 34 Years | 5 (1.7%) | 3 (0.5%) |
| 35 to 64 Years | 0 (0.0%) | 3 (1.5%) |
| 65 to 74 Years | 8 (9.9%) | 14 (13.9%) |
| 75 Years and over | 5 (17.9%) | 10 (13.9%) |
Disability Class: Cognitive Difficulty
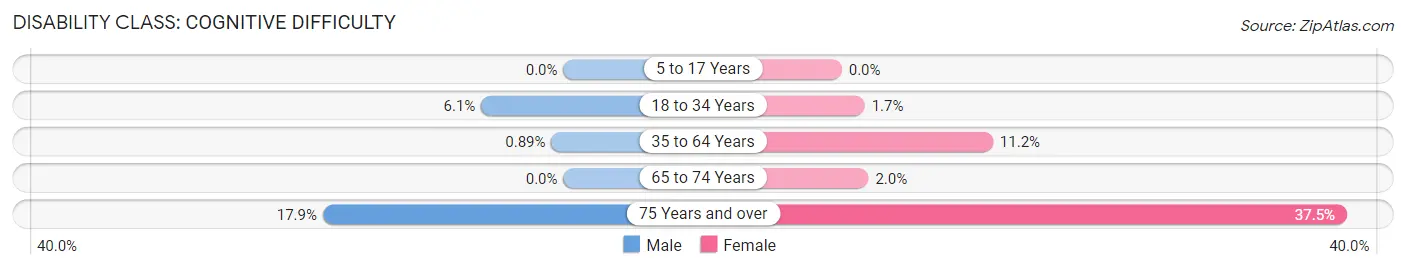
| Age Bracket | Male | Female |
| 5 to 17 Years | 0 (0.0%) | 0 (0.0%) |
| 18 to 34 Years | 18 (6.1%) | 11 (1.7%) |
| 35 to 64 Years | 2 (0.9%) | 22 (11.2%) |
| 65 to 74 Years | 0 (0.0%) | 2 (2.0%) |
| 75 Years and over | 5 (17.9%) | 27 (37.5%) |
Disability Class: Ambulatory Difficulty
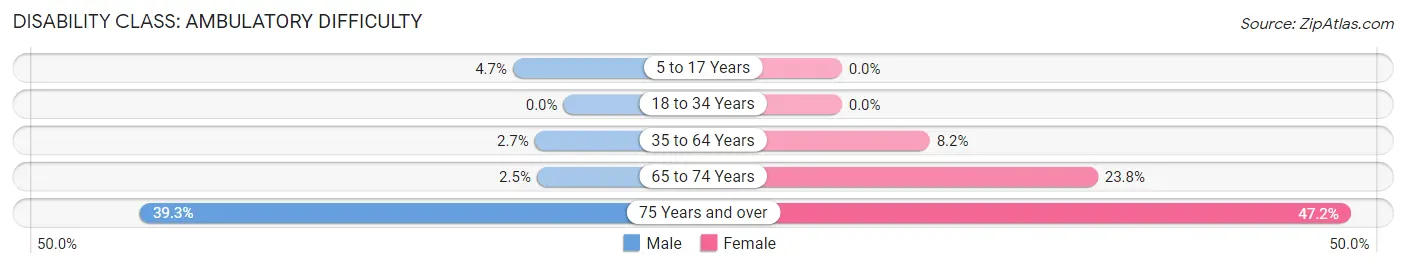
| Age Bracket | Male | Female |
| 5 to 17 Years | 6 (4.7%) | 0 (0.0%) |
| 18 to 34 Years | 0 (0.0%) | 0 (0.0%) |
| 35 to 64 Years | 6 (2.7%) | 16 (8.2%) |
| 65 to 74 Years | 2 (2.5%) | 24 (23.8%) |
| 75 Years and over | 11 (39.3%) | 34 (47.2%) |
Disability Class: Self-Care Difficulty
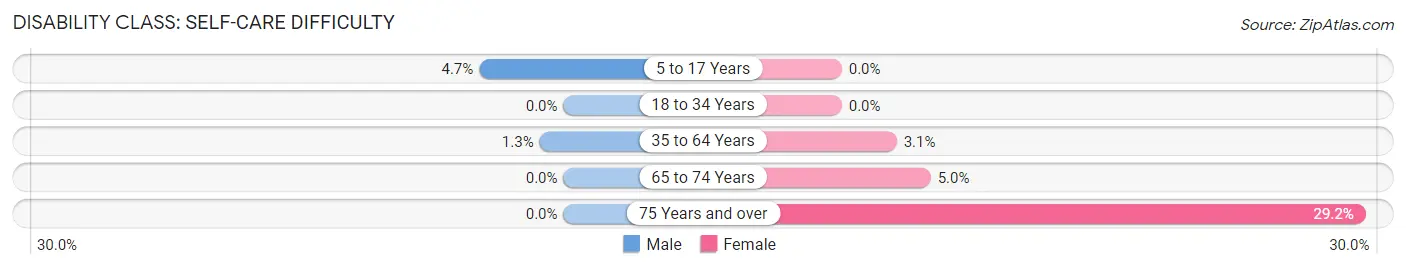
| Age Bracket | Male | Female |
| 5 to 17 Years | 6 (4.7%) | 0 (0.0%) |
| 18 to 34 Years | 0 (0.0%) | 0 (0.0%) |
| 35 to 64 Years | 3 (1.3%) | 6 (3.1%) |
| 65 to 74 Years | 0 (0.0%) | 5 (5.0%) |
| 75 Years and over | 0 (0.0%) | 21 (29.2%) |
Technology Access in Oxford
Computing Device Access in Oxford
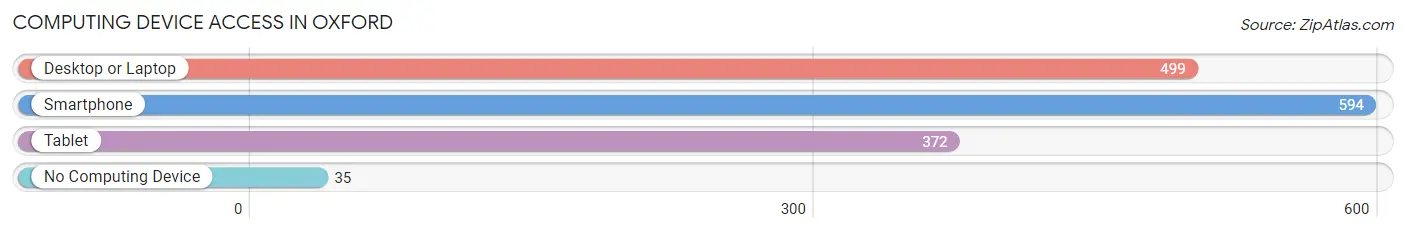
| Device Type | # Households | % Households |
| Desktop or Laptop | 499 | 75.5% |
| Smartphone | 594 | 89.9% |
| Tablet | 372 | 56.3% |
| No Computing Device | 35 | 5.3% |
| Total | 661 | 100.0% |
Internet Access in Oxford
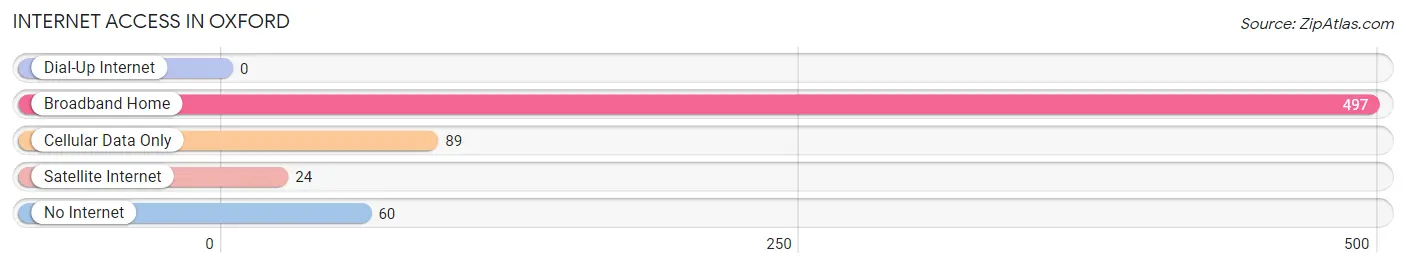
| Internet Type | # Households | % Households |
| Dial-Up Internet | 0 | 0.0% |
| Broadband Home | 497 | 75.2% |
| Cellular Data Only | 89 | 13.5% |
| Satellite Internet | 24 | 3.6% |
| No Internet | 60 | 9.1% |
| Total | 661 | 100.0% |
Oxford Summary
Oxford, Georgia is a small city located in Newton County, Georgia, United States. It is part of the Atlanta metropolitan area and is located approximately 40 miles east of downtown Atlanta. The city has a population of approximately 9,000 people and is the county seat of Newton County.
History
Oxford was founded in 1839 and was originally known as “Newton”. The city was named after the Revolutionary War hero, General John Newton. The city was incorporated in 1871 and was named after the English city of Oxford.
Oxford was a major center of cotton production in the 19th century and was home to several cotton mills. The city was also home to a large number of Confederate soldiers during the Civil War. After the war, the city experienced a period of economic decline, but was able to recover in the late 19th century.
Geography
Oxford is located in the Piedmont region of Georgia, approximately 40 miles east of downtown Atlanta. The city is situated on the banks of the Yellow River and is surrounded by rolling hills and forests. The city has a total area of 8.2 square miles, of which 8.1 square miles is land and 0.1 square miles is water.
Economy
Oxford’s economy is largely based on manufacturing and agriculture. The city is home to several manufacturing plants, including a paper mill, a furniture factory, and a plastics plant. The city is also home to several agricultural businesses, including a dairy farm, a poultry farm, and a vegetable farm.
The city is also home to several retail stores, restaurants, and other businesses. The city is also home to several educational institutions, including Oxford College of Emory University and Oxford High School.
Demographics
As of the 2010 census, the population of Oxford was 8,907. The racial makeup of the city was 79.2% White, 16.2% African American, 0.3% Native American, 0.7% Asian, 0.1% Pacific Islander, 1.7% from other races, and 1.8% from two or more races. Hispanic or Latino of any race were 4.2% of the population.
The median income for a household in the city was $37,917, and the median income for a family was $45,938. The per capita income for the city was $19,945. About 11.2% of families and 14.2% of the population were below the poverty line, including 19.2% of those under age 18 and 8.2% of those age 65 or over.
Oxford is a small city with a rich history and a diverse economy. The city is home to several manufacturing plants, agricultural businesses, and educational institutions. The city has a population of approximately 9,000 people and is the county seat of Newton County.
Common Questions
What is Per Capita Income in Oxford?
Per Capita income in Oxford is $26,567.
What is the Median Family Income in Oxford?
Median Family Income in Oxford is $63,125.
What is the Median Household income in Oxford?
Median Household Income in Oxford is $51,995.
What is Income or Wage Gap in Oxford?
Income or Wage Gap in Oxford is 51.9%.
Women in Oxford earn 48.1 cents for every dollar earned by a man.
What is Family Income Deficit in Oxford?
Family Income Deficit in Oxford is $6,891.
Families that are below poverty line in Oxford earn $6,891 less on average than the poverty threshold level.
What is Inequality or Gini Index in Oxford?
Inequality or Gini Index in Oxford is 0.46.
What is the Total Population of Oxford?
Total Population of Oxford is 2,033.
What is the Total Male Population of Oxford?
Total Male Population of Oxford is 835.
What is the Total Female Population of Oxford?
Total Female Population of Oxford is 1,198.
What is the Ratio of Males per 100 Females in Oxford?
There are 69.70 Males per 100 Females in Oxford.
What is the Ratio of Females per 100 Males in Oxford?
There are 143.47 Females per 100 Males in Oxford.
What is the Median Population Age in Oxford?
Median Population Age in Oxford is 24.4 Years.
What is the Average Family Size in Oxford
Average Family Size in Oxford is 3.2 People.
What is the Average Household Size in Oxford
Average Household Size in Oxford is 2.4 People.
How Large is the Labor Force in Oxford?
There are 939 People in the Labor Forcein in Oxford.
What is the Percentage of People in the Labor Force in Oxford?
55.6% of People are in the Labor Force in Oxford.
What is the Unemployment Rate in Oxford?
Unemployment Rate in Oxford is 4.6%.