Ball Ground, GA Map & Demographics
Ball Ground Map
Ball Ground Overview
$44,086
PER CAPITA INCOME
$101,250
AVG FAMILY INCOME
$103,429
AVG HOUSEHOLD INCOME
40.3%
WAGE / INCOME GAP [ % ]
59.7¢/ $1
WAGE / INCOME GAP [ $ ]
0.33
INEQUALITY / GINI INDEX
2,527
TOTAL POPULATION
1,348
MALE POPULATION
1,179
FEMALE POPULATION
114.33
MALES / 100 FEMALES
87.46
FEMALES / 100 MALES
38.5
MEDIAN AGE
2.9
AVG FAMILY SIZE
2.5
AVG HOUSEHOLD SIZE
1,504
LABOR FORCE [ PEOPLE ]
74.4%
PERCENT IN LABOR FORCE
3.6%
UNEMPLOYMENT RATE
Ball Ground Zip Codes
Income in Ball Ground
Income Overview in Ball Ground
Per Capita Income in Ball Ground is $44,086, while median incomes of families and households are $101,250 and $103,429 respectively.
| Characteristic | Number | Measure |
| Per Capita Income | 2,527 | $44,086 |
| Median Family Income | 724 | $101,250 |
| Mean Family Income | 724 | $110,515 |
| Median Household Income | 1,006 | $103,429 |
| Mean Household Income | 1,006 | $108,847 |
| Income Deficit | 724 | $0 |
| Wage / Income Gap (%) | 2,527 | 40.26% |
| Wage / Income Gap ($) | 2,527 | 59.74¢ per $1 |
| Gini / Inequality Index | 2,527 | 0.33 |
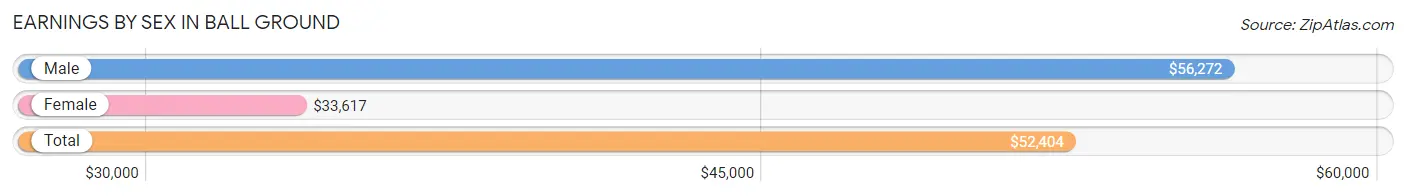
Earnings by Sex in Ball Ground
Average Earnings in Ball Ground are $52,404, $56,272 for men and $33,617 for women, a difference of 40.3%.
| Sex | Number | Average Earnings |
| Male | 895 (58.2%) | $56,272 |
| Female | 643 (41.8%) | $33,617 |
| Total | 1,538 (100.0%) | $52,404 |
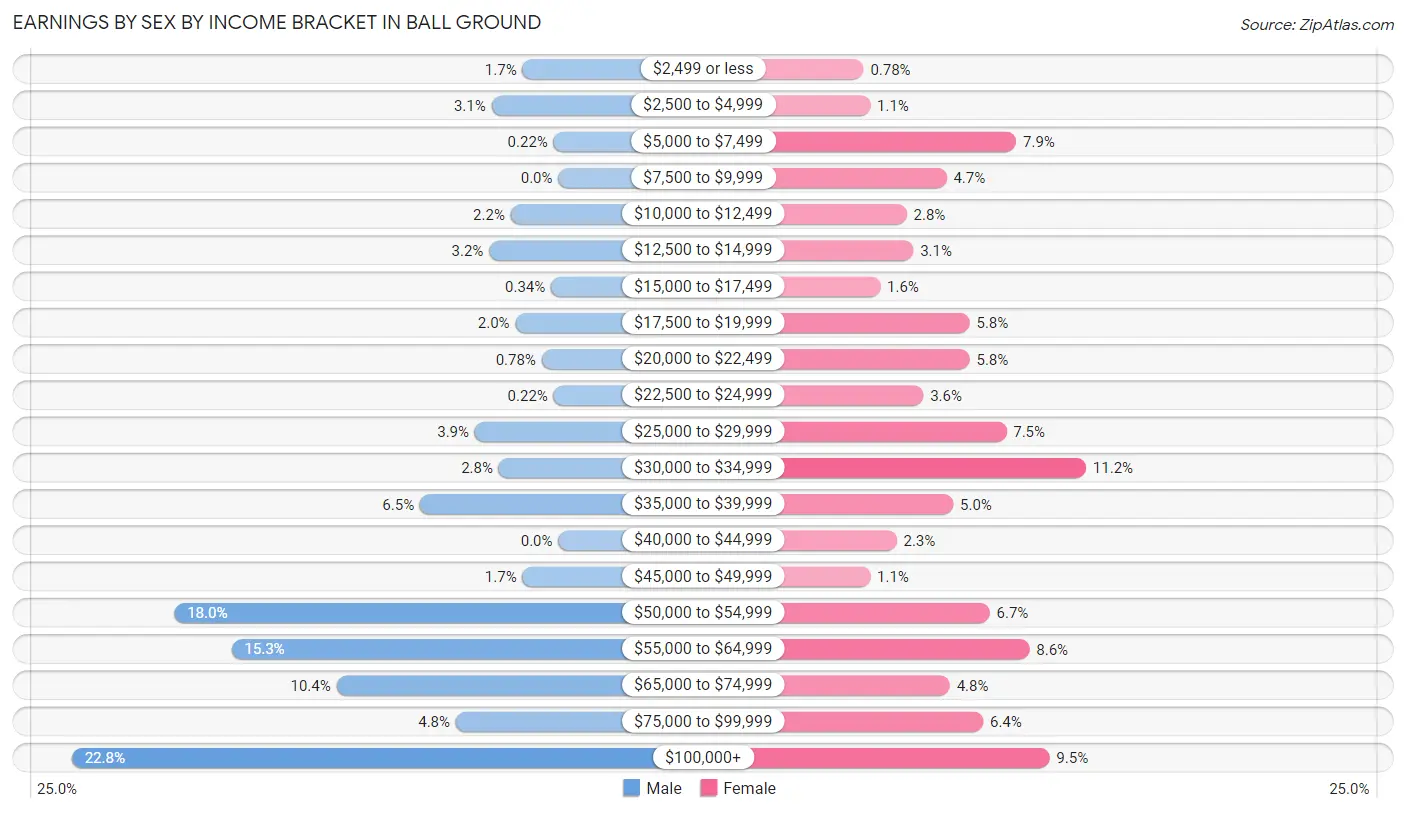
Earnings by Sex by Income Bracket in Ball Ground
The most common earnings brackets in Ball Ground are $100,000+ for men (204 | 22.8%) and $30,000 to $34,999 for women (72 | 11.2%).
| Income | Male | Female |
| $2,499 or less | 15 (1.7%) | 5 (0.8%) |
| $2,500 to $4,999 | 28 (3.1%) | 7 (1.1%) |
| $5,000 to $7,499 | 2 (0.2%) | 51 (7.9%) |
| $7,500 to $9,999 | 0 (0.0%) | 30 (4.7%) |
| $10,000 to $12,499 | 20 (2.2%) | 18 (2.8%) |
| $12,500 to $14,999 | 29 (3.2%) | 20 (3.1%) |
| $15,000 to $17,499 | 3 (0.3%) | 10 (1.6%) |
| $17,500 to $19,999 | 18 (2.0%) | 37 (5.8%) |
| $20,000 to $22,499 | 7 (0.8%) | 37 (5.8%) |
| $22,500 to $24,999 | 2 (0.2%) | 23 (3.6%) |
| $25,000 to $29,999 | 35 (3.9%) | 48 (7.5%) |
| $30,000 to $34,999 | 25 (2.8%) | 72 (11.2%) |
| $35,000 to $39,999 | 58 (6.5%) | 32 (5.0%) |
| $40,000 to $44,999 | 0 (0.0%) | 15 (2.3%) |
| $45,000 to $49,999 | 15 (1.7%) | 7 (1.1%) |
| $50,000 to $54,999 | 161 (18.0%) | 43 (6.7%) |
| $55,000 to $64,999 | 137 (15.3%) | 55 (8.6%) |
| $65,000 to $74,999 | 93 (10.4%) | 31 (4.8%) |
| $75,000 to $99,999 | 43 (4.8%) | 41 (6.4%) |
| $100,000+ | 204 (22.8%) | 61 (9.5%) |
| Total | 895 (100.0%) | 643 (100.0%) |
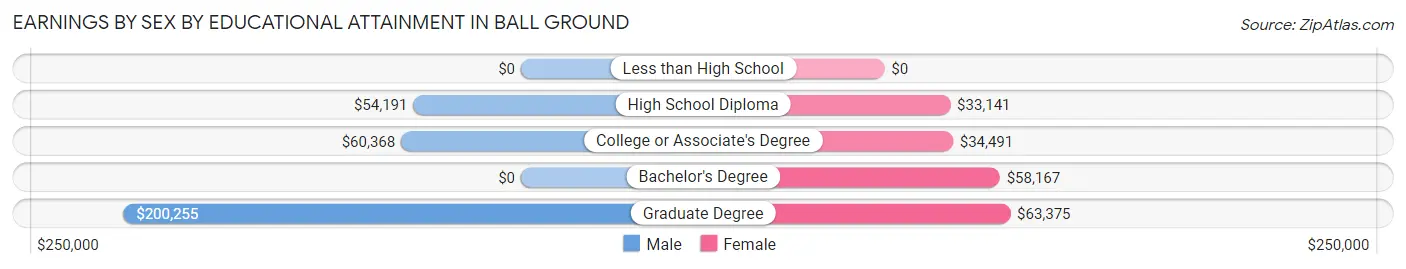
Earnings by Sex by Educational Attainment in Ball Ground
Average earnings in Ball Ground are $58,229 for men and $35,677 for women, a difference of 38.7%. Men with an educational attainment of graduate degree enjoy the highest average annual earnings of $200,255, while those with high school diploma education earn the least with $54,191. Women with an educational attainment of graduate degree earn the most with the average annual earnings of $63,375, while those with high school diploma education have the smallest earnings of $33,141.
| Educational Attainment | Male Income | Female Income |
| Less than High School | - | - |
| High School Diploma | $54,191 | $33,141 |
| College or Associate's Degree | $60,368 | $34,491 |
| Bachelor's Degree | - | - |
| Graduate Degree | $200,255 | $63,375 |
| Total | $58,229 | $35,677 |
Family Income in Ball Ground
Family Income Brackets in Ball Ground
According to the Ball Ground family income data, there are 231 families falling into the $100,000 to $149,999 income range, which is the most common income bracket and makes up 31.9% of all families. Conversely, the $10,000 to $14,999 income bracket is the least frequent group with only 7 families (1.0%) belonging to this category.
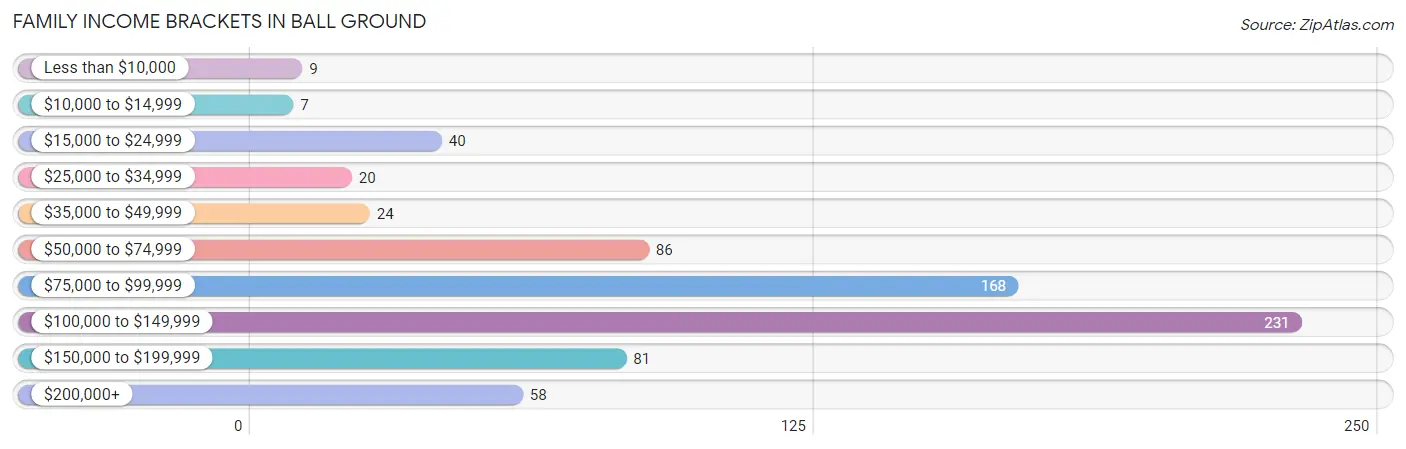
| Income Bracket | # Families | % Families |
| Less than $10,000 | 9 | 1.2% |
| $10,000 to $14,999 | 7 | 1.0% |
| $15,000 to $24,999 | 40 | 5.5% |
| $25,000 to $34,999 | 20 | 2.8% |
| $35,000 to $49,999 | 24 | 3.3% |
| $50,000 to $74,999 | 86 | 11.9% |
| $75,000 to $99,999 | 168 | 23.2% |
| $100,000 to $149,999 | 231 | 31.9% |
| $150,000 to $199,999 | 81 | 11.2% |
| $200,000+ | 58 | 8.0% |
Family Income by Famaliy Size in Ball Ground
4-person families (125 | 17.3%) account for the highest median family income in Ball Ground with $133,315 per family, while 2-person families (407 | 56.2%) have the highest median income of $43,950 per family member.
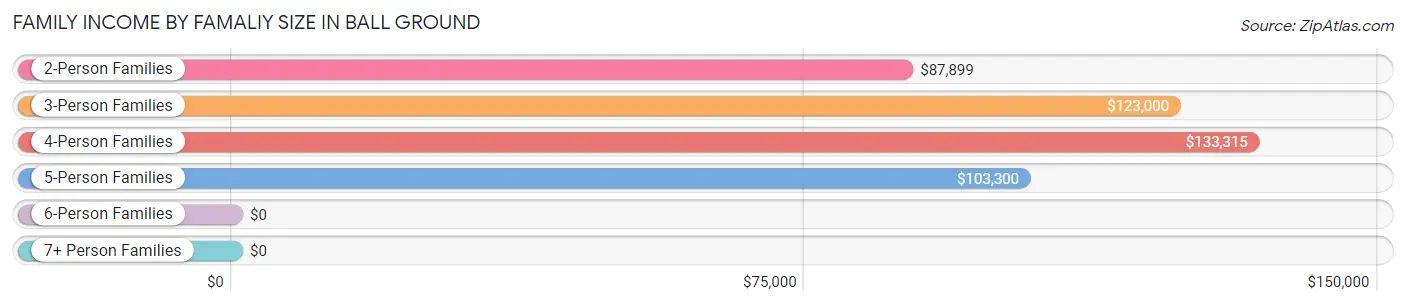
| Income Bracket | # Families | Median Income |
| 2-Person Families | 407 (56.2%) | $87,899 |
| 3-Person Families | 98 (13.5%) | $123,000 |
| 4-Person Families | 125 (17.3%) | $133,315 |
| 5-Person Families | 74 (10.2%) | $103,300 |
| 6-Person Families | 15 (2.1%) | $0 |
| 7+ Person Families | 5 (0.7%) | $0 |
| Total | 724 (100.0%) | $101,250 |
Family Income by Number of Earners in Ball Ground
The median family income in Ball Ground is $101,250, with families comprising 3+ earners (52) having the highest median family income of $118,000, while families with no earners (69) have the lowest median family income of $46,375, accounting for 7.2% and 9.5% of families, respectively.
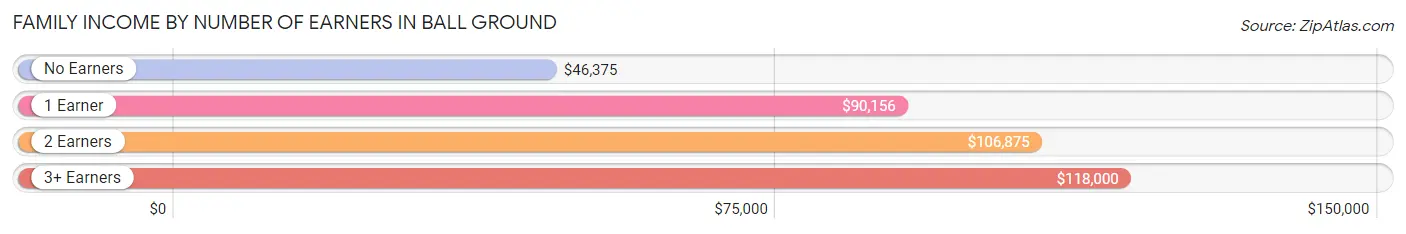
| Number of Earners | # Families | Median Income |
| No Earners | 69 (9.5%) | $46,375 |
| 1 Earner | 217 (30.0%) | $90,156 |
| 2 Earners | 386 (53.3%) | $106,875 |
| 3+ Earners | 52 (7.2%) | $118,000 |
| Total | 724 (100.0%) | $101,250 |
Household Income in Ball Ground
Household Income Brackets in Ball Ground
With 302 households falling in the category, the $100,000 to $149,999 income range is the most frequent in Ball Ground, accounting for 30.0% of all households. In contrast, only 7 households (0.7%) fall into the $10,000 to $14,999 income bracket, making it the least populous group.
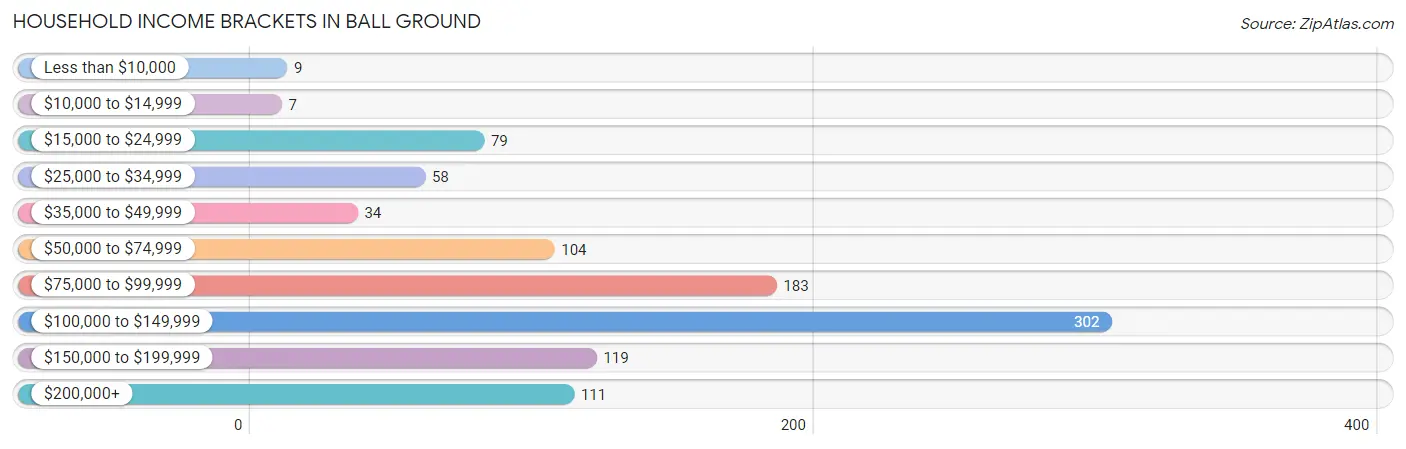
| Income Bracket | # Households | % Households |
| Less than $10,000 | 9 | 0.9% |
| $10,000 to $14,999 | 7 | 0.7% |
| $15,000 to $24,999 | 79 | 7.9% |
| $25,000 to $34,999 | 58 | 5.8% |
| $35,000 to $49,999 | 34 | 3.4% |
| $50,000 to $74,999 | 104 | 10.3% |
| $75,000 to $99,999 | 183 | 18.2% |
| $100,000 to $149,999 | 302 | 30.0% |
| $150,000 to $199,999 | 119 | 11.8% |
| $200,000+ | 111 | 11.0% |
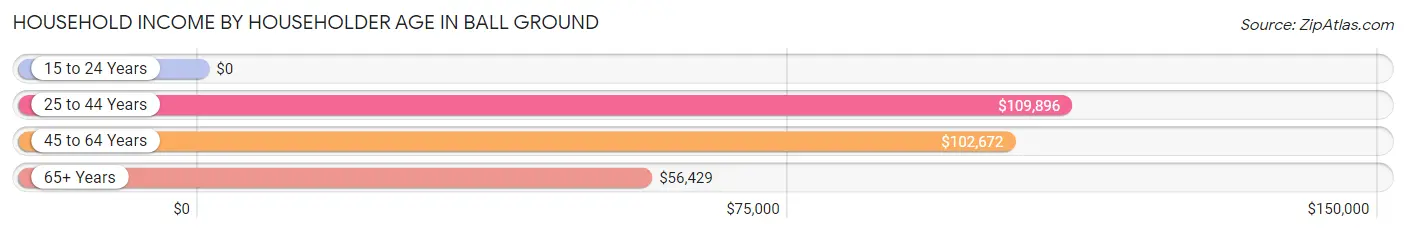
Household Income by Householder Age in Ball Ground
The median household income in Ball Ground is $103,429, with the highest median household income of $109,896 found in the 25 to 44 years age bracket for the primary householder. A total of 361 households (35.9%) fall into this category. Meanwhile, the 15 to 24 years age bracket for the primary householder has the lowest median household income of $0, with 7 households (0.7%) in this group.
| Income Bracket | # Households | Median Income |
| 15 to 24 Years | 7 (0.7%) | $0 |
| 25 to 44 Years | 361 (35.9%) | $109,896 |
| 45 to 64 Years | 468 (46.5%) | $102,672 |
| 65+ Years | 170 (16.9%) | $56,429 |
| Total | 1,006 (100.0%) | $103,429 |
Poverty in Ball Ground
Income Below Poverty by Sex and Age in Ball Ground
With 4.5% poverty level for males and 2.7% for females among the residents of Ball Ground, 5 year old males and 75 year old and over females are the most vulnerable to poverty, with 5 males (33.3%) and 4 females (13.8%) in their respective age groups living below the poverty level.
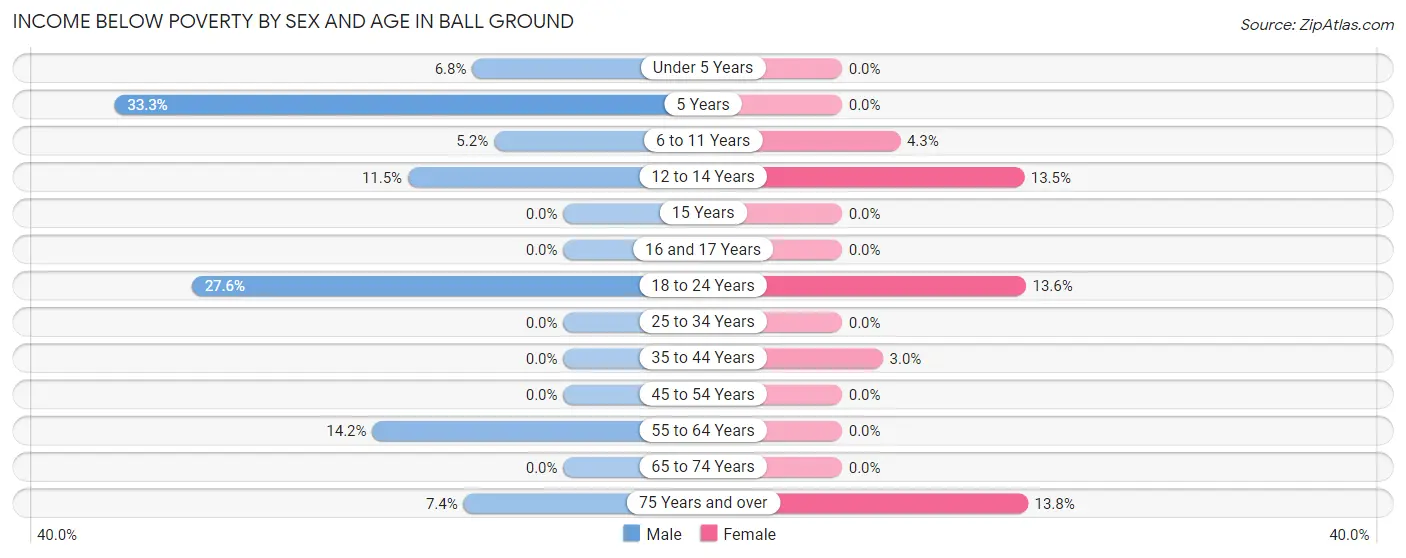
| Age Bracket | Male | Female |
| Under 5 Years | 5 (6.8%) | 0 (0.0%) |
| 5 Years | 5 (33.3%) | 0 (0.0%) |
| 6 to 11 Years | 5 (5.1%) | 6 (4.3%) |
| 12 to 14 Years | 6 (11.5%) | 5 (13.5%) |
| 15 Years | 0 (0.0%) | 0 (0.0%) |
| 16 and 17 Years | 0 (0.0%) | 0 (0.0%) |
| 18 to 24 Years | 16 (27.6%) | 12 (13.6%) |
| 25 to 34 Years | 0 (0.0%) | 0 (0.0%) |
| 35 to 44 Years | 0 (0.0%) | 5 (3.0%) |
| 45 to 54 Years | 0 (0.0%) | 0 (0.0%) |
| 55 to 64 Years | 20 (14.2%) | 0 (0.0%) |
| 65 to 74 Years | 0 (0.0%) | 0 (0.0%) |
| 75 Years and over | 4 (7.4%) | 4 (13.8%) |
| Total | 61 (4.5%) | 32 (2.7%) |
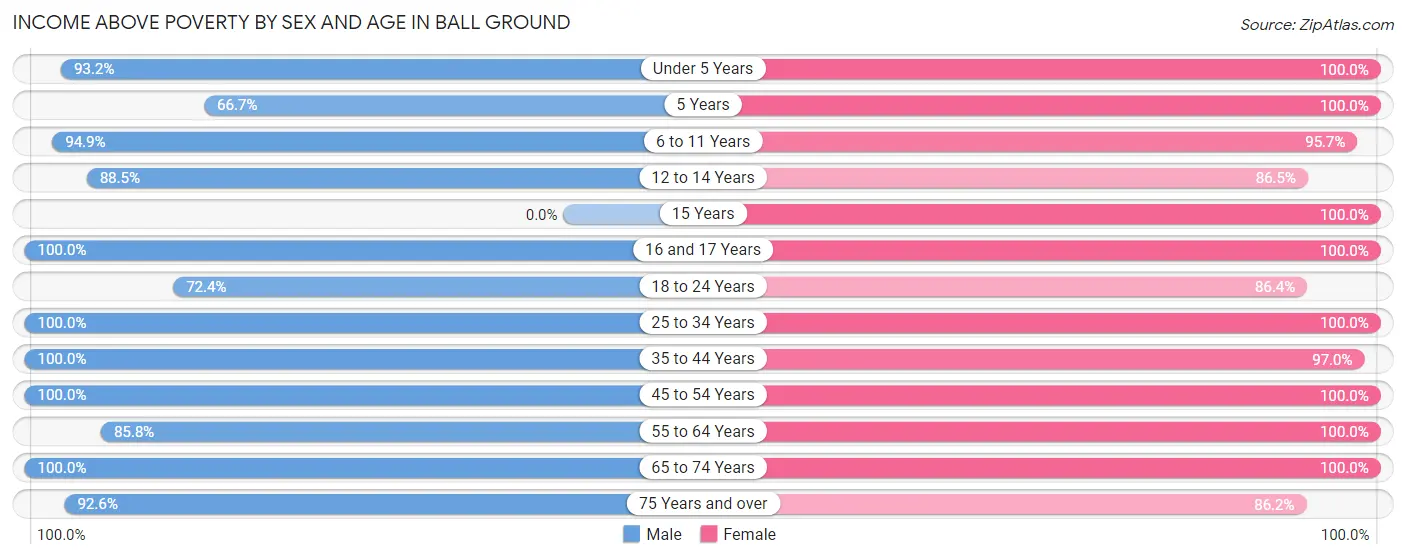
Income Above Poverty by Sex and Age in Ball Ground
According to the poverty statistics in Ball Ground, males aged 16 and 17 years and females aged under 5 years are the age groups that are most secure financially, with 100.0% of males and 100.0% of females in these age groups living above the poverty line.
| Age Bracket | Male | Female |
| Under 5 Years | 69 (93.2%) | 50 (100.0%) |
| 5 Years | 10 (66.7%) | 22 (100.0%) |
| 6 to 11 Years | 92 (94.9%) | 133 (95.7%) |
| 12 to 14 Years | 46 (88.5%) | 32 (86.5%) |
| 15 Years | 0 (0.0%) | 11 (100.0%) |
| 16 and 17 Years | 44 (100.0%) | 30 (100.0%) |
| 18 to 24 Years | 42 (72.4%) | 76 (86.4%) |
| 25 to 34 Years | 273 (100.0%) | 148 (100.0%) |
| 35 to 44 Years | 148 (100.0%) | 160 (97.0%) |
| 45 to 54 Years | 293 (100.0%) | 169 (100.0%) |
| 55 to 64 Years | 121 (85.8%) | 152 (100.0%) |
| 65 to 74 Years | 91 (100.0%) | 139 (100.0%) |
| 75 Years and over | 50 (92.6%) | 25 (86.2%) |
| Total | 1,279 (95.5%) | 1,147 (97.3%) |
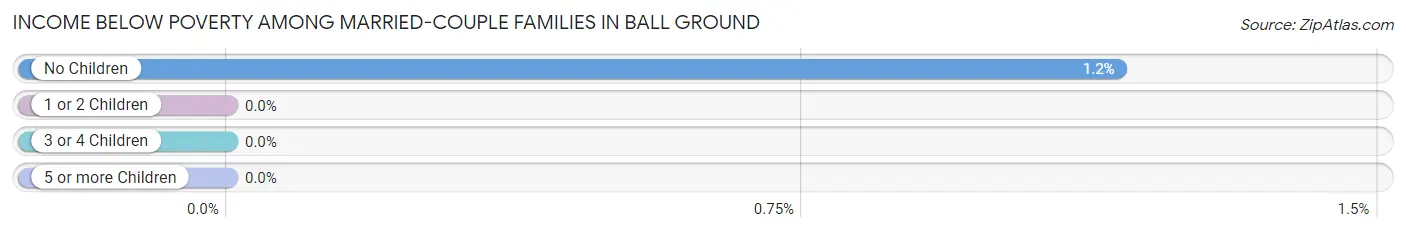
Income Below Poverty Among Married-Couple Families in Ball Ground
The poverty statistics for married-couple families in Ball Ground show that 0.7% or 4 of the total 574 families live below the poverty line. Families with no children have the highest poverty rate of 1.2%, comprising of 4 families. On the other hand, families with 1 or 2 children have the lowest poverty rate of 0.0%, which includes 0 families.
| Children | Above Poverty | Below Poverty |
| No Children | 342 (98.8%) | 4 (1.2%) |
| 1 or 2 Children | 201 (100.0%) | 0 (0.0%) |
| 3 or 4 Children | 27 (100.0%) | 0 (0.0%) |
| 5 or more Children | 0 (0.0%) | 0 (0.0%) |
| Total | 570 (99.3%) | 4 (0.7%) |
Income Below Poverty Among Single-Parent Households in Ball Ground
According to the poverty data in Ball Ground, 13.0% or 7 single-father households and 5.2% or 5 single-mother households are living below the poverty line. Among single-father households, those with no children have the highest poverty rate, with 7 households (25.0%) experiencing poverty. Likewise, among single-mother households, those with 5 or more children have the highest poverty rate, with 5 households (100.0%) falling below the poverty line.
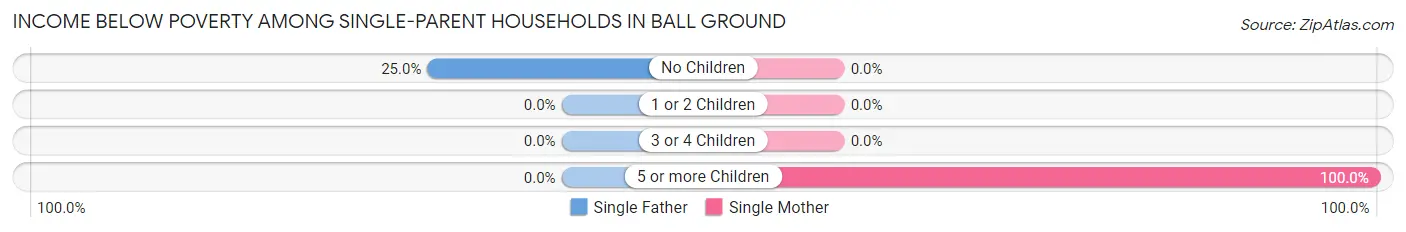
| Children | Single Father | Single Mother |
| No Children | 7 (25.0%) | 0 (0.0%) |
| 1 or 2 Children | 0 (0.0%) | 0 (0.0%) |
| 3 or 4 Children | 0 (0.0%) | 0 (0.0%) |
| 5 or more Children | 0 (0.0%) | 5 (100.0%) |
| Total | 7 (13.0%) | 5 (5.2%) |
Income Below Poverty Among Married-Couple vs Single-Parent Households in Ball Ground
The poverty data for Ball Ground shows that 4 of the married-couple family households (0.7%) and 12 of the single-parent households (8.0%) are living below the poverty level. Within the married-couple family households, those with no children have the highest poverty rate, with 4 households (1.2%) falling below the poverty line. Among the single-parent households, those with 5 or more children have the highest poverty rate, with 5 household (100.0%) living below poverty.
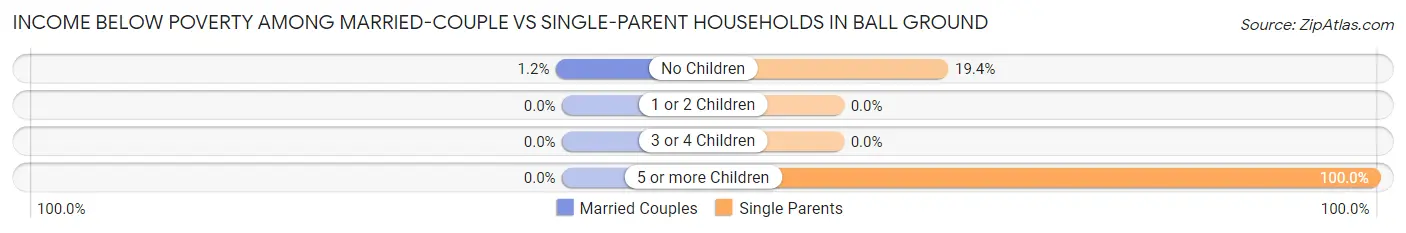
| Children | Married-Couple Families | Single-Parent Households |
| No Children | 4 (1.2%) | 7 (19.4%) |
| 1 or 2 Children | 0 (0.0%) | 0 (0.0%) |
| 3 or 4 Children | 0 (0.0%) | 0 (0.0%) |
| 5 or more Children | 0 (0.0%) | 5 (100.0%) |
| Total | 4 (0.7%) | 12 (8.0%) |
Race in Ball Ground
The most populous races in Ball Ground are White / Caucasian (2,306 | 91.2%), Black / African American (104 | 4.1%), and Two or more Races (99 | 3.9%).
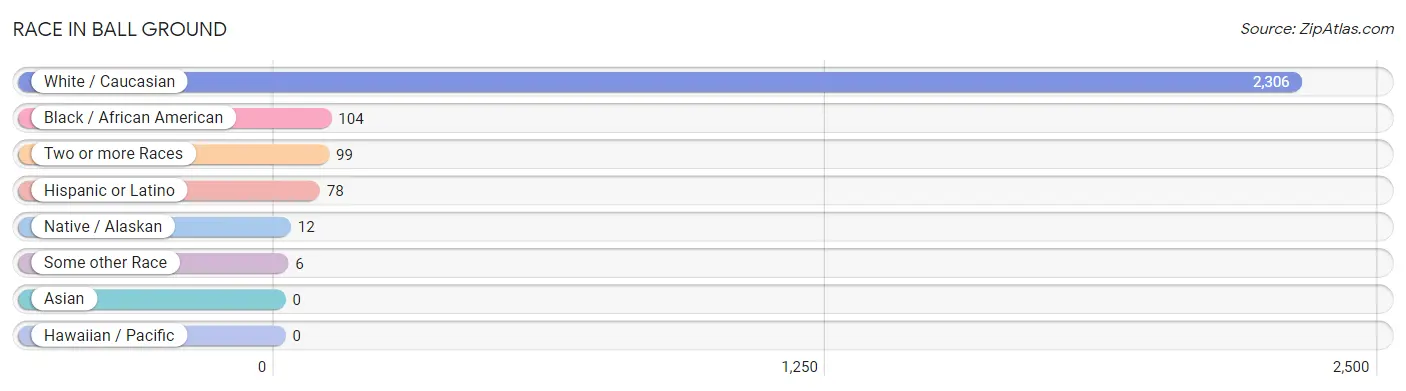
| Race | # Population | % Population |
| Asian | 0 | 0.0% |
| Black / African American | 104 | 4.1% |
| Hawaiian / Pacific | 0 | 0.0% |
| Hispanic or Latino | 78 | 3.1% |
| Native / Alaskan | 12 | 0.5% |
| White / Caucasian | 2,306 | 91.2% |
| Two or more Races | 99 | 3.9% |
| Some other Race | 6 | 0.2% |
| Total | 2,527 | 100.0% |
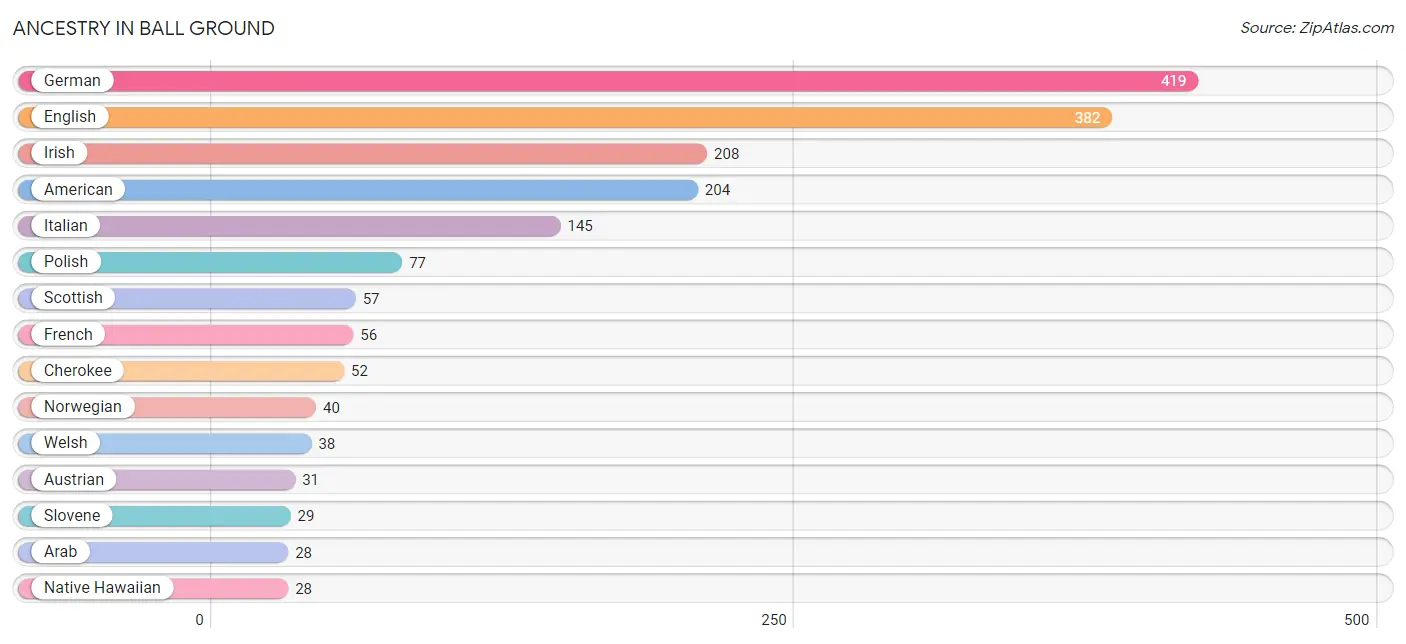
Ancestry in Ball Ground
The most populous ancestries reported in Ball Ground are German (419 | 16.6%), English (382 | 15.1%), Irish (208 | 8.2%), American (204 | 8.1%), and Italian (145 | 5.7%), together accounting for 53.7% of all Ball Ground residents.
| Ancestry | # Population | % Population |
| Alsatian | 13 | 0.5% |
| American | 204 | 8.1% |
| Arab | 28 | 1.1% |
| Austrian | 31 | 1.2% |
| British | 12 | 0.5% |
| Canadian | 8 | 0.3% |
| Central American | 18 | 0.7% |
| Central American Indian | 12 | 0.5% |
| Cherokee | 52 | 2.1% |
| Croatian | 7 | 0.3% |
| Cuban | 11 | 0.4% |
| Dutch | 5 | 0.2% |
| Eastern European | 6 | 0.2% |
| English | 382 | 15.1% |
| European | 20 | 0.8% |
| Finnish | 10 | 0.4% |
| French | 56 | 2.2% |
| French Canadian | 5 | 0.2% |
| German | 419 | 16.6% |
| Greek | 5 | 0.2% |
| Guatemalan | 18 | 0.7% |
| Haitian | 18 | 0.7% |
| Irish | 208 | 8.2% |
| Italian | 145 | 5.7% |
| Lebanese | 6 | 0.2% |
| Mexican | 19 | 0.7% |
| Native Hawaiian | 28 | 1.1% |
| Northern European | 14 | 0.5% |
| Norwegian | 40 | 1.6% |
| Palestinian | 22 | 0.9% |
| Peruvian | 2 | 0.1% |
| Polish | 77 | 3.0% |
| Puerto Rican | 22 | 0.9% |
| Russian | 9 | 0.4% |
| Scandinavian | 3 | 0.1% |
| Scotch-Irish | 20 | 0.8% |
| Scottish | 57 | 2.3% |
| Slovene | 29 | 1.1% |
| South American | 2 | 0.1% |
| Spaniard | 6 | 0.2% |
| Swedish | 5 | 0.2% |
| Ukrainian | 5 | 0.2% |
| Welsh | 38 | 1.5% | View All 43 Rows |
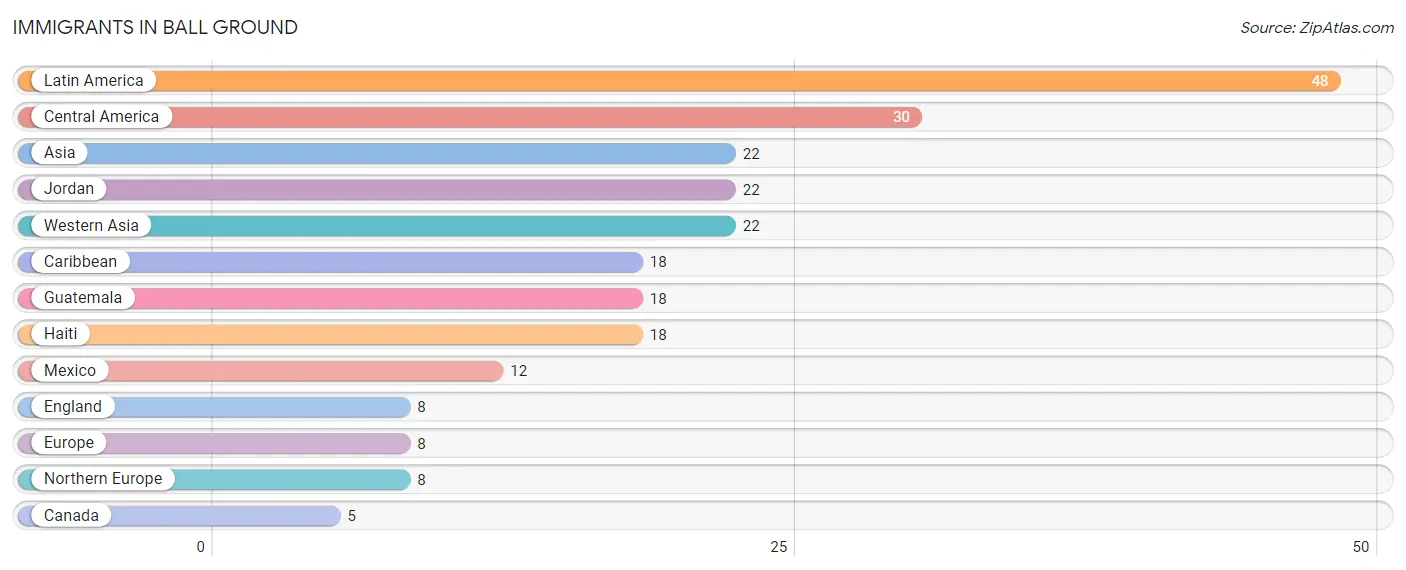
Immigrants in Ball Ground
The most numerous immigrant groups reported in Ball Ground came from Latin America (48 | 1.9%), Central America (30 | 1.2%), Asia (22 | 0.9%), Jordan (22 | 0.9%), and Western Asia (22 | 0.9%), together accounting for 5.7% of all Ball Ground residents.
| Immigration Origin | # Population | % Population |
| Asia | 22 | 0.9% |
| Canada | 5 | 0.2% |
| Caribbean | 18 | 0.7% |
| Central America | 30 | 1.2% |
| England | 8 | 0.3% |
| Europe | 8 | 0.3% |
| Guatemala | 18 | 0.7% |
| Haiti | 18 | 0.7% |
| Jordan | 22 | 0.9% |
| Latin America | 48 | 1.9% |
| Mexico | 12 | 0.5% |
| Northern Europe | 8 | 0.3% |
| Western Asia | 22 | 0.9% | View All 13 Rows |
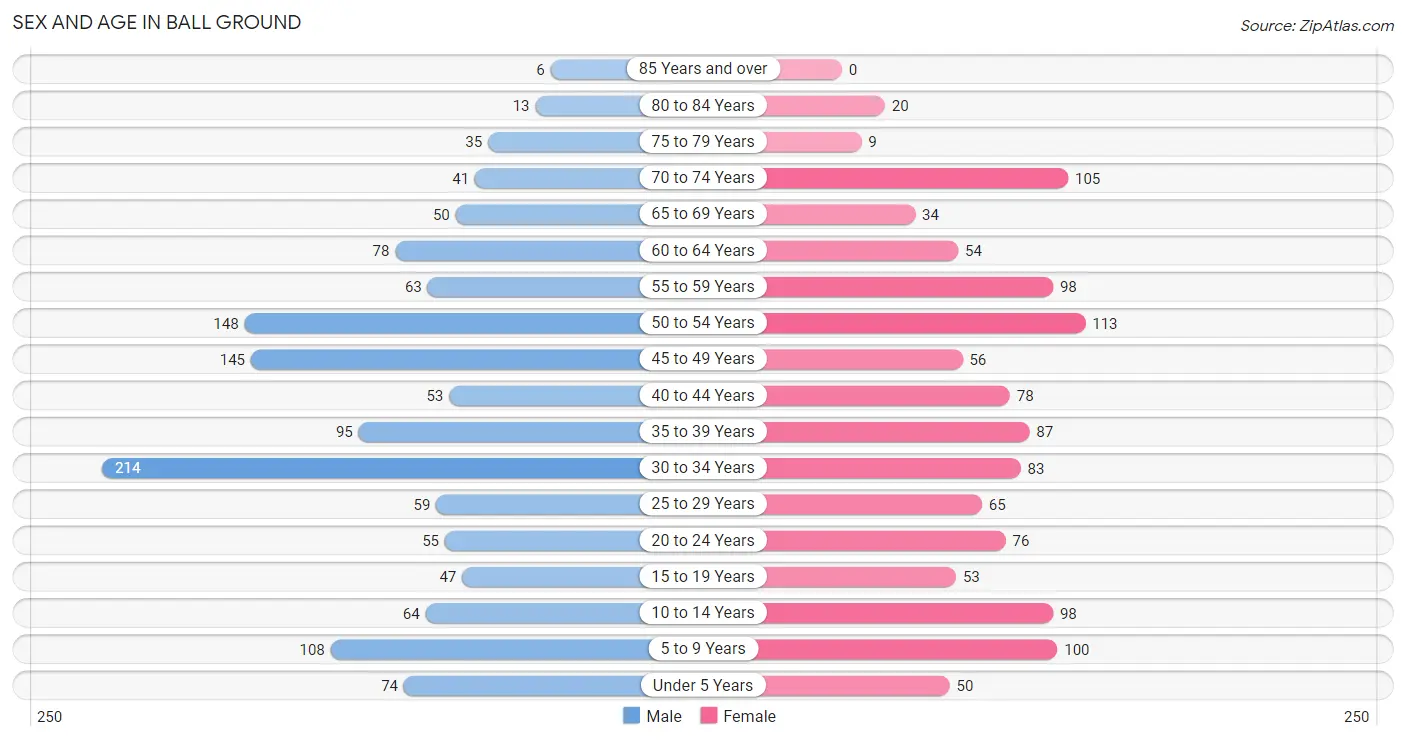
Sex and Age in Ball Ground
Sex and Age in Ball Ground
The most populous age groups in Ball Ground are 30 to 34 Years (214 | 15.9%) for men and 50 to 54 Years (113 | 9.6%) for women.
| Age Bracket | Male | Female |
| Under 5 Years | 74 (5.5%) | 50 (4.2%) |
| 5 to 9 Years | 108 (8.0%) | 100 (8.5%) |
| 10 to 14 Years | 64 (4.8%) | 98 (8.3%) |
| 15 to 19 Years | 47 (3.5%) | 53 (4.5%) |
| 20 to 24 Years | 55 (4.1%) | 76 (6.5%) |
| 25 to 29 Years | 59 (4.4%) | 65 (5.5%) |
| 30 to 34 Years | 214 (15.9%) | 83 (7.0%) |
| 35 to 39 Years | 95 (7.0%) | 87 (7.4%) |
| 40 to 44 Years | 53 (3.9%) | 78 (6.6%) |
| 45 to 49 Years | 145 (10.8%) | 56 (4.8%) |
| 50 to 54 Years | 148 (11.0%) | 113 (9.6%) |
| 55 to 59 Years | 63 (4.7%) | 98 (8.3%) |
| 60 to 64 Years | 78 (5.8%) | 54 (4.6%) |
| 65 to 69 Years | 50 (3.7%) | 34 (2.9%) |
| 70 to 74 Years | 41 (3.0%) | 105 (8.9%) |
| 75 to 79 Years | 35 (2.6%) | 9 (0.8%) |
| 80 to 84 Years | 13 (1.0%) | 20 (1.7%) |
| 85 Years and over | 6 (0.4%) | 0 (0.0%) |
| Total | 1,348 (100.0%) | 1,179 (100.0%) |
Families and Households in Ball Ground
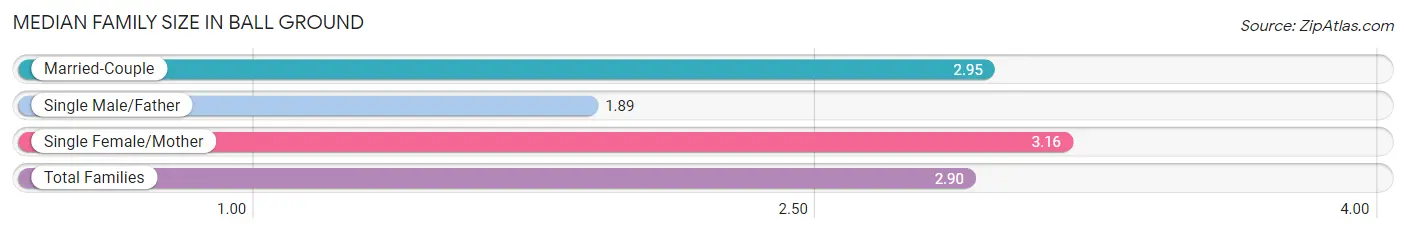
Median Family Size in Ball Ground
The median family size in Ball Ground is 2.90 persons per family, with single female/mother families (96 | 13.3%) accounting for the largest median family size of 3.16 persons per family. On the other hand, single male/father families (54 | 7.5%) represent the smallest median family size with 1.89 persons per family.
| Family Type | # Families | Family Size |
| Married-Couple | 574 (79.3%) | 2.95 |
| Single Male/Father | 54 (7.5%) | 1.89 |
| Single Female/Mother | 96 (13.3%) | 3.16 |
| Total Families | 724 (100.0%) | 2.90 |
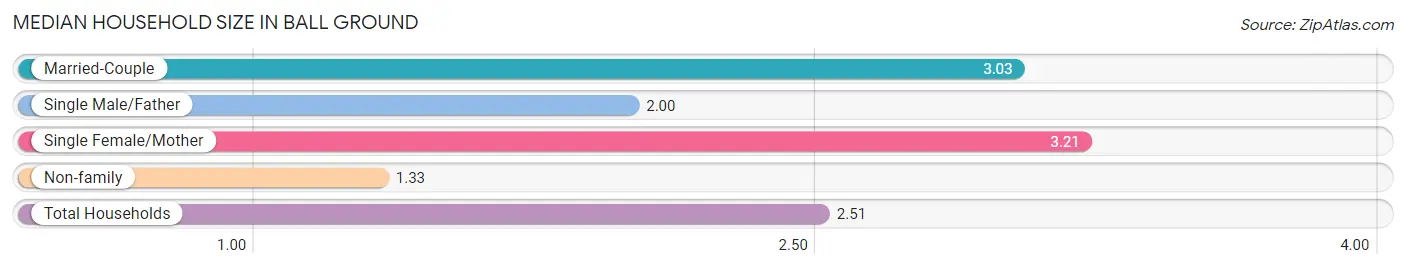
Median Household Size in Ball Ground
The median household size in Ball Ground is 2.51 persons per household, with single female/mother households (96 | 9.5%) accounting for the largest median household size of 3.21 persons per household. non-family households (282 | 28.0%) represent the smallest median household size with 1.33 persons per household.
| Household Type | # Households | Household Size |
| Married-Couple | 574 (57.1%) | 3.03 |
| Single Male/Father | 54 (5.4%) | 2.00 |
| Single Female/Mother | 96 (9.5%) | 3.21 |
| Non-family | 282 (28.0%) | 1.33 |
| Total Households | 1,006 (100.0%) | 2.51 |
Household Size by Marriage Status in Ball Ground
Out of a total of 1,006 households in Ball Ground, 724 (72.0%) are family households, while 282 (28.0%) are nonfamily households. The most numerous type of family households are 2-person households, comprising 382, and the most common type of nonfamily households are 1-person households, comprising 212.
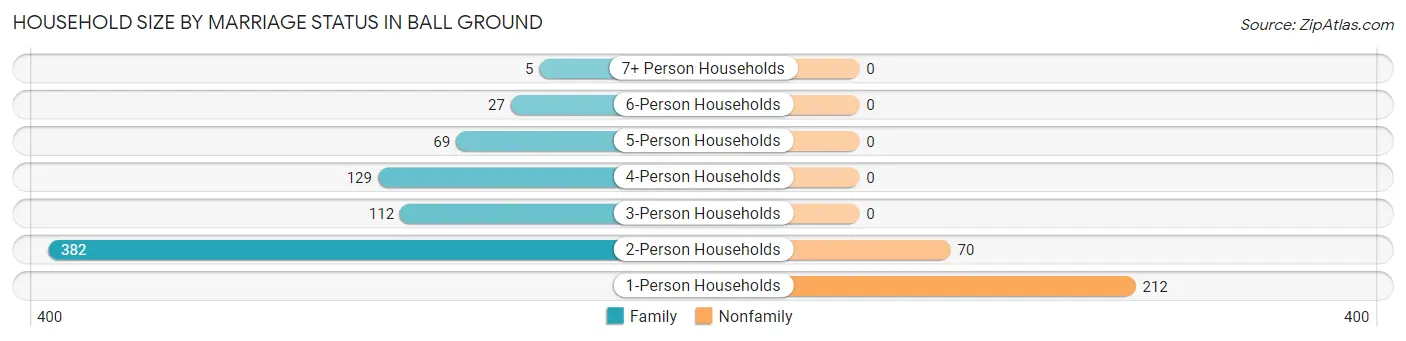
| Household Size | Family Households | Nonfamily Households |
| 1-Person Households | - | 212 (21.1%) |
| 2-Person Households | 382 (38.0%) | 70 (7.0%) |
| 3-Person Households | 112 (11.1%) | 0 (0.0%) |
| 4-Person Households | 129 (12.8%) | 0 (0.0%) |
| 5-Person Households | 69 (6.9%) | 0 (0.0%) |
| 6-Person Households | 27 (2.7%) | 0 (0.0%) |
| 7+ Person Households | 5 (0.5%) | 0 (0.0%) |
| Total | 724 (72.0%) | 282 (28.0%) |
Female Fertility in Ball Ground
Fertility by Age in Ball Ground
Average fertility rate in Ball Ground is 12.0 births per 1,000 women. Women in the age bracket of 20 to 34 years have the highest fertility rate with 27.0 births per 1,000 women. Women in the age bracket of 20 to 34 years acount for 100.0% of all women with births.
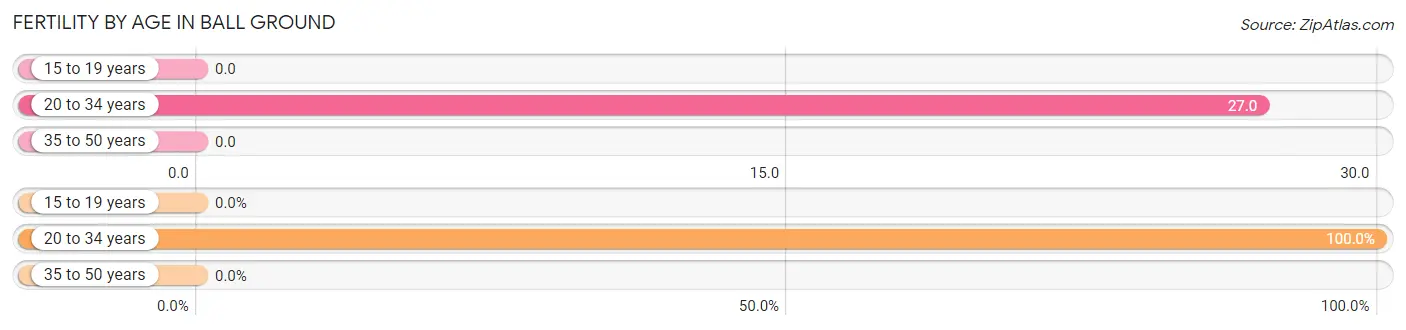
| Age Bracket | Women with Births | Births / 1,000 Women |
| 15 to 19 years | 0 (0.0%) | 0.0 |
| 20 to 34 years | 6 (100.0%) | 27.0 |
| 35 to 50 years | 0 (0.0%) | 0.0 |
| Total | 6 (100.0%) | 12.0 |
Fertility by Age by Marriage Status in Ball Ground
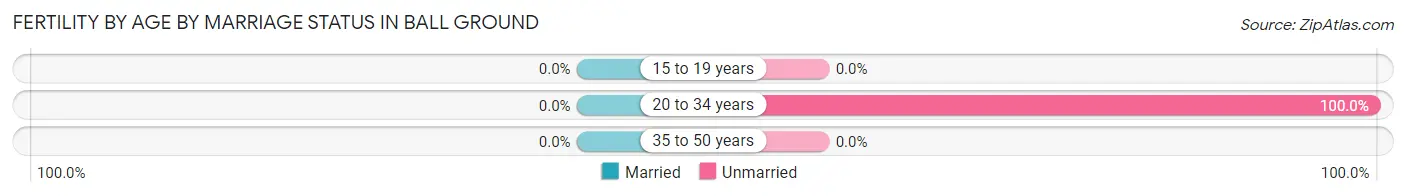
| Age Bracket | Married | Unmarried |
| 15 to 19 years | 0 (0.0%) | 0 (0.0%) |
| 20 to 34 years | 0 (0.0%) | 6 (100.0%) |
| 35 to 50 years | 0 (0.0%) | 0 (0.0%) |
| Total | 0 (0.0%) | 6 (100.0%) |
Fertility by Education in Ball Ground
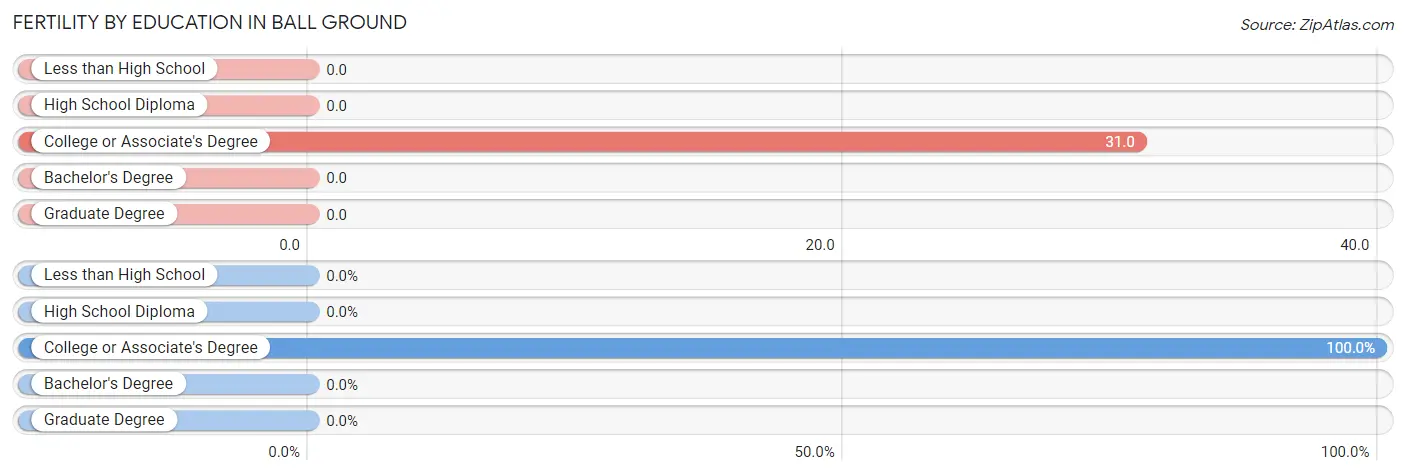
| Educational Attainment | Women with Births | Births / 1,000 Women |
| Less than High School | 0 (0.0%) | 0.0 |
| High School Diploma | 0 (0.0%) | 0.0 |
| College or Associate's Degree | 6 (100.0%) | 31.0 |
| Bachelor's Degree | 0 (0.0%) | 0.0 |
| Graduate Degree | 0 (0.0%) | 0.0 |
| Total | 6 (100.0%) | 12.0 |
Fertility by Education by Marriage Status in Ball Ground
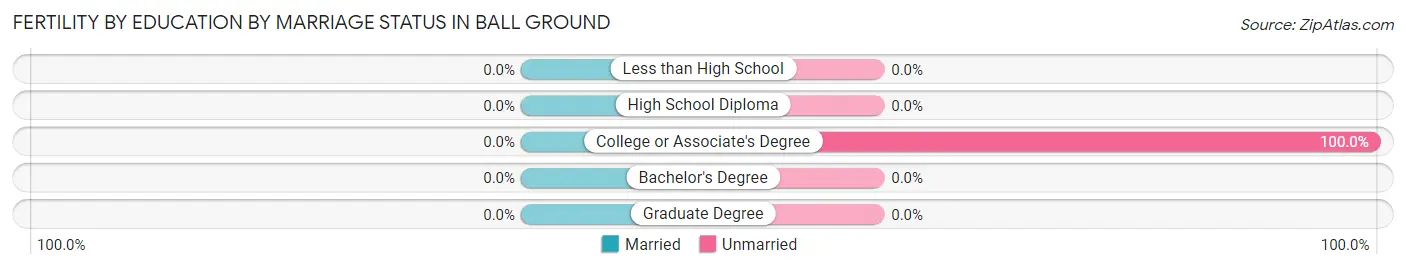
| Educational Attainment | Married | Unmarried |
| Less than High School | 0 (0.0%) | 0 (0.0%) |
| High School Diploma | 0 (0.0%) | 0 (0.0%) |
| College or Associate's Degree | 0 (0.0%) | 6 (100.0%) |
| Bachelor's Degree | 0 (0.0%) | 0 (0.0%) |
| Graduate Degree | 0 (0.0%) | 0 (0.0%) |
| Total | 0 (0.0%) | 6 (100.0%) |
Employment Characteristics in Ball Ground
Employment by Class of Employer in Ball Ground
Among the 1,436 employed individuals in Ball Ground, private company employees (973 | 67.8%), local government employees (236 | 16.4%), and self-employed (incorporated) (80 | 5.6%) make up the most common classes of employment.
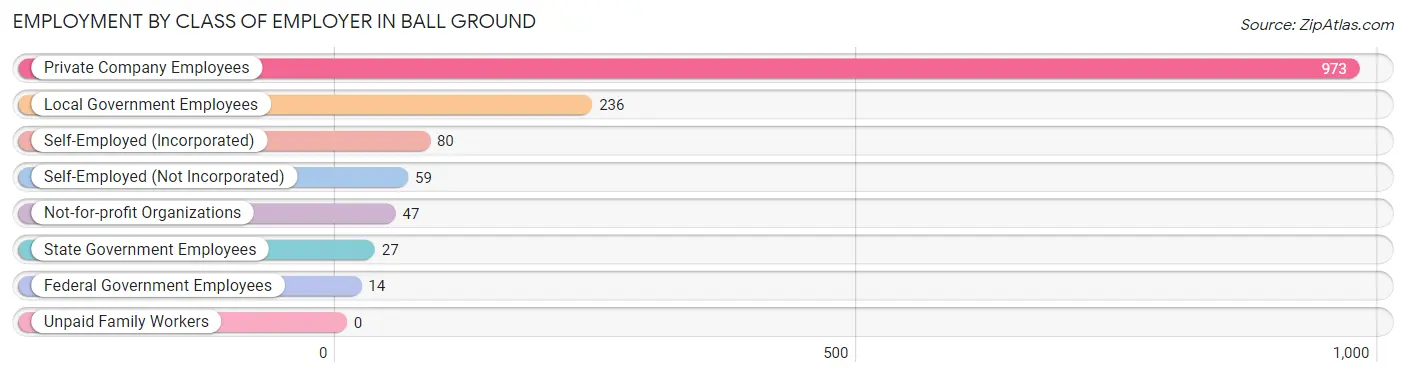
| Employer Class | # Employees | % Employees |
| Private Company Employees | 973 | 67.8% |
| Self-Employed (Incorporated) | 80 | 5.6% |
| Self-Employed (Not Incorporated) | 59 | 4.1% |
| Not-for-profit Organizations | 47 | 3.3% |
| Local Government Employees | 236 | 16.4% |
| State Government Employees | 27 | 1.9% |
| Federal Government Employees | 14 | 1.0% |
| Unpaid Family Workers | 0 | 0.0% |
| Total | 1,436 | 100.0% |
Employment Status by Age in Ball Ground
According to the labor force statistics for Ball Ground, out of the total population over 16 years of age (2,022), 74.4% or 1,504 individuals are in the labor force, with 3.6% or 54 of them unemployed. The age group with the highest labor force participation rate is 30 to 34 years, with 100.0% or 297 individuals in the labor force. Within the labor force, the 65 to 74 years age range has the highest percentage of unemployed individuals, with 34.2% or 26 of them being unemployed.
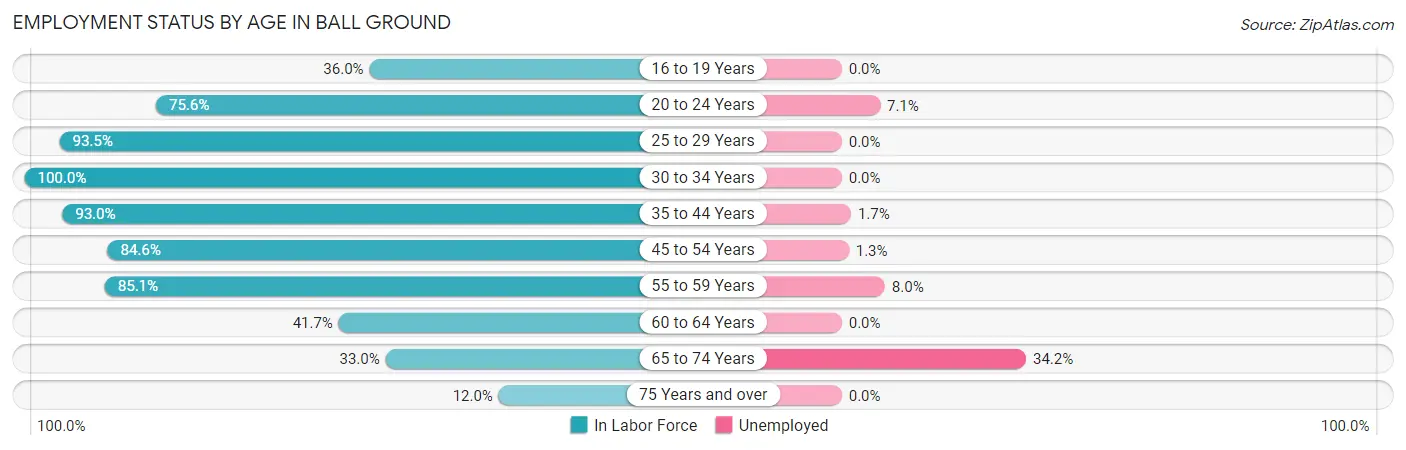
| Age Bracket | In Labor Force | Unemployed |
| 16 to 19 Years | 32 (36.0%) | 0 (0.0%) |
| 20 to 24 Years | 99 (75.6%) | 7 (7.1%) |
| 25 to 29 Years | 116 (93.5%) | 0 (0.0%) |
| 30 to 34 Years | 297 (100.0%) | 0 (0.0%) |
| 35 to 44 Years | 291 (93.0%) | 5 (1.7%) |
| 45 to 54 Years | 391 (84.6%) | 5 (1.3%) |
| 55 to 59 Years | 137 (85.1%) | 11 (8.0%) |
| 60 to 64 Years | 55 (41.7%) | 0 (0.0%) |
| 65 to 74 Years | 76 (33.0%) | 26 (34.2%) |
| 75 Years and over | 10 (12.0%) | 0 (0.0%) |
| Total | 1,504 (74.4%) | 54 (3.6%) |
Employment Status by Educational Attainment in Ball Ground
According to labor force statistics for Ball Ground, 86.4% of individuals (1,286) out of the total population between 25 and 64 years of age (1,489) are in the labor force, with 1.6% or 21 of them being unemployed. The group with the highest labor force participation rate are those with the educational attainment of bachelor's degree or higher, with 92.7% or 494 individuals in the labor force. Within the labor force, individuals with college / associate degree education have the highest percentage of unemployment, with 2.6% or 13 of them being unemployed.
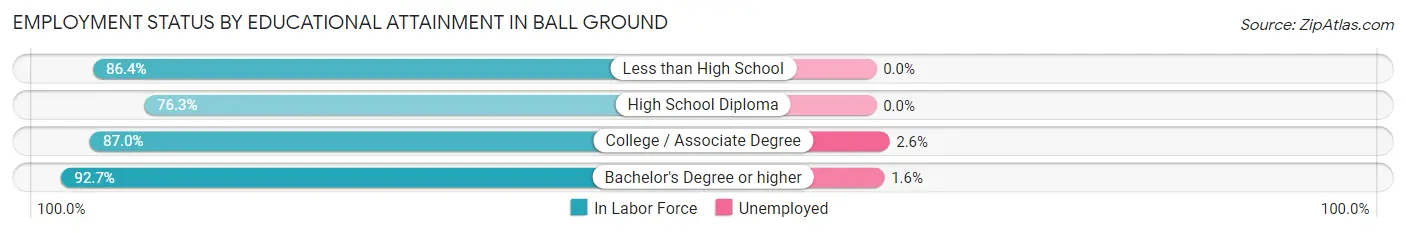
| Educational Attainment | In Labor Force | Unemployed |
| Less than High School | 19 (86.4%) | 0 (0.0%) |
| High School Diploma | 273 (76.3%) | 0 (0.0%) |
| College / Associate Degree | 501 (87.0%) | 15 (2.6%) |
| Bachelor's Degree or higher | 494 (92.7%) | 9 (1.6%) |
| Total | 1,286 (86.4%) | 24 (1.6%) |
Employment Occupations by Sex in Ball Ground
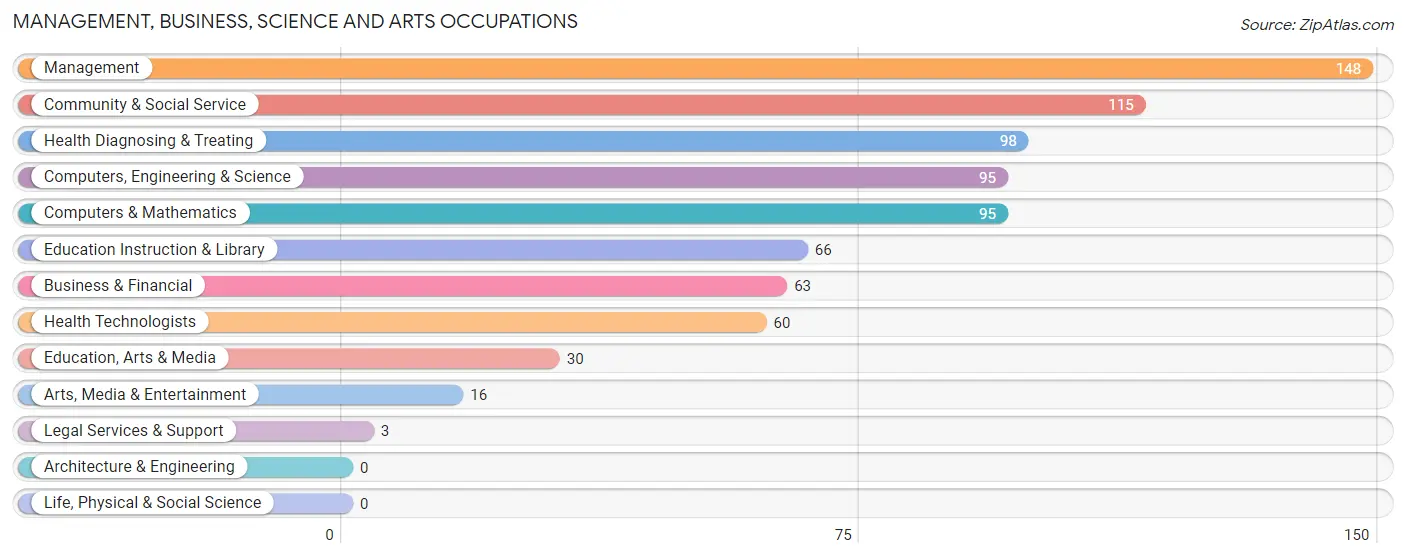
Management, Business, Science and Arts Occupations
The most common Management, Business, Science and Arts occupations in Ball Ground are Management (148 | 10.2%), Community & Social Service (115 | 7.9%), Health Diagnosing & Treating (98 | 6.8%), Computers, Engineering & Science (95 | 6.6%), and Computers & Mathematics (95 | 6.6%).
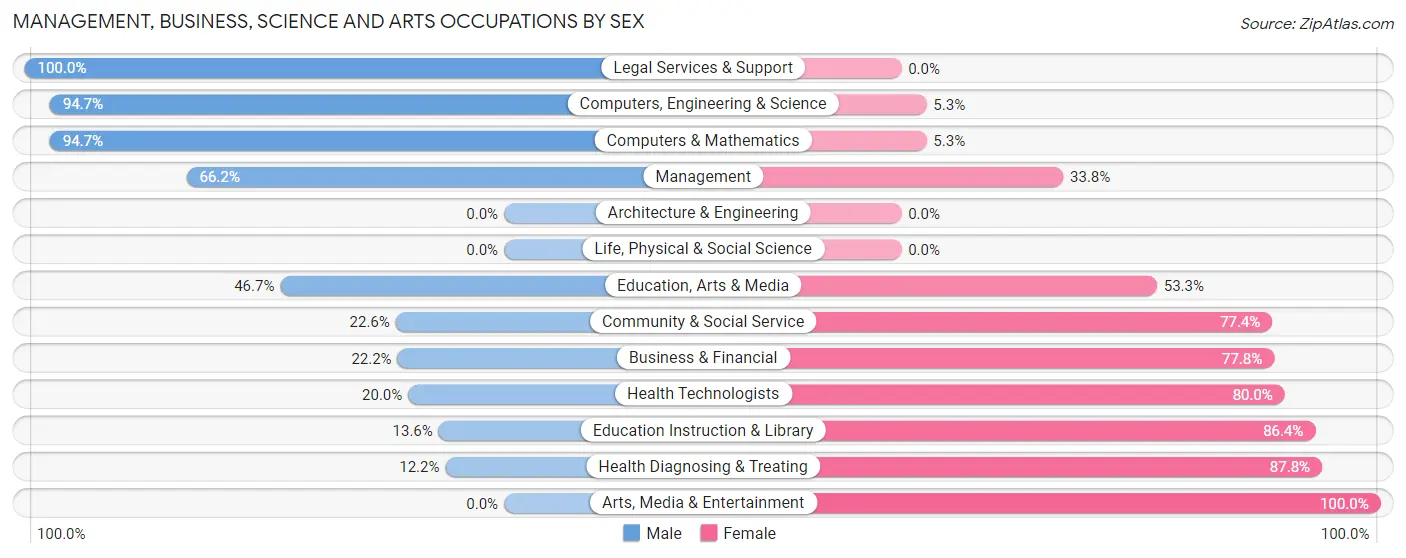
Management, Business, Science and Arts Occupations by Sex
Within the Management, Business, Science and Arts occupations in Ball Ground, the most male-oriented occupations are Legal Services & Support (100.0%), Computers, Engineering & Science (94.7%), and Computers & Mathematics (94.7%), while the most female-oriented occupations are Arts, Media & Entertainment (100.0%), Health Diagnosing & Treating (87.8%), and Education Instruction & Library (86.4%).
| Occupation | Male | Female |
| Management | 98 (66.2%) | 50 (33.8%) |
| Business & Financial | 14 (22.2%) | 49 (77.8%) |
| Computers, Engineering & Science | 90 (94.7%) | 5 (5.3%) |
| Computers & Mathematics | 90 (94.7%) | 5 (5.3%) |
| Architecture & Engineering | 0 (0.0%) | 0 (0.0%) |
| Life, Physical & Social Science | 0 (0.0%) | 0 (0.0%) |
| Community & Social Service | 26 (22.6%) | 89 (77.4%) |
| Education, Arts & Media | 14 (46.7%) | 16 (53.3%) |
| Legal Services & Support | 3 (100.0%) | 0 (0.0%) |
| Education Instruction & Library | 9 (13.6%) | 57 (86.4%) |
| Arts, Media & Entertainment | 0 (0.0%) | 16 (100.0%) |
| Health Diagnosing & Treating | 12 (12.2%) | 86 (87.8%) |
| Health Technologists | 12 (20.0%) | 48 (80.0%) |
| Total (Category) | 240 (46.2%) | 279 (53.8%) |
| Total (Overall) | 867 (59.8%) | 583 (40.2%) |
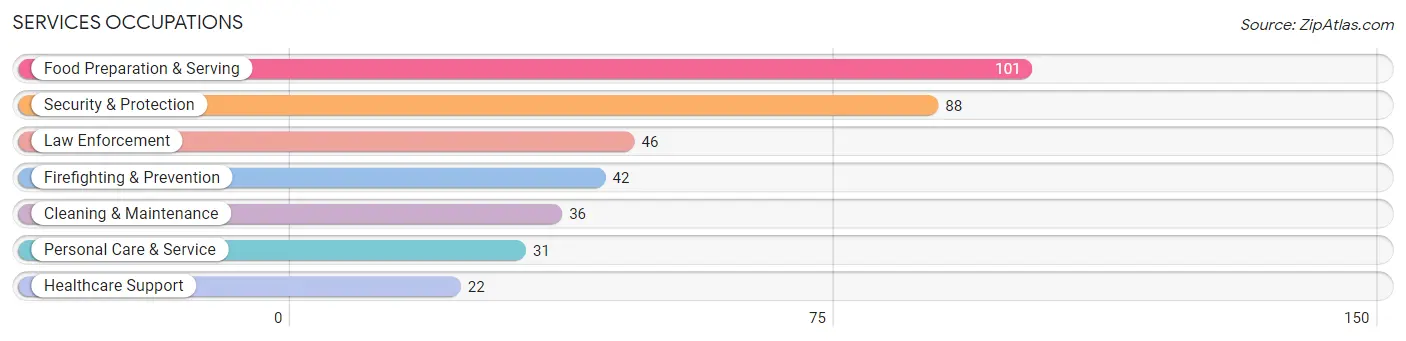
Services Occupations
The most common Services occupations in Ball Ground are Food Preparation & Serving (101 | 7.0%), Security & Protection (88 | 6.1%), Law Enforcement (46 | 3.2%), Firefighting & Prevention (42 | 2.9%), and Cleaning & Maintenance (36 | 2.5%).
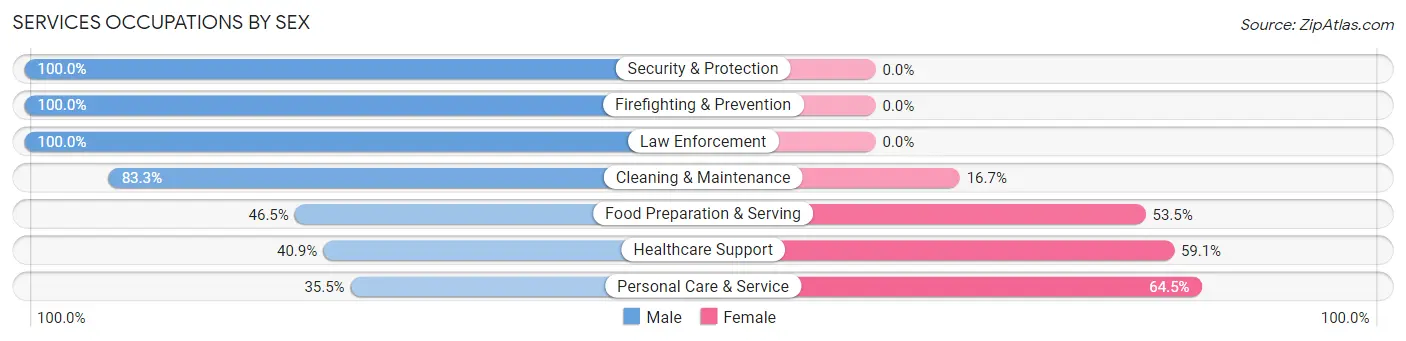
Services Occupations by Sex
Within the Services occupations in Ball Ground, the most male-oriented occupations are Security & Protection (100.0%), Firefighting & Prevention (100.0%), and Law Enforcement (100.0%), while the most female-oriented occupations are Personal Care & Service (64.5%), Healthcare Support (59.1%), and Food Preparation & Serving (53.5%).
| Occupation | Male | Female |
| Healthcare Support | 9 (40.9%) | 13 (59.1%) |
| Security & Protection | 88 (100.0%) | 0 (0.0%) |
| Firefighting & Prevention | 42 (100.0%) | 0 (0.0%) |
| Law Enforcement | 46 (100.0%) | 0 (0.0%) |
| Food Preparation & Serving | 47 (46.5%) | 54 (53.5%) |
| Cleaning & Maintenance | 30 (83.3%) | 6 (16.7%) |
| Personal Care & Service | 11 (35.5%) | 20 (64.5%) |
| Total (Category) | 185 (66.5%) | 93 (33.5%) |
| Total (Overall) | 867 (59.8%) | 583 (40.2%) |
Sales and Office Occupations
The most common Sales and Office occupations in Ball Ground are Office & Administration (154 | 10.6%), and Sales & Related (126 | 8.7%).
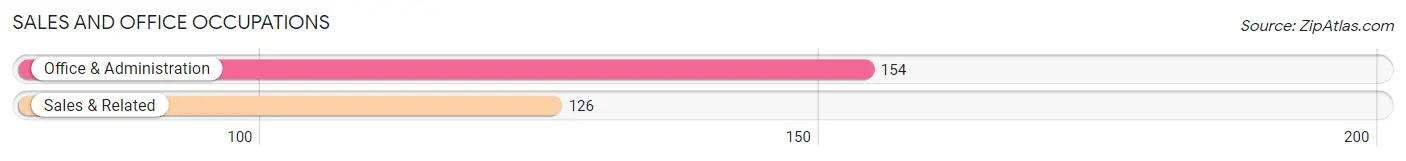
Sales and Office Occupations by Sex
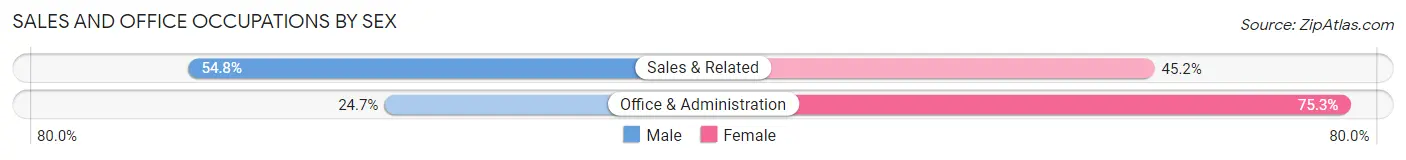
| Occupation | Male | Female |
| Sales & Related | 69 (54.8%) | 57 (45.2%) |
| Office & Administration | 38 (24.7%) | 116 (75.3%) |
| Total (Category) | 107 (38.2%) | 173 (61.8%) |
| Total (Overall) | 867 (59.8%) | 583 (40.2%) |
Natural Resources, Construction and Maintenance Occupations
The most common Natural Resources, Construction and Maintenance occupations in Ball Ground are Installation, Maintenance & Repair (102 | 7.0%), and Construction & Extraction (94 | 6.5%).
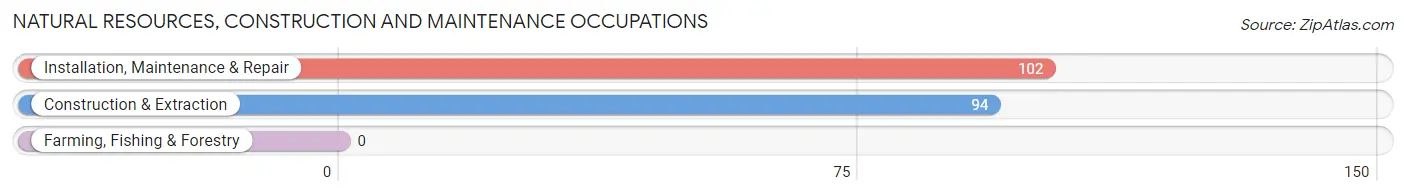
Natural Resources, Construction and Maintenance Occupations by Sex
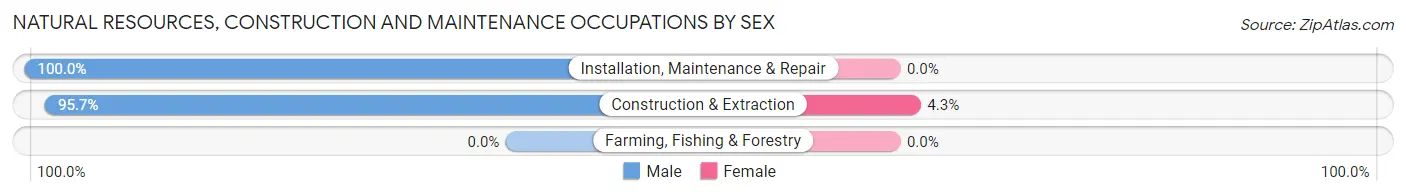
| Occupation | Male | Female |
| Farming, Fishing & Forestry | 0 (0.0%) | 0 (0.0%) |
| Construction & Extraction | 90 (95.7%) | 4 (4.3%) |
| Installation, Maintenance & Repair | 102 (100.0%) | 0 (0.0%) |
| Total (Category) | 192 (98.0%) | 4 (2.0%) |
| Total (Overall) | 867 (59.8%) | 583 (40.2%) |
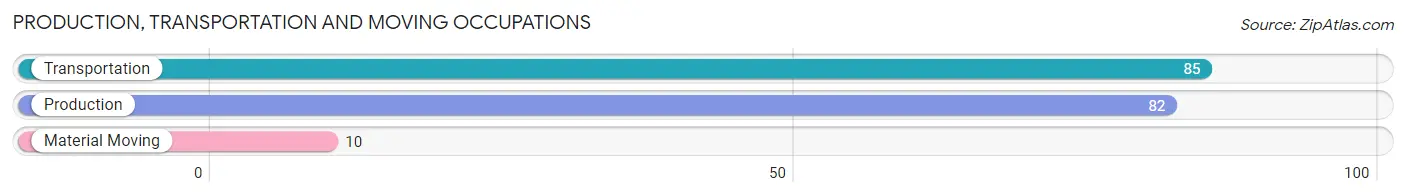
Production, Transportation and Moving Occupations
The most common Production, Transportation and Moving occupations in Ball Ground are Transportation (85 | 5.9%), Production (82 | 5.7%), and Material Moving (10 | 0.7%).
Production, Transportation and Moving Occupations by Sex
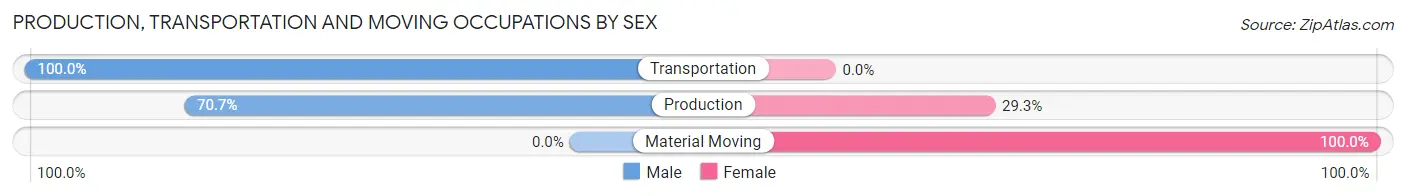
| Occupation | Male | Female |
| Production | 58 (70.7%) | 24 (29.3%) |
| Transportation | 85 (100.0%) | 0 (0.0%) |
| Material Moving | 0 (0.0%) | 10 (100.0%) |
| Total (Category) | 143 (80.8%) | 34 (19.2%) |
| Total (Overall) | 867 (59.8%) | 583 (40.2%) |
Employment Industries by Sex in Ball Ground
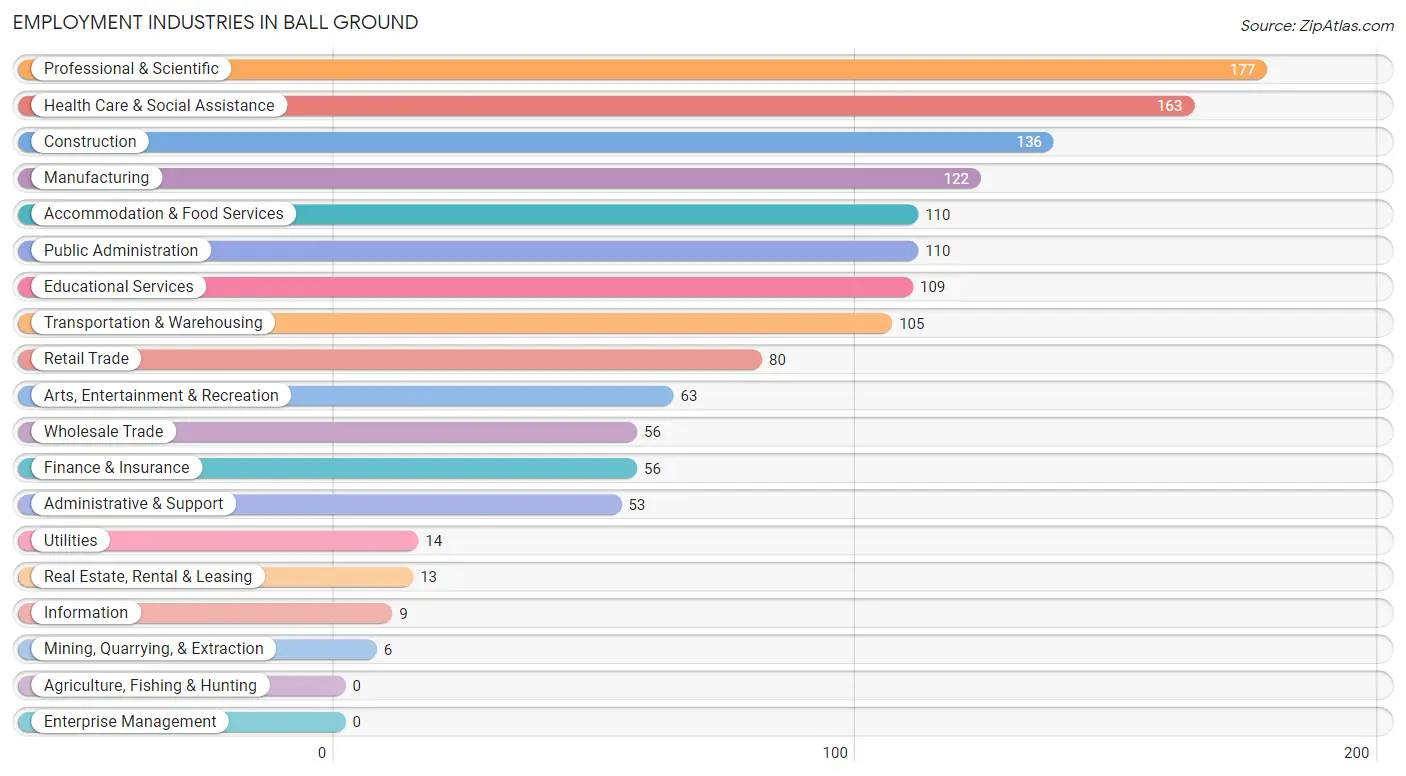
Employment Industries in Ball Ground
The major employment industries in Ball Ground include Professional & Scientific (177 | 12.2%), Health Care & Social Assistance (163 | 11.2%), Construction (136 | 9.4%), Manufacturing (122 | 8.4%), and Accommodation & Food Services (110 | 7.6%).
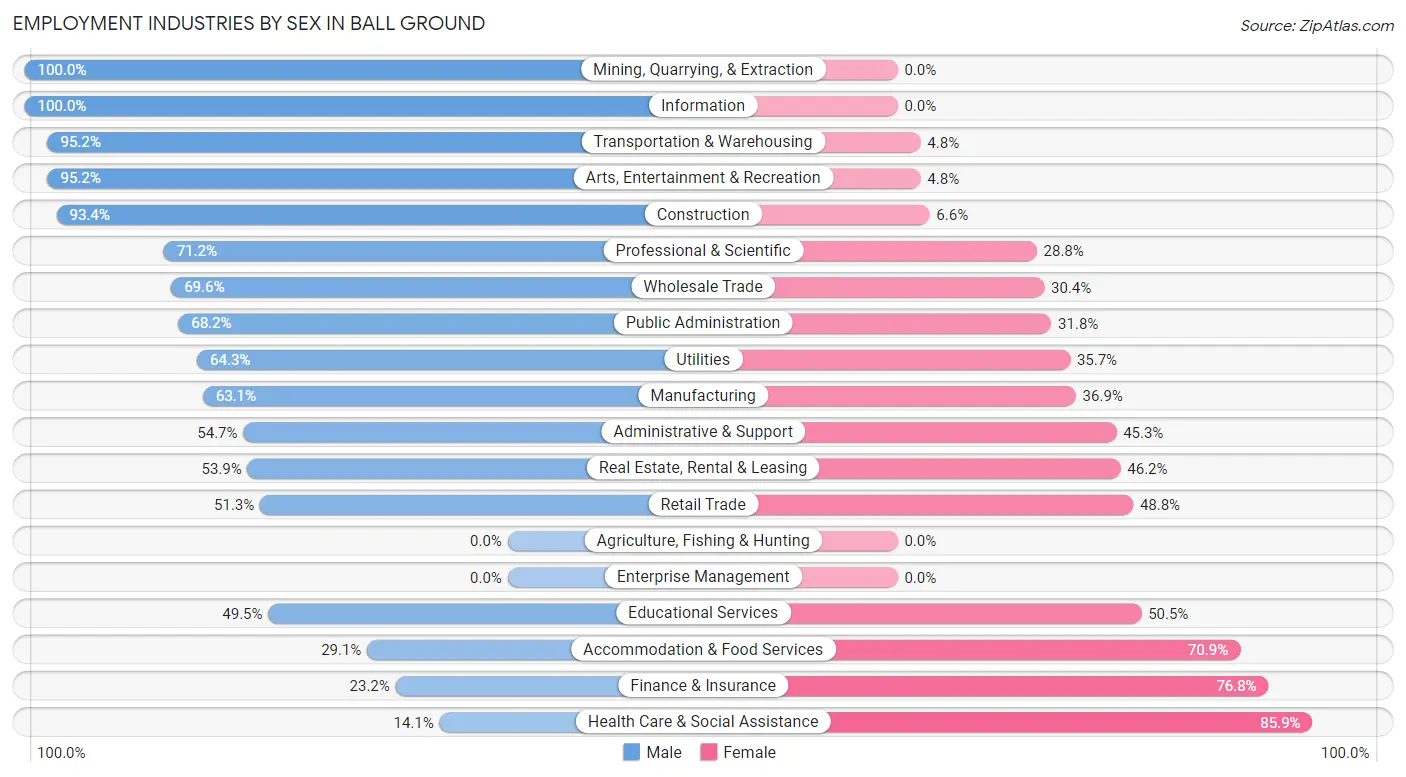
Employment Industries by Sex in Ball Ground
The Ball Ground industries that see more men than women are Mining, Quarrying, & Extraction (100.0%), Information (100.0%), and Transportation & Warehousing (95.2%), whereas the industries that tend to have a higher number of women are Health Care & Social Assistance (85.9%), Finance & Insurance (76.8%), and Accommodation & Food Services (70.9%).
| Industry | Male | Female |
| Agriculture, Fishing & Hunting | 0 (0.0%) | 0 (0.0%) |
| Mining, Quarrying, & Extraction | 6 (100.0%) | 0 (0.0%) |
| Construction | 127 (93.4%) | 9 (6.6%) |
| Manufacturing | 77 (63.1%) | 45 (36.9%) |
| Wholesale Trade | 39 (69.6%) | 17 (30.4%) |
| Retail Trade | 41 (51.2%) | 39 (48.7%) |
| Transportation & Warehousing | 100 (95.2%) | 5 (4.8%) |
| Utilities | 9 (64.3%) | 5 (35.7%) |
| Information | 9 (100.0%) | 0 (0.0%) |
| Finance & Insurance | 13 (23.2%) | 43 (76.8%) |
| Real Estate, Rental & Leasing | 7 (53.8%) | 6 (46.2%) |
| Professional & Scientific | 126 (71.2%) | 51 (28.8%) |
| Enterprise Management | 0 (0.0%) | 0 (0.0%) |
| Administrative & Support | 29 (54.7%) | 24 (45.3%) |
| Educational Services | 54 (49.5%) | 55 (50.5%) |
| Health Care & Social Assistance | 23 (14.1%) | 140 (85.9%) |
| Arts, Entertainment & Recreation | 60 (95.2%) | 3 (4.8%) |
| Accommodation & Food Services | 32 (29.1%) | 78 (70.9%) |
| Public Administration | 75 (68.2%) | 35 (31.8%) |
| Total | 867 (59.8%) | 583 (40.2%) |
Education in Ball Ground
School Enrollment in Ball Ground
The most common levels of schooling among the 659 students in Ball Ground are elementary school (189 | 28.7%), college / undergraduate (129 | 19.6%), and middle school (127 | 19.3%).
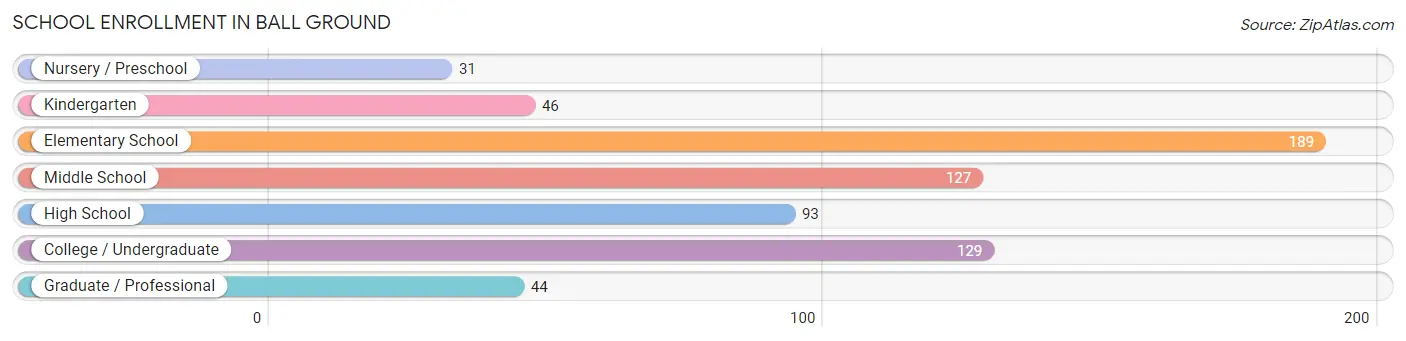
| School Level | # Students | % Students |
| Nursery / Preschool | 31 | 4.7% |
| Kindergarten | 46 | 7.0% |
| Elementary School | 189 | 28.7% |
| Middle School | 127 | 19.3% |
| High School | 93 | 14.1% |
| College / Undergraduate | 129 | 19.6% |
| Graduate / Professional | 44 | 6.7% |
| Total | 659 | 100.0% |
School Enrollment by Age by Funding Source in Ball Ground
Out of a total of 659 students who are enrolled in schools in Ball Ground, 128 (19.4%) attend a private institution, while the remaining 531 (80.6%) are enrolled in public schools. The age group of 25 to 34 year olds has the highest likelihood of being enrolled in private schools, with 39 (79.6% in the age bracket) enrolled. Conversely, the age group of 18 to 19 year olds has the lowest likelihood of being enrolled in a private school, with 15 (100.0% in the age bracket) attending a public institution.
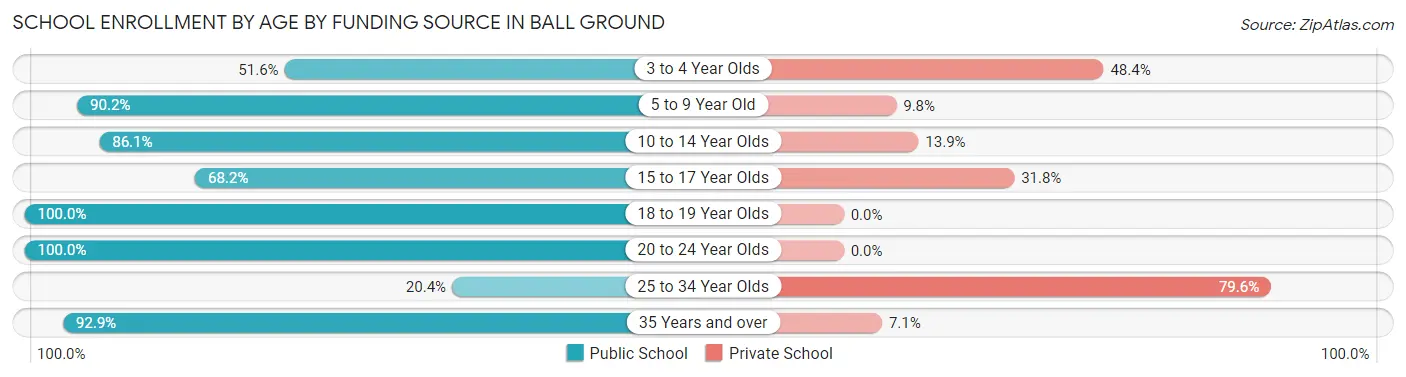
| Age Bracket | Public School | Private School |
| 3 to 4 Year Olds | 16 (51.6%) | 15 (48.4%) |
| 5 to 9 Year Old | 184 (90.2%) | 20 (9.8%) |
| 10 to 14 Year Olds | 136 (86.1%) | 22 (13.9%) |
| 15 to 17 Year Olds | 58 (68.2%) | 27 (31.8%) |
| 18 to 19 Year Olds | 15 (100.0%) | 0 (0.0%) |
| 20 to 24 Year Olds | 47 (100.0%) | 0 (0.0%) |
| 25 to 34 Year Olds | 10 (20.4%) | 39 (79.6%) |
| 35 Years and over | 65 (92.9%) | 5 (7.1%) |
| Total | 531 (80.6%) | 128 (19.4%) |
Educational Attainment by Field of Study in Ball Ground
Business (177 | 26.4%), computers & mathematics (109 | 16.3%), arts & humanities (69 | 10.3%), education (68 | 10.2%), and social sciences (66 | 9.9%) are the most common fields of study among 670 individuals in Ball Ground who have obtained a bachelor's degree or higher.
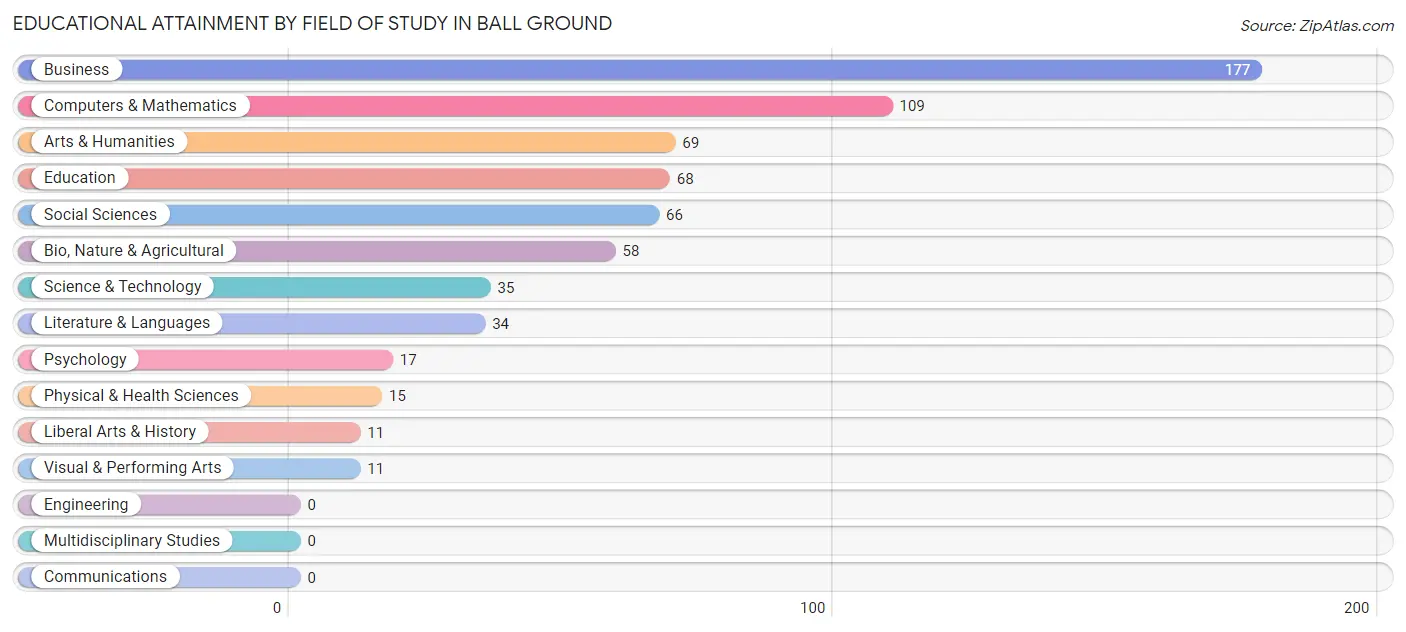
| Field of Study | # Graduates | % Graduates |
| Computers & Mathematics | 109 | 16.3% |
| Bio, Nature & Agricultural | 58 | 8.7% |
| Physical & Health Sciences | 15 | 2.2% |
| Psychology | 17 | 2.5% |
| Social Sciences | 66 | 9.9% |
| Engineering | 0 | 0.0% |
| Multidisciplinary Studies | 0 | 0.0% |
| Science & Technology | 35 | 5.2% |
| Business | 177 | 26.4% |
| Education | 68 | 10.2% |
| Literature & Languages | 34 | 5.1% |
| Liberal Arts & History | 11 | 1.6% |
| Visual & Performing Arts | 11 | 1.6% |
| Communications | 0 | 0.0% |
| Arts & Humanities | 69 | 10.3% |
| Total | 670 | 100.0% |
Transportation & Commute in Ball Ground
Vehicle Availability by Sex in Ball Ground
The most prevalent vehicle ownership categories in Ball Ground are males with 2 vehicles (502, accounting for 58.4%) and females with 2 vehicles (246, making up 87.0%).
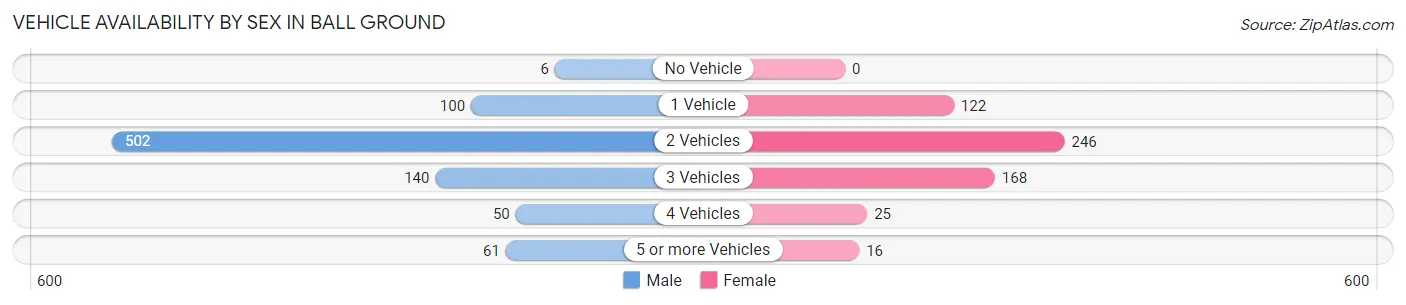
| Vehicles Available | Male | Female |
| No Vehicle | 6 (0.7%) | 0 (0.0%) |
| 1 Vehicle | 100 (11.6%) | 122 (21.1%) |
| 2 Vehicles | 502 (58.4%) | 246 (42.6%) |
| 3 Vehicles | 140 (16.3%) | 168 (29.1%) |
| 4 Vehicles | 50 (5.8%) | 25 (4.3%) |
| 5 or more Vehicles | 61 (7.1%) | 16 (2.8%) |
| Total | 859 (100.0%) | 577 (100.0%) |
Commute Time in Ball Ground
The most frequently occuring commute durations in Ball Ground are 30 to 34 minutes (271 commuters, 20.4%), 20 to 24 minutes (200 commuters, 15.1%), and 45 to 59 minutes (191 commuters, 14.4%).
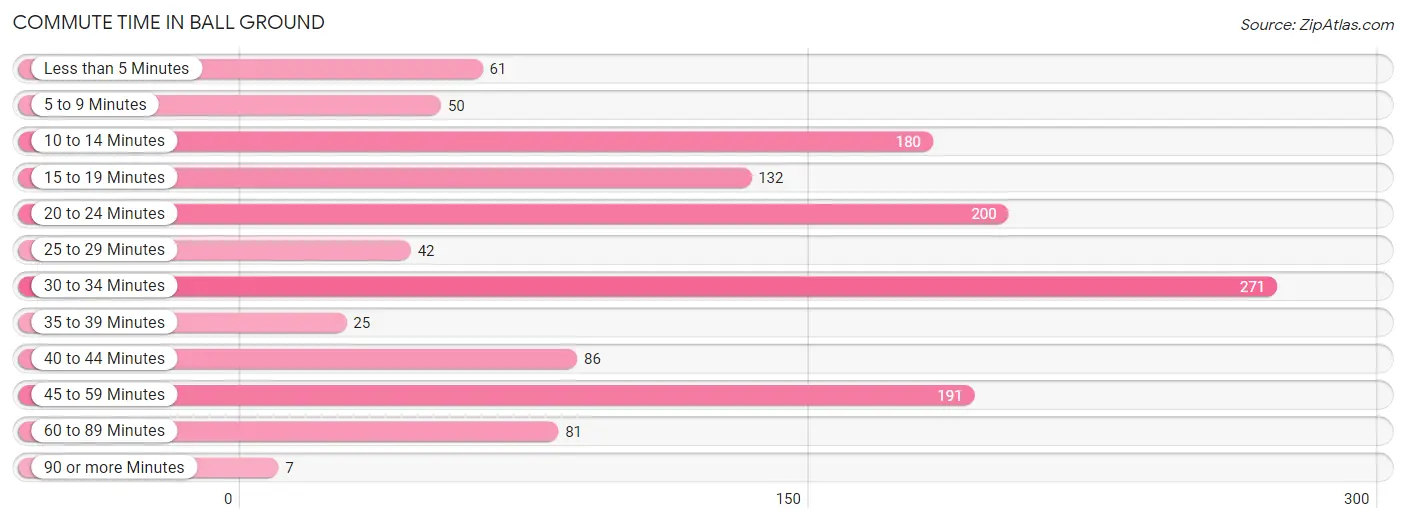
| Commute Time | # Commuters | % Commuters |
| Less than 5 Minutes | 61 | 4.6% |
| 5 to 9 Minutes | 50 | 3.8% |
| 10 to 14 Minutes | 180 | 13.6% |
| 15 to 19 Minutes | 132 | 10.0% |
| 20 to 24 Minutes | 200 | 15.1% |
| 25 to 29 Minutes | 42 | 3.2% |
| 30 to 34 Minutes | 271 | 20.4% |
| 35 to 39 Minutes | 25 | 1.9% |
| 40 to 44 Minutes | 86 | 6.5% |
| 45 to 59 Minutes | 191 | 14.4% |
| 60 to 89 Minutes | 81 | 6.1% |
| 90 or more Minutes | 7 | 0.5% |
Commute Time by Sex in Ball Ground
The most common commute times in Ball Ground are 20 to 24 minutes (159 commuters, 19.8%) for males and 30 to 34 minutes (160 commuters, 30.6%) for females.
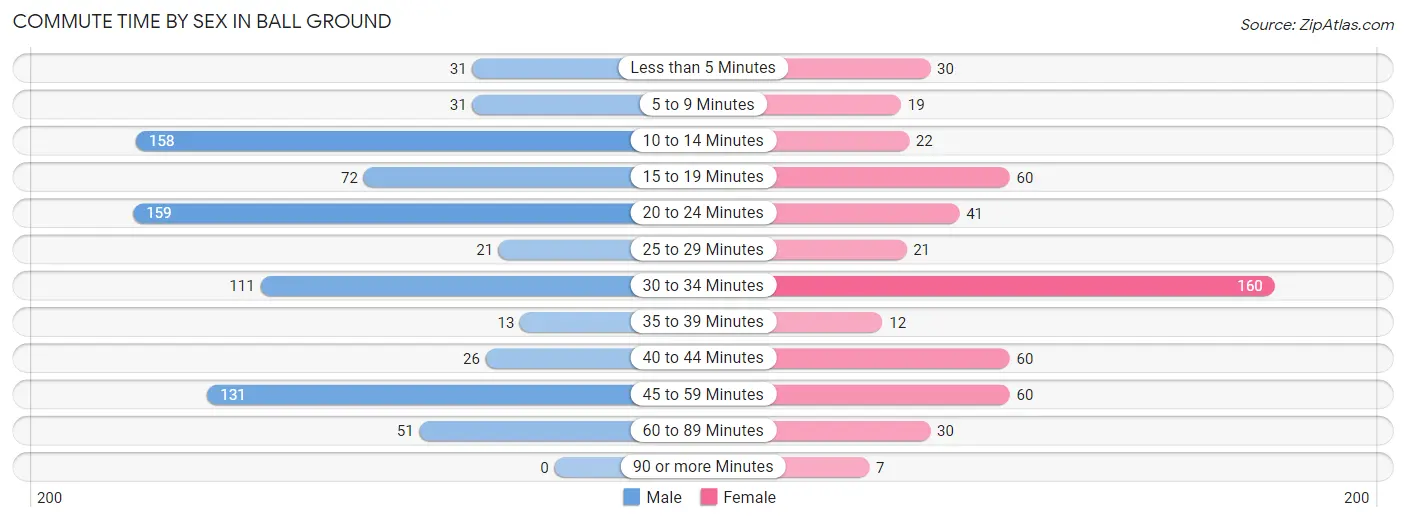
| Commute Time | Male | Female |
| Less than 5 Minutes | 31 (3.9%) | 30 (5.8%) |
| 5 to 9 Minutes | 31 (3.9%) | 19 (3.6%) |
| 10 to 14 Minutes | 158 (19.7%) | 22 (4.2%) |
| 15 to 19 Minutes | 72 (9.0%) | 60 (11.5%) |
| 20 to 24 Minutes | 159 (19.8%) | 41 (7.9%) |
| 25 to 29 Minutes | 21 (2.6%) | 21 (4.0%) |
| 30 to 34 Minutes | 111 (13.8%) | 160 (30.6%) |
| 35 to 39 Minutes | 13 (1.6%) | 12 (2.3%) |
| 40 to 44 Minutes | 26 (3.2%) | 60 (11.5%) |
| 45 to 59 Minutes | 131 (16.3%) | 60 (11.5%) |
| 60 to 89 Minutes | 51 (6.3%) | 30 (5.8%) |
| 90 or more Minutes | 0 (0.0%) | 7 (1.3%) |
Time of Departure to Work by Sex in Ball Ground
The most frequent times of departure to work in Ball Ground are 7:00 AM to 7:29 AM (168, 20.9%) for males and 7:00 AM to 7:29 AM (136, 26.1%) for females.
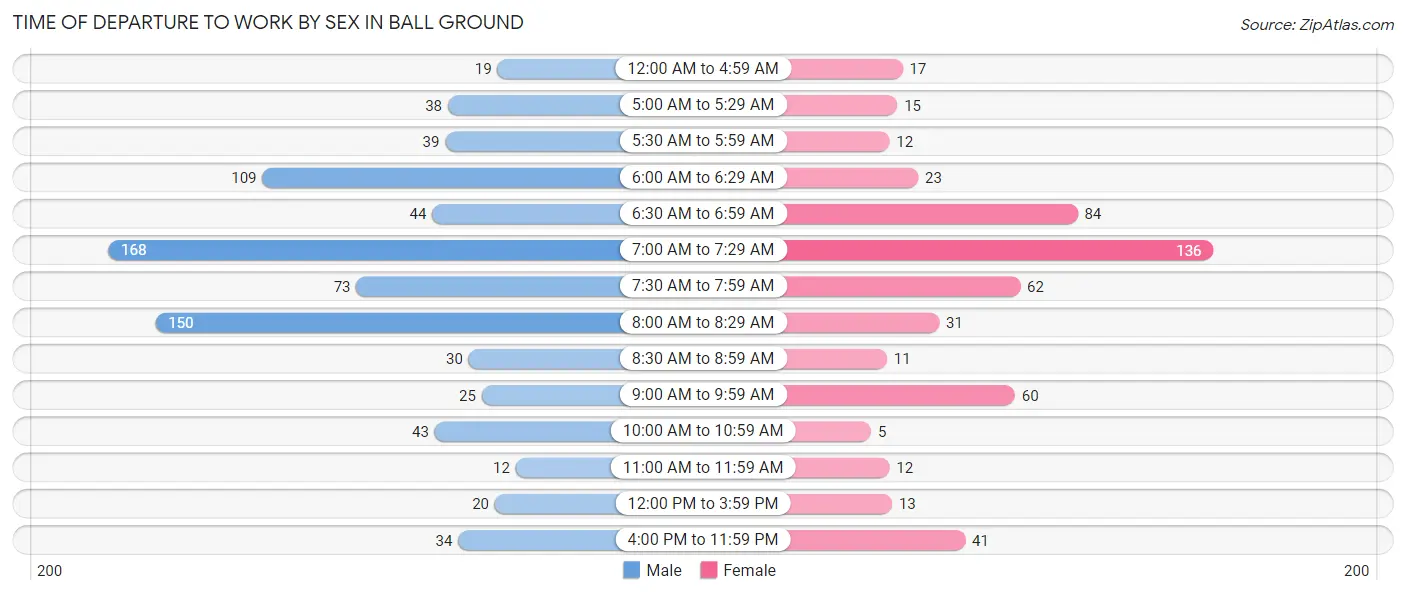
| Time of Departure | Male | Female |
| 12:00 AM to 4:59 AM | 19 (2.4%) | 17 (3.3%) |
| 5:00 AM to 5:29 AM | 38 (4.7%) | 15 (2.9%) |
| 5:30 AM to 5:59 AM | 39 (4.9%) | 12 (2.3%) |
| 6:00 AM to 6:29 AM | 109 (13.6%) | 23 (4.4%) |
| 6:30 AM to 6:59 AM | 44 (5.5%) | 84 (16.1%) |
| 7:00 AM to 7:29 AM | 168 (20.9%) | 136 (26.1%) |
| 7:30 AM to 7:59 AM | 73 (9.1%) | 62 (11.9%) |
| 8:00 AM to 8:29 AM | 150 (18.7%) | 31 (5.9%) |
| 8:30 AM to 8:59 AM | 30 (3.7%) | 11 (2.1%) |
| 9:00 AM to 9:59 AM | 25 (3.1%) | 60 (11.5%) |
| 10:00 AM to 10:59 AM | 43 (5.3%) | 5 (1.0%) |
| 11:00 AM to 11:59 AM | 12 (1.5%) | 12 (2.3%) |
| 12:00 PM to 3:59 PM | 20 (2.5%) | 13 (2.5%) |
| 4:00 PM to 11:59 PM | 34 (4.2%) | 41 (7.9%) |
| Total | 804 (100.0%) | 522 (100.0%) |
Housing Occupancy in Ball Ground
Occupancy by Ownership in Ball Ground
Of the total 1,006 dwellings in Ball Ground, owner-occupied units account for 818 (81.3%), while renter-occupied units make up 188 (18.7%).
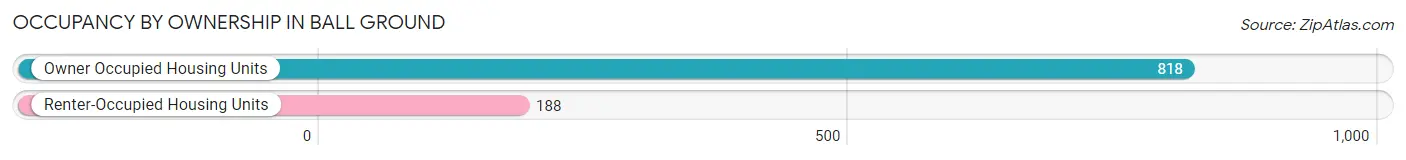
| Occupancy | # Housing Units | % Housing Units |
| Owner Occupied Housing Units | 818 | 81.3% |
| Renter-Occupied Housing Units | 188 | 18.7% |
| Total Occupied Housing Units | 1,006 | 100.0% |
Occupancy by Household Size in Ball Ground
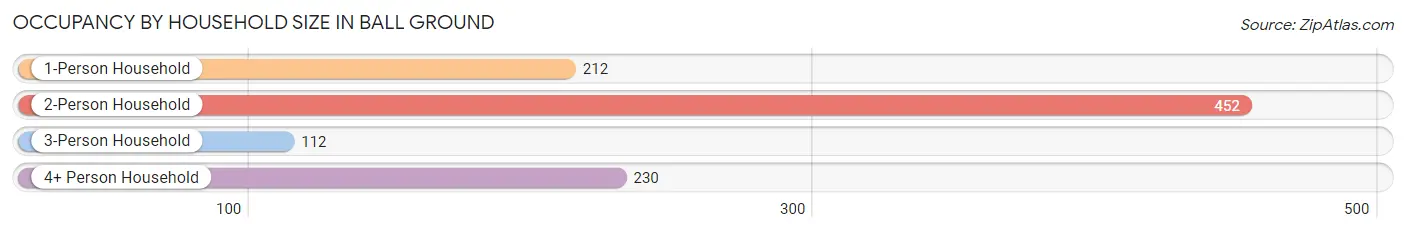
| Household Size | # Housing Units | % Housing Units |
| 1-Person Household | 212 | 21.1% |
| 2-Person Household | 452 | 44.9% |
| 3-Person Household | 112 | 11.1% |
| 4+ Person Household | 230 | 22.9% |
| Total Housing Units | 1,006 | 100.0% |
Occupancy by Ownership by Household Size in Ball Ground
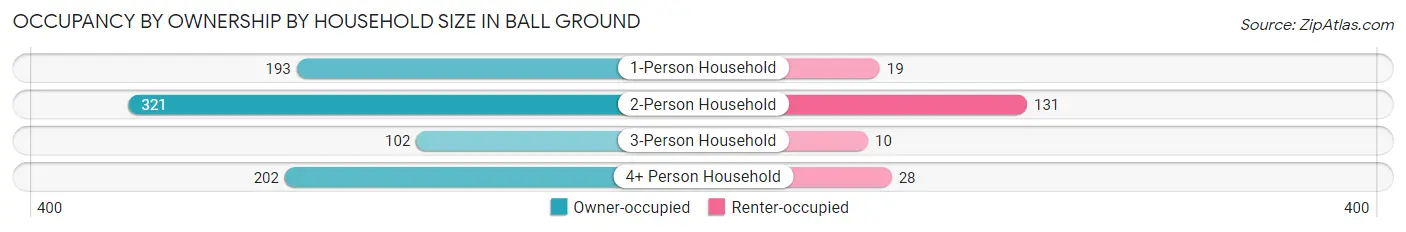
| Household Size | Owner-occupied | Renter-occupied |
| 1-Person Household | 193 (91.0%) | 19 (9.0%) |
| 2-Person Household | 321 (71.0%) | 131 (29.0%) |
| 3-Person Household | 102 (91.1%) | 10 (8.9%) |
| 4+ Person Household | 202 (87.8%) | 28 (12.2%) |
| Total Housing Units | 818 (81.3%) | 188 (18.7%) |
Occupancy by Educational Attainment in Ball Ground
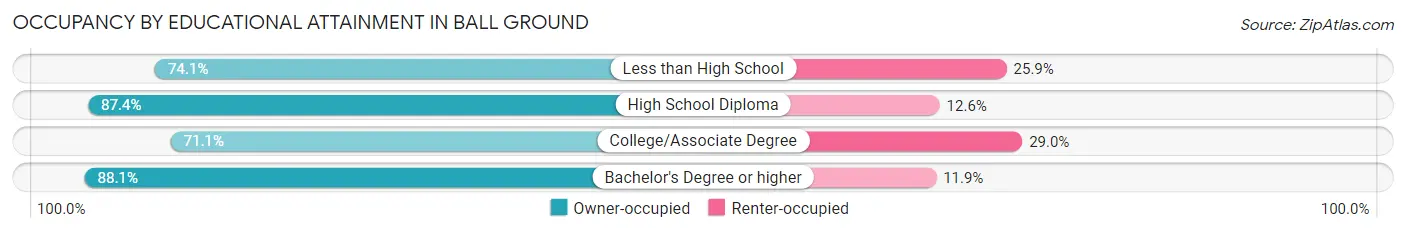
| Household Size | Owner-occupied | Renter-occupied |
| Less than High School | 43 (74.1%) | 15 (25.9%) |
| High School Diploma | 236 (87.4%) | 34 (12.6%) |
| College/Associate Degree | 243 (71.1%) | 99 (28.9%) |
| Bachelor's Degree or higher | 296 (88.1%) | 40 (11.9%) |
Occupancy by Age of Householder in Ball Ground
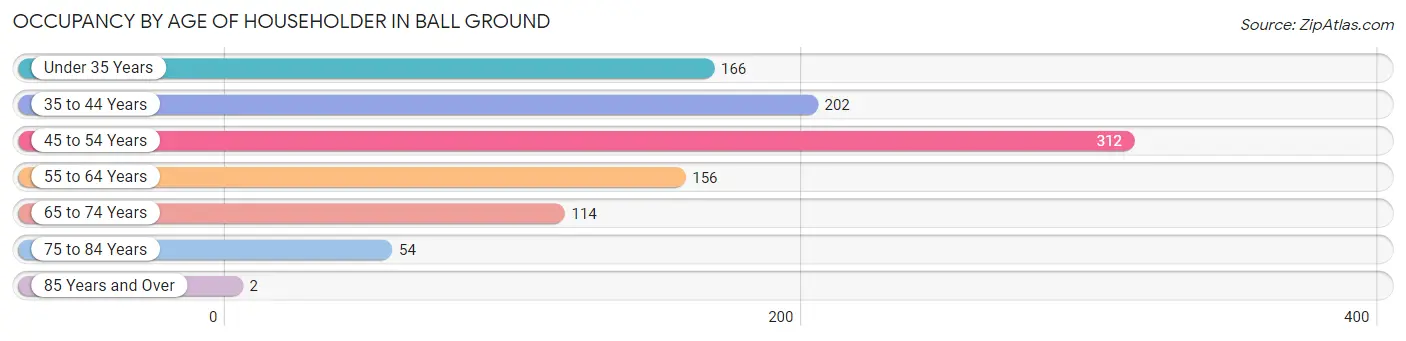
| Age Bracket | # Households | % Households |
| Under 35 Years | 166 | 16.5% |
| 35 to 44 Years | 202 | 20.1% |
| 45 to 54 Years | 312 | 31.0% |
| 55 to 64 Years | 156 | 15.5% |
| 65 to 74 Years | 114 | 11.3% |
| 75 to 84 Years | 54 | 5.4% |
| 85 Years and Over | 2 | 0.2% |
| Total | 1,006 | 100.0% |
Housing Finances in Ball Ground
Median Income by Occupancy in Ball Ground
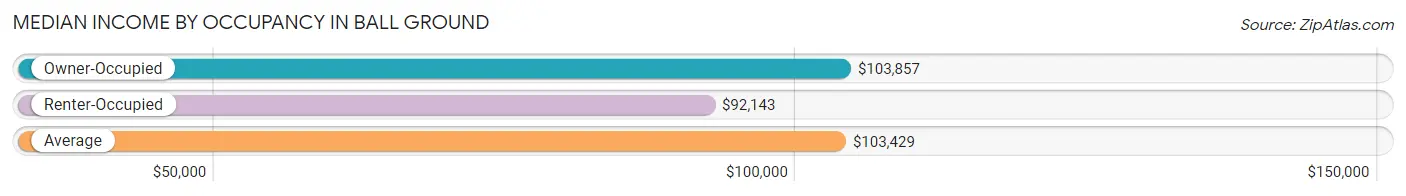
| Occupancy Type | # Households | Median Income |
| Owner-Occupied | 818 (81.3%) | $103,857 |
| Renter-Occupied | 188 (18.7%) | $92,143 |
| Average | 1,006 (100.0%) | $103,429 |
Occupancy by Householder Income Bracket in Ball Ground
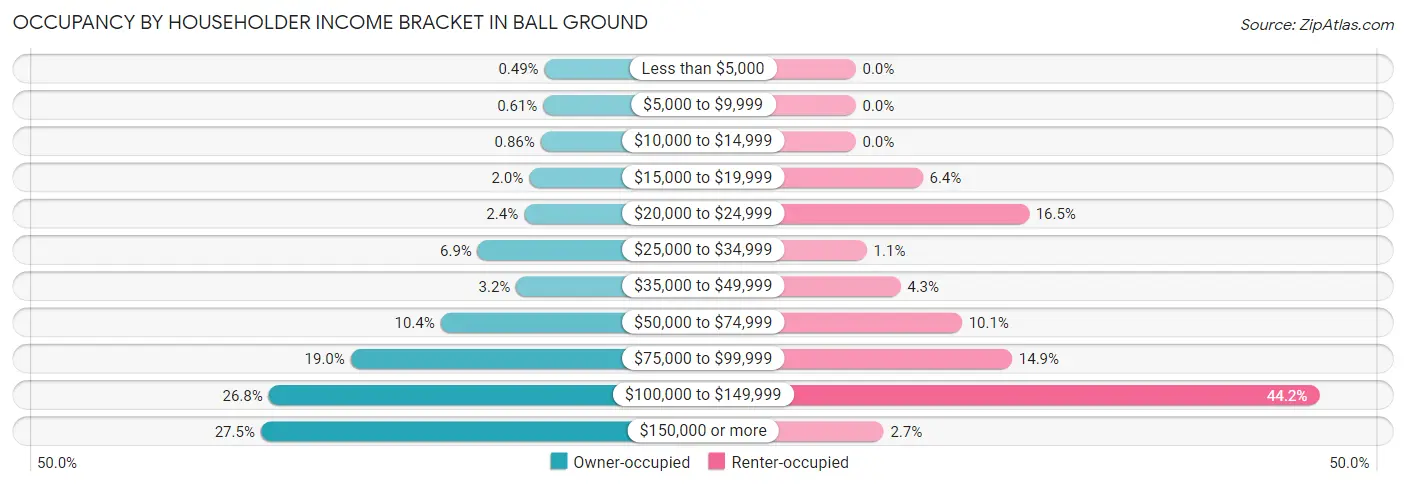
| Income Bracket | Owner-occupied | Renter-occupied |
| Less than $5,000 | 4 (0.5%) | 0 (0.0%) |
| $5,000 to $9,999 | 5 (0.6%) | 0 (0.0%) |
| $10,000 to $14,999 | 7 (0.9%) | 0 (0.0%) |
| $15,000 to $19,999 | 16 (2.0%) | 12 (6.4%) |
| $20,000 to $24,999 | 20 (2.4%) | 31 (16.5%) |
| $25,000 to $34,999 | 56 (6.9%) | 2 (1.1%) |
| $35,000 to $49,999 | 26 (3.2%) | 8 (4.3%) |
| $50,000 to $74,999 | 85 (10.4%) | 19 (10.1%) |
| $75,000 to $99,999 | 155 (19.0%) | 28 (14.9%) |
| $100,000 to $149,999 | 219 (26.8%) | 83 (44.2%) |
| $150,000 or more | 225 (27.5%) | 5 (2.7%) |
| Total | 818 (100.0%) | 188 (100.0%) |
Monthly Housing Cost Tiers in Ball Ground
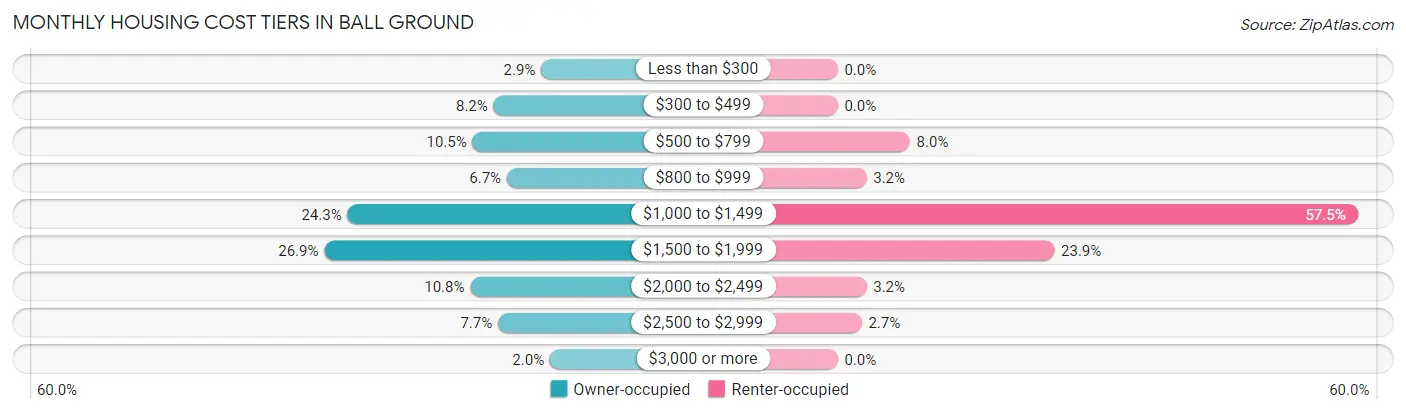
| Monthly Cost | Owner-occupied | Renter-occupied |
| Less than $300 | 24 (2.9%) | 0 (0.0%) |
| $300 to $499 | 67 (8.2%) | 0 (0.0%) |
| $500 to $799 | 86 (10.5%) | 15 (8.0%) |
| $800 to $999 | 55 (6.7%) | 6 (3.2%) |
| $1,000 to $1,499 | 199 (24.3%) | 108 (57.5%) |
| $1,500 to $1,999 | 220 (26.9%) | 45 (23.9%) |
| $2,000 to $2,499 | 88 (10.8%) | 6 (3.2%) |
| $2,500 to $2,999 | 63 (7.7%) | 5 (2.7%) |
| $3,000 or more | 16 (2.0%) | 0 (0.0%) |
| Total | 818 (100.0%) | 188 (100.0%) |
Physical Housing Characteristics in Ball Ground
Housing Structures in Ball Ground
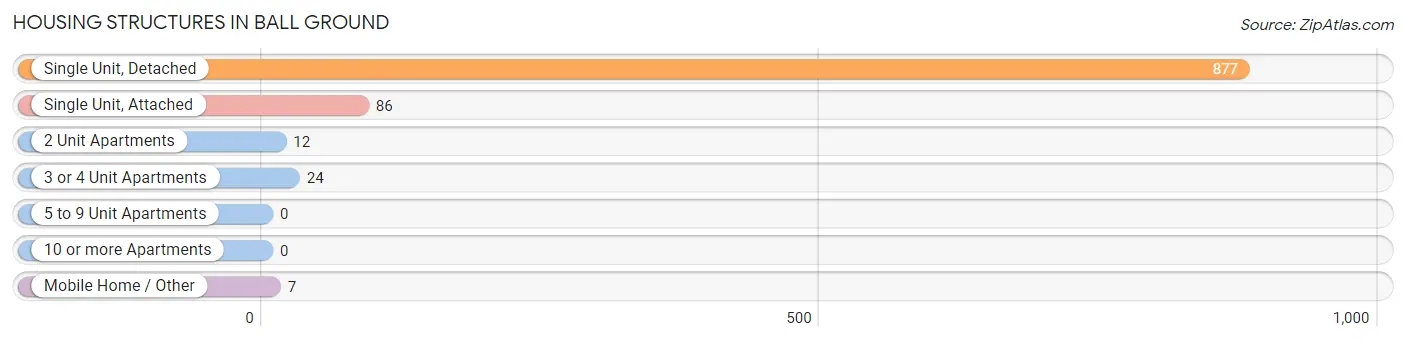
| Structure Type | # Housing Units | % Housing Units |
| Single Unit, Detached | 877 | 87.2% |
| Single Unit, Attached | 86 | 8.6% |
| 2 Unit Apartments | 12 | 1.2% |
| 3 or 4 Unit Apartments | 24 | 2.4% |
| 5 to 9 Unit Apartments | 0 | 0.0% |
| 10 or more Apartments | 0 | 0.0% |
| Mobile Home / Other | 7 | 0.7% |
| Total | 1,006 | 100.0% |
Housing Structures by Occupancy in Ball Ground
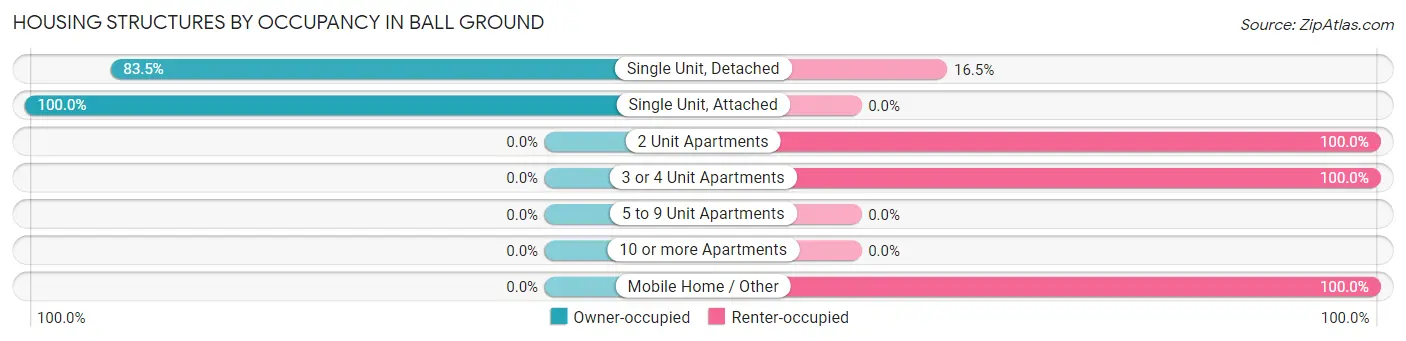
| Structure Type | Owner-occupied | Renter-occupied |
| Single Unit, Detached | 732 (83.5%) | 145 (16.5%) |
| Single Unit, Attached | 86 (100.0%) | 0 (0.0%) |
| 2 Unit Apartments | 0 (0.0%) | 12 (100.0%) |
| 3 or 4 Unit Apartments | 0 (0.0%) | 24 (100.0%) |
| 5 to 9 Unit Apartments | 0 (0.0%) | 0 (0.0%) |
| 10 or more Apartments | 0 (0.0%) | 0 (0.0%) |
| Mobile Home / Other | 0 (0.0%) | 7 (100.0%) |
| Total | 818 (81.3%) | 188 (18.7%) |
Housing Structures by Number of Rooms in Ball Ground
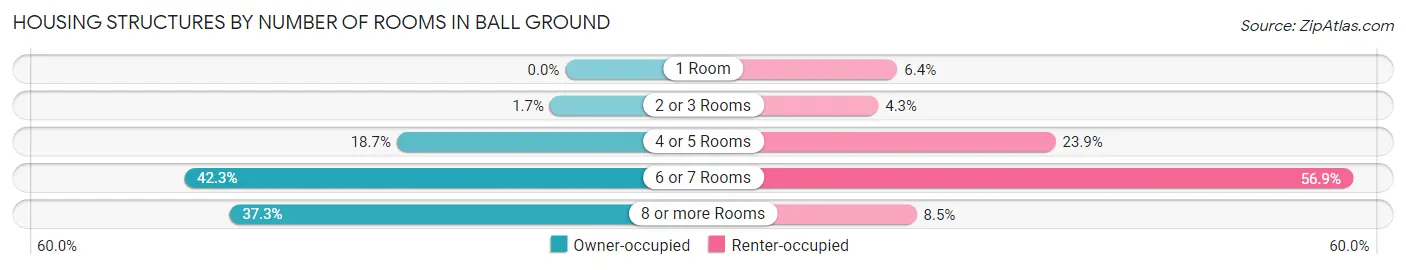
| Number of Rooms | Owner-occupied | Renter-occupied |
| 1 Room | 0 (0.0%) | 12 (6.4%) |
| 2 or 3 Rooms | 14 (1.7%) | 8 (4.3%) |
| 4 or 5 Rooms | 153 (18.7%) | 45 (23.9%) |
| 6 or 7 Rooms | 346 (42.3%) | 107 (56.9%) |
| 8 or more Rooms | 305 (37.3%) | 16 (8.5%) |
| Total | 818 (100.0%) | 188 (100.0%) |
Housing Structure by Heating Type in Ball Ground
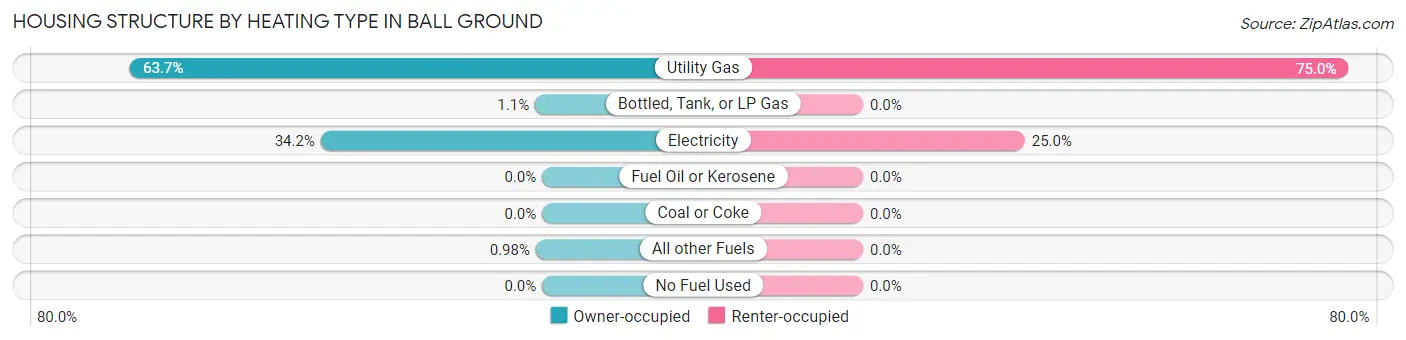
| Heating Type | Owner-occupied | Renter-occupied |
| Utility Gas | 521 (63.7%) | 141 (75.0%) |
| Bottled, Tank, or LP Gas | 9 (1.1%) | 0 (0.0%) |
| Electricity | 280 (34.2%) | 47 (25.0%) |
| Fuel Oil or Kerosene | 0 (0.0%) | 0 (0.0%) |
| Coal or Coke | 0 (0.0%) | 0 (0.0%) |
| All other Fuels | 8 (1.0%) | 0 (0.0%) |
| No Fuel Used | 0 (0.0%) | 0 (0.0%) |
| Total | 818 (100.0%) | 188 (100.0%) |
Household Vehicle Usage in Ball Ground
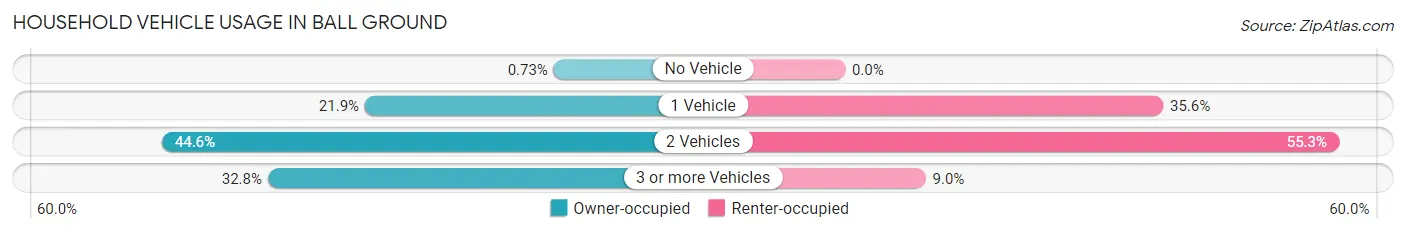
| Vehicles per Household | Owner-occupied | Renter-occupied |
| No Vehicle | 6 (0.7%) | 0 (0.0%) |
| 1 Vehicle | 179 (21.9%) | 67 (35.6%) |
| 2 Vehicles | 365 (44.6%) | 104 (55.3%) |
| 3 or more Vehicles | 268 (32.8%) | 17 (9.0%) |
| Total | 818 (100.0%) | 188 (100.0%) |
Real Estate & Mortgages in Ball Ground
Real Estate and Mortgage Overview in Ball Ground
| Characteristic | Without Mortgage | With Mortgage |
| Housing Units | 187 | 631 |
| Median Property Value | $303,100 | $320,800 |
| Median Household Income | $86,250 | $195 |
| Monthly Housing Costs | $507 | $16 |
| Real Estate Taxes | $1,335 | $8 |
Property Value by Mortgage Status in Ball Ground
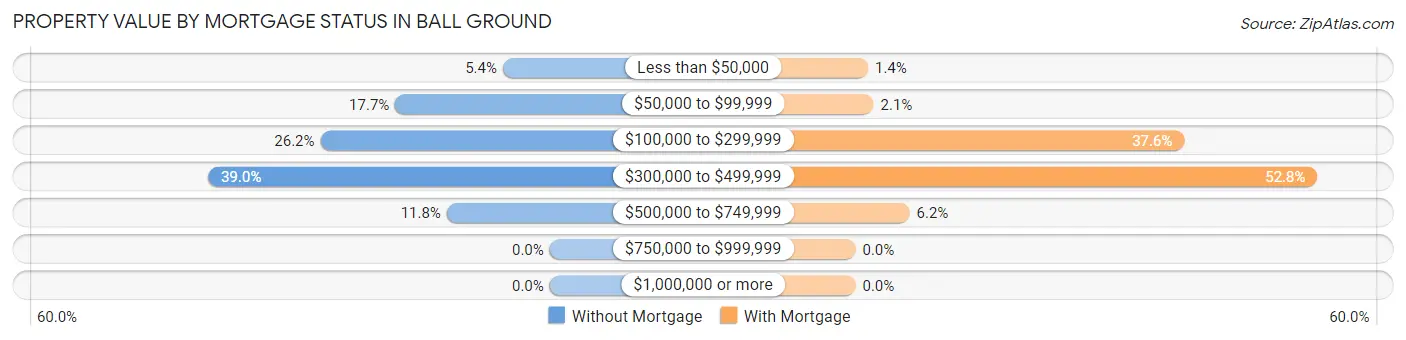
| Property Value | Without Mortgage | With Mortgage |
| Less than $50,000 | 10 (5.3%) | 9 (1.4%) |
| $50,000 to $99,999 | 33 (17.6%) | 13 (2.1%) |
| $100,000 to $299,999 | 49 (26.2%) | 237 (37.6%) |
| $300,000 to $499,999 | 73 (39.0%) | 333 (52.8%) |
| $500,000 to $749,999 | 22 (11.8%) | 39 (6.2%) |
| $750,000 to $999,999 | 0 (0.0%) | 0 (0.0%) |
| $1,000,000 or more | 0 (0.0%) | 0 (0.0%) |
| Total | 187 (100.0%) | 631 (100.0%) |
Household Income by Mortgage Status in Ball Ground
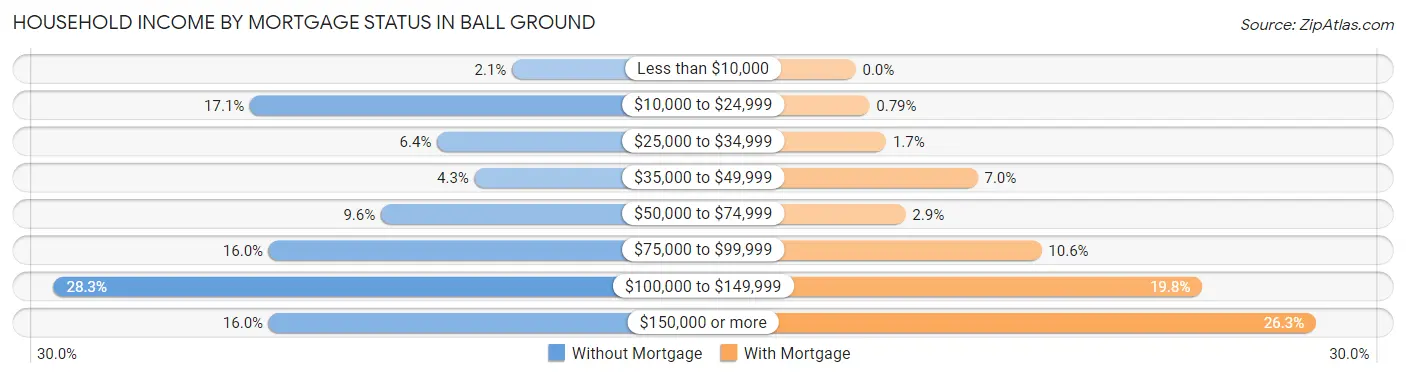
| Household Income | Without Mortgage | With Mortgage |
| Less than $10,000 | 4 (2.1%) | 0 (0.0%) |
| $10,000 to $24,999 | 32 (17.1%) | 5 (0.8%) |
| $25,000 to $34,999 | 12 (6.4%) | 11 (1.7%) |
| $35,000 to $49,999 | 8 (4.3%) | 44 (7.0%) |
| $50,000 to $74,999 | 18 (9.6%) | 18 (2.9%) |
| $75,000 to $99,999 | 30 (16.0%) | 67 (10.6%) |
| $100,000 to $149,999 | 53 (28.3%) | 125 (19.8%) |
| $150,000 or more | 30 (16.0%) | 166 (26.3%) |
| Total | 187 (100.0%) | 631 (100.0%) |
Property Value to Household Income Ratio in Ball Ground
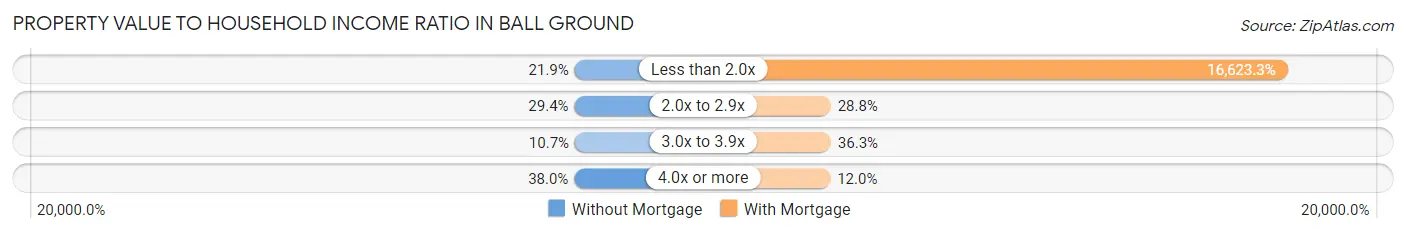
| Value-to-Income Ratio | Without Mortgage | With Mortgage |
| Less than 2.0x | 41 (21.9%) | 104,893 (16,623.3%) |
| 2.0x to 2.9x | 55 (29.4%) | 182 (28.8%) |
| 3.0x to 3.9x | 20 (10.7%) | 229 (36.3%) |
| 4.0x or more | 71 (38.0%) | 76 (12.0%) |
| Total | 187 (100.0%) | 631 (100.0%) |
Real Estate Taxes by Mortgage Status in Ball Ground
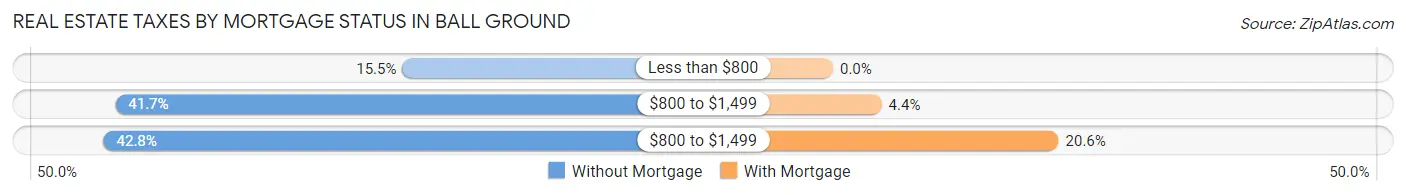
| Property Taxes | Without Mortgage | With Mortgage |
| Less than $800 | 29 (15.5%) | 0 (0.0%) |
| $800 to $1,499 | 78 (41.7%) | 28 (4.4%) |
| $800 to $1,499 | 80 (42.8%) | 130 (20.6%) |
| Total | 187 (100.0%) | 631 (100.0%) |
Health & Disability in Ball Ground
Health Insurance Coverage by Age in Ball Ground
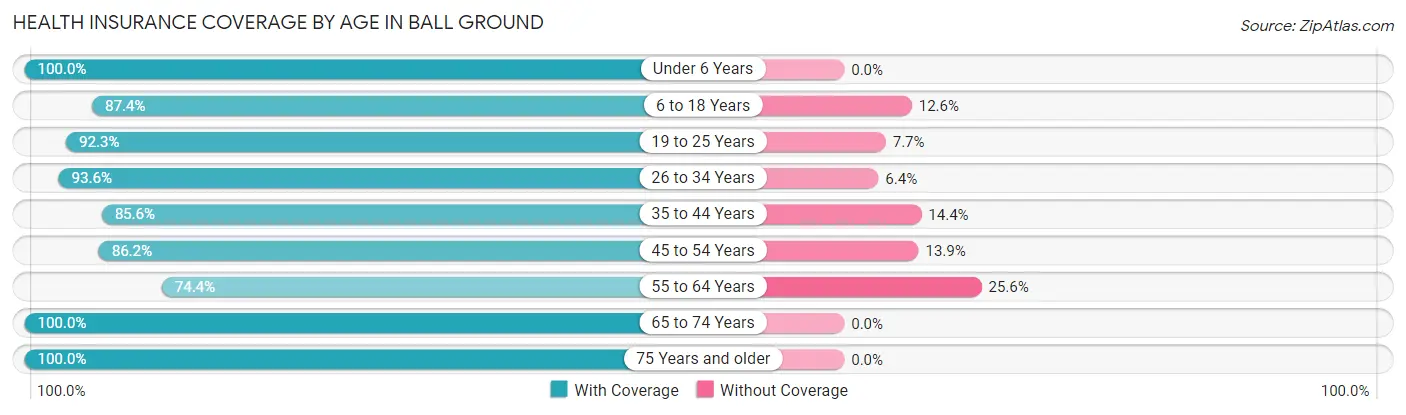
| Age Bracket | With Coverage | Without Coverage |
| Under 6 Years | 161 (100.0%) | 0 (0.0%) |
| 6 to 18 Years | 368 (87.4%) | 53 (12.6%) |
| 19 to 25 Years | 143 (92.3%) | 12 (7.7%) |
| 26 to 34 Years | 383 (93.6%) | 26 (6.4%) |
| 35 to 44 Years | 268 (85.6%) | 45 (14.4%) |
| 45 to 54 Years | 398 (86.2%) | 64 (13.9%) |
| 55 to 64 Years | 218 (74.4%) | 75 (25.6%) |
| 65 to 74 Years | 230 (100.0%) | 0 (0.0%) |
| 75 Years and older | 83 (100.0%) | 0 (0.0%) |
| Total | 2,252 (89.1%) | 275 (10.9%) |
Health Insurance Coverage by Citizenship Status in Ball Ground
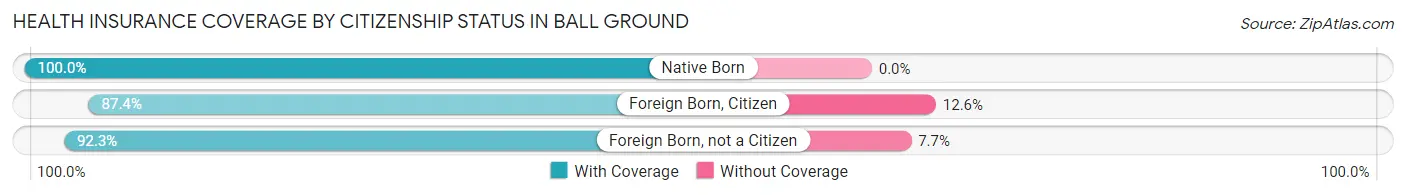
| Citizenship Status | With Coverage | Without Coverage |
| Native Born | 161 (100.0%) | 0 (0.0%) |
| Foreign Born, Citizen | 368 (87.4%) | 53 (12.6%) |
| Foreign Born, not a Citizen | 143 (92.3%) | 12 (7.7%) |
Health Insurance Coverage by Household Income in Ball Ground
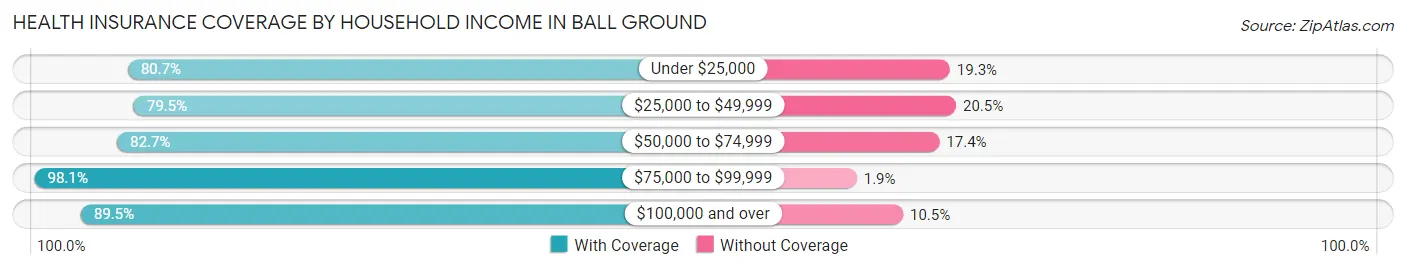
| Household Income | With Coverage | Without Coverage |
| Under $25,000 | 142 (80.7%) | 34 (19.3%) |
| $25,000 to $49,999 | 136 (79.5%) | 35 (20.5%) |
| $50,000 to $74,999 | 162 (82.7%) | 34 (17.3%) |
| $75,000 to $99,999 | 420 (98.1%) | 8 (1.9%) |
| $100,000 and over | 1,392 (89.5%) | 164 (10.5%) |
Public vs Private Health Insurance Coverage by Age in Ball Ground
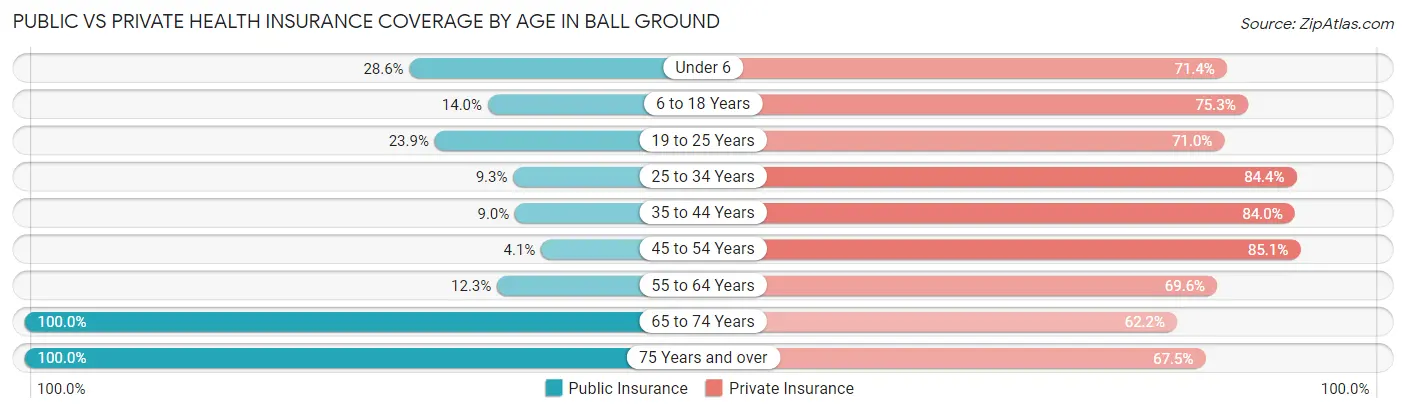
| Age Bracket | Public Insurance | Private Insurance |
| Under 6 | 46 (28.6%) | 115 (71.4%) |
| 6 to 18 Years | 59 (14.0%) | 317 (75.3%) |
| 19 to 25 Years | 37 (23.9%) | 110 (71.0%) |
| 25 to 34 Years | 38 (9.3%) | 345 (84.4%) |
| 35 to 44 Years | 28 (8.9%) | 263 (84.0%) |
| 45 to 54 Years | 19 (4.1%) | 393 (85.1%) |
| 55 to 64 Years | 36 (12.3%) | 204 (69.6%) |
| 65 to 74 Years | 230 (100.0%) | 143 (62.2%) |
| 75 Years and over | 83 (100.0%) | 56 (67.5%) |
| Total | 576 (22.8%) | 1,946 (77.0%) |
Disability Status by Sex by Age in Ball Ground
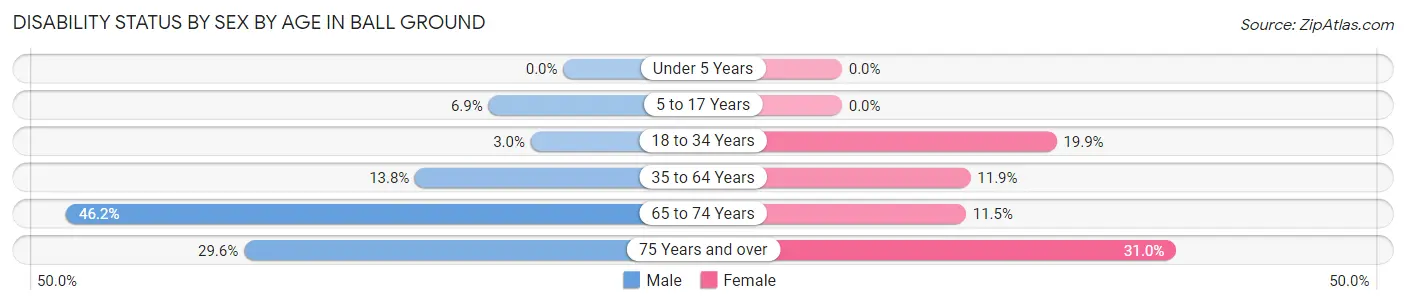
| Age Bracket | Male | Female |
| Under 5 Years | 0 (0.0%) | 0 (0.0%) |
| 5 to 17 Years | 15 (6.9%) | 0 (0.0%) |
| 18 to 34 Years | 10 (3.0%) | 47 (19.9%) |
| 35 to 64 Years | 80 (13.8%) | 58 (11.9%) |
| 65 to 74 Years | 42 (46.2%) | 16 (11.5%) |
| 75 Years and over | 16 (29.6%) | 9 (31.0%) |
Disability Class by Sex by Age in Ball Ground
Disability Class: Hearing Difficulty
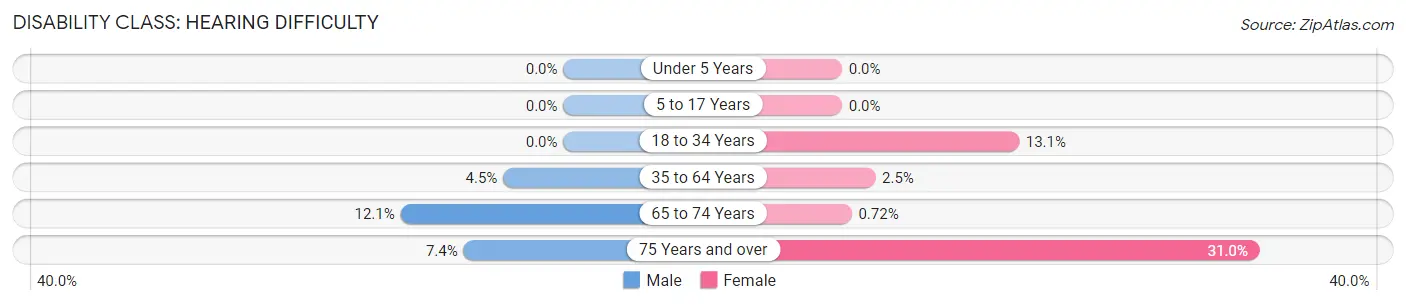
| Age Bracket | Male | Female |
| Under 5 Years | 0 (0.0%) | 0 (0.0%) |
| 5 to 17 Years | 0 (0.0%) | 0 (0.0%) |
| 18 to 34 Years | 0 (0.0%) | 31 (13.1%) |
| 35 to 64 Years | 26 (4.5%) | 12 (2.5%) |
| 65 to 74 Years | 11 (12.1%) | 1 (0.7%) |
| 75 Years and over | 4 (7.4%) | 9 (31.0%) |
Disability Class: Vision Difficulty
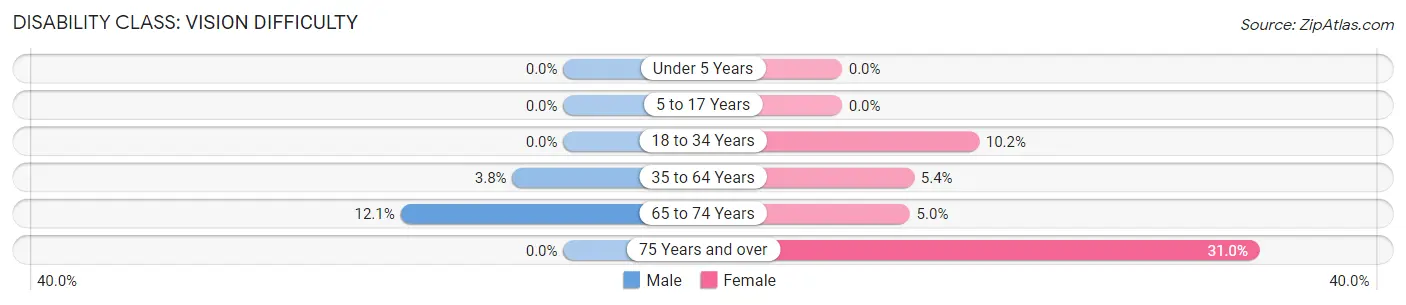
| Age Bracket | Male | Female |
| Under 5 Years | 0 (0.0%) | 0 (0.0%) |
| 5 to 17 Years | 0 (0.0%) | 0 (0.0%) |
| 18 to 34 Years | 0 (0.0%) | 24 (10.2%) |
| 35 to 64 Years | 22 (3.8%) | 26 (5.3%) |
| 65 to 74 Years | 11 (12.1%) | 7 (5.0%) |
| 75 Years and over | 0 (0.0%) | 9 (31.0%) |
Disability Class: Cognitive Difficulty
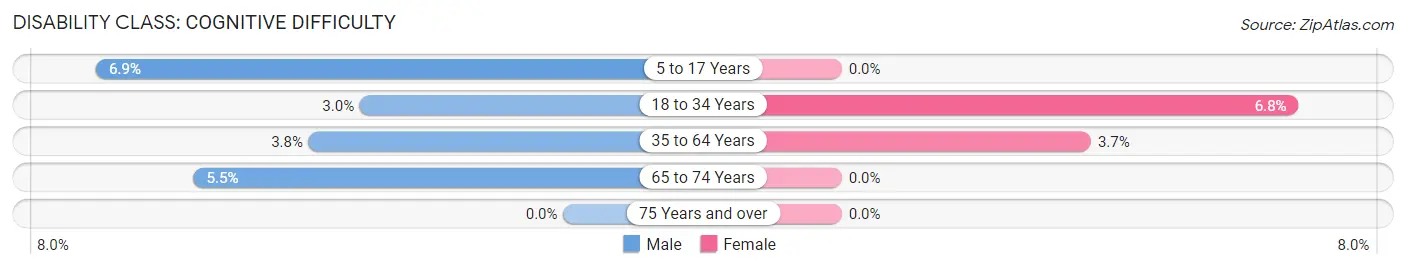
| Age Bracket | Male | Female |
| 5 to 17 Years | 15 (6.9%) | 0 (0.0%) |
| 18 to 34 Years | 10 (3.0%) | 16 (6.8%) |
| 35 to 64 Years | 22 (3.8%) | 18 (3.7%) |
| 65 to 74 Years | 5 (5.5%) | 0 (0.0%) |
| 75 Years and over | 0 (0.0%) | 0 (0.0%) |
Disability Class: Ambulatory Difficulty
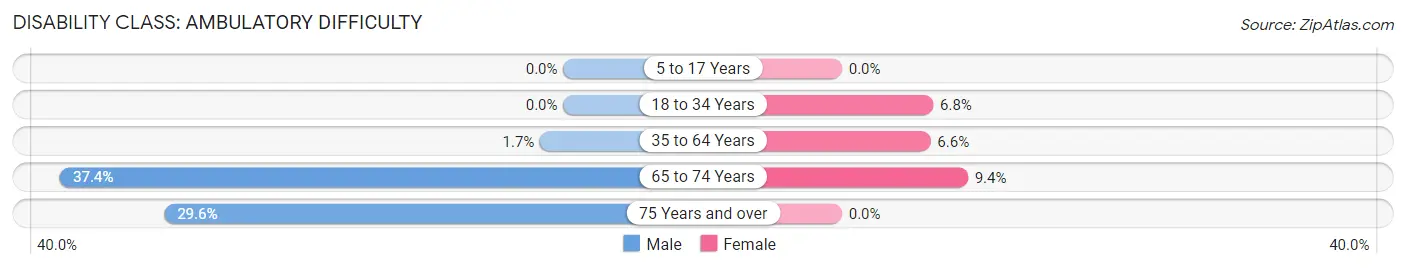
| Age Bracket | Male | Female |
| 5 to 17 Years | 0 (0.0%) | 0 (0.0%) |
| 18 to 34 Years | 0 (0.0%) | 16 (6.8%) |
| 35 to 64 Years | 10 (1.7%) | 32 (6.6%) |
| 65 to 74 Years | 34 (37.4%) | 13 (9.3%) |
| 75 Years and over | 16 (29.6%) | 0 (0.0%) |
Disability Class: Self-Care Difficulty
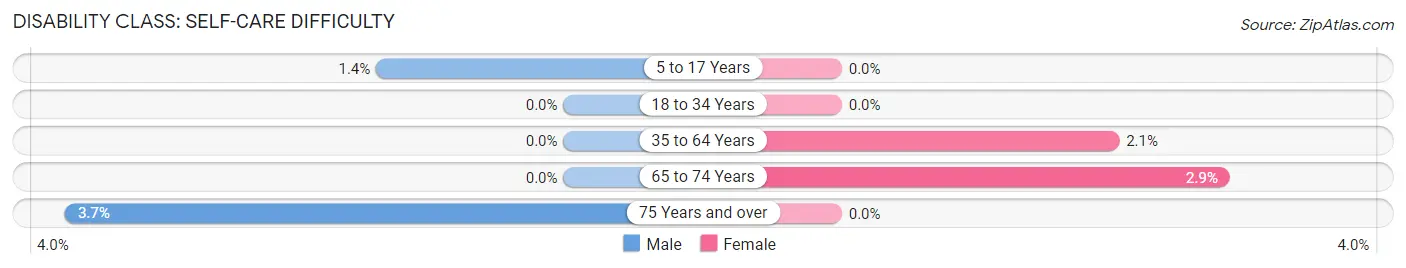
| Age Bracket | Male | Female |
| 5 to 17 Years | 3 (1.4%) | 0 (0.0%) |
| 18 to 34 Years | 0 (0.0%) | 0 (0.0%) |
| 35 to 64 Years | 0 (0.0%) | 10 (2.1%) |
| 65 to 74 Years | 0 (0.0%) | 4 (2.9%) |
| 75 Years and over | 2 (3.7%) | 0 (0.0%) |
Technology Access in Ball Ground
Computing Device Access in Ball Ground
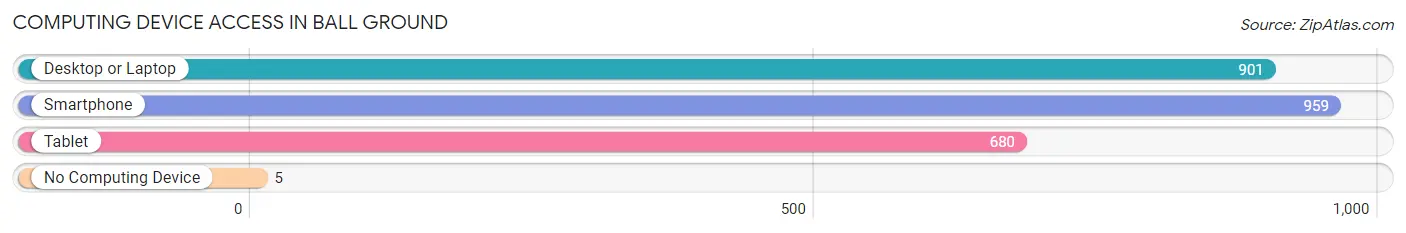
| Device Type | # Households | % Households |
| Desktop or Laptop | 901 | 89.6% |
| Smartphone | 959 | 95.3% |
| Tablet | 680 | 67.6% |
| No Computing Device | 5 | 0.5% |
| Total | 1,006 | 100.0% |
Internet Access in Ball Ground
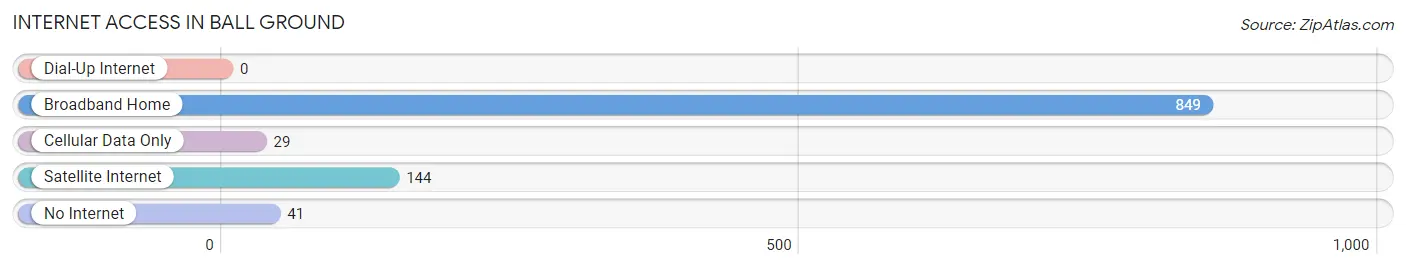
| Internet Type | # Households | % Households |
| Dial-Up Internet | 0 | 0.0% |
| Broadband Home | 849 | 84.4% |
| Cellular Data Only | 29 | 2.9% |
| Satellite Internet | 144 | 14.3% |
| No Internet | 41 | 4.1% |
| Total | 1,006 | 100.0% |
Ball Ground Summary
History
Ball Ground is a city located in Cherokee County, Georgia, United States. It is part of the Atlanta metropolitan area. The city was founded in 1832 and incorporated in 1887. The city was named after a large round boulder that was used by Native Americans for playing a game similar to modern-day lacrosse.
The area was first settled by the Cherokee Indians, who called it "Tsalagi" or "Cherokee." The first white settlers arrived in the area in the early 1800s. The town was originally known as "Ball Ground," after the large round boulder that was used by the Cherokee for playing a game similar to modern-day lacrosse.
In 1832, the Georgia General Assembly passed an act to incorporate the town of Ball Ground. The town was officially incorporated in 1887.
In the late 1800s, the town was a major center for the production of cotton and other agricultural products. The town also had a thriving lumber industry.
In the early 1900s, the town began to experience a period of growth and development. The town was home to several businesses, including a cotton gin, a grist mill, a sawmill, a brickyard, and a canning factory.
In the 1950s, the town experienced a period of decline as the local economy shifted away from agriculture and manufacturing. The town was also affected by the construction of Interstate 575, which bypassed the town.
In the late 1990s, the town began to experience a period of revitalization. The town was designated as a Main Street Community in 1998, and the downtown area was revitalized with new businesses and restaurants.
Geography
Ball Ground is located in Cherokee County, Georgia, in the foothills of the Blue Ridge Mountains. The city is situated at the intersection of Interstate 575 and Georgia State Route 372. The city is located approximately 40 miles north of Atlanta.
The city has a total area of 2.2 square miles, all of which is land. The city is located at an elevation of 1,068 feet above sea level.
The city is located in a humid subtropical climate zone, with hot, humid summers and mild winters. The average annual temperature is 61 degrees Fahrenheit, with an average high of 79 degrees in July and an average low of 43 degrees in January.
Economy
The economy of Ball Ground is largely based on tourism and retail. The city is home to several restaurants, shops, and other businesses. The city is also home to several manufacturing companies, including a furniture manufacturer and a plastics manufacturer.
The city is also home to several agricultural businesses, including a dairy farm and a produce farm. The city is also home to several wineries and vineyards.
Demographics
As of the 2010 census, the city had a population of 1,433. The racial makeup of the city was 94.3% White, 1.7% African American, 0.3% Native American, 0.7% Asian, 0.1% Pacific Islander, 1.3% from other races, and 1.9% from two or more races. Hispanic or Latino of any race were 4.2% of the population.
The median household income in the city was $45,000, and the median family income was $50,000. The per capita income in the city was $20,000. About 11.3% of the population was below the poverty line.
Common Questions
What is Per Capita Income in Ball Ground?
Per Capita income in Ball Ground is $44,086.
What is the Median Family Income in Ball Ground?
Median Family Income in Ball Ground is $101,250.
What is the Median Household income in Ball Ground?
Median Household Income in Ball Ground is $103,429.
What is Income or Wage Gap in Ball Ground?
Income or Wage Gap in Ball Ground is 40.3%.
Women in Ball Ground earn 59.7 cents for every dollar earned by a man.
What is Inequality or Gini Index in Ball Ground?
Inequality or Gini Index in Ball Ground is 0.33.
What is the Total Population of Ball Ground?
Total Population of Ball Ground is 2,527.
What is the Total Male Population of Ball Ground?
Total Male Population of Ball Ground is 1,348.
What is the Total Female Population of Ball Ground?
Total Female Population of Ball Ground is 1,179.
What is the Ratio of Males per 100 Females in Ball Ground?
There are 114.33 Males per 100 Females in Ball Ground.
What is the Ratio of Females per 100 Males in Ball Ground?
There are 87.46 Females per 100 Males in Ball Ground.
What is the Median Population Age in Ball Ground?
Median Population Age in Ball Ground is 38.5 Years.
What is the Average Family Size in Ball Ground
Average Family Size in Ball Ground is 2.9 People.
What is the Average Household Size in Ball Ground
Average Household Size in Ball Ground is 2.5 People.
How Large is the Labor Force in Ball Ground?
There are 1,504 People in the Labor Forcein in Ball Ground.
What is the Percentage of People in the Labor Force in Ball Ground?
74.4% of People are in the Labor Force in Ball Ground.
What is the Unemployment Rate in Ball Ground?
Unemployment Rate in Ball Ground is 3.6%.