Statham, GA Map & Demographics
Statham Map
Statham Overview
$27,240
PER CAPITA INCOME
$63,361
AVG FAMILY INCOME
$62,441
AVG HOUSEHOLD INCOME
12.7%
WAGE / INCOME GAP [ % ]
87.3¢/ $1
WAGE / INCOME GAP [ $ ]
0.41
INEQUALITY / GINI INDEX
2,829
TOTAL POPULATION
1,300
MALE POPULATION
1,529
FEMALE POPULATION
85.02
MALES / 100 FEMALES
117.62
FEMALES / 100 MALES
34.1
MEDIAN AGE
3.2
AVG FAMILY SIZE
3.0
AVG HOUSEHOLD SIZE
1,708
LABOR FORCE [ PEOPLE ]
76.2%
PERCENT IN LABOR FORCE
4.2%
UNEMPLOYMENT RATE
Statham Zip Codes
Income in Statham
Income Overview in Statham
Per Capita Income in Statham is $27,240, while median incomes of families and households are $63,361 and $62,441 respectively.
| Characteristic | Number | Measure |
| Per Capita Income | 2,829 | $27,240 |
| Median Family Income | 773 | $63,361 |
| Mean Family Income | 773 | $88,818 |
| Median Household Income | 937 | $62,441 |
| Mean Household Income | 937 | $82,600 |
| Income Deficit | 773 | $0 |
| Wage / Income Gap (%) | 2,829 | 12.68% |
| Wage / Income Gap ($) | 2,829 | 87.32¢ per $1 |
| Gini / Inequality Index | 2,829 | 0.41 |
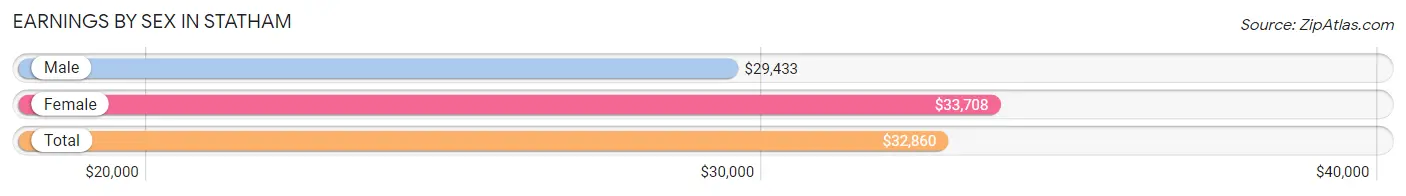
Earnings by Sex in Statham
Average Earnings in Statham are $32,860, $29,433 for men and $33,708 for women, a difference of 12.7%.
| Sex | Number | Average Earnings |
| Male | 844 (48.8%) | $29,433 |
| Female | 886 (51.2%) | $33,708 |
| Total | 1,730 (100.0%) | $32,860 |
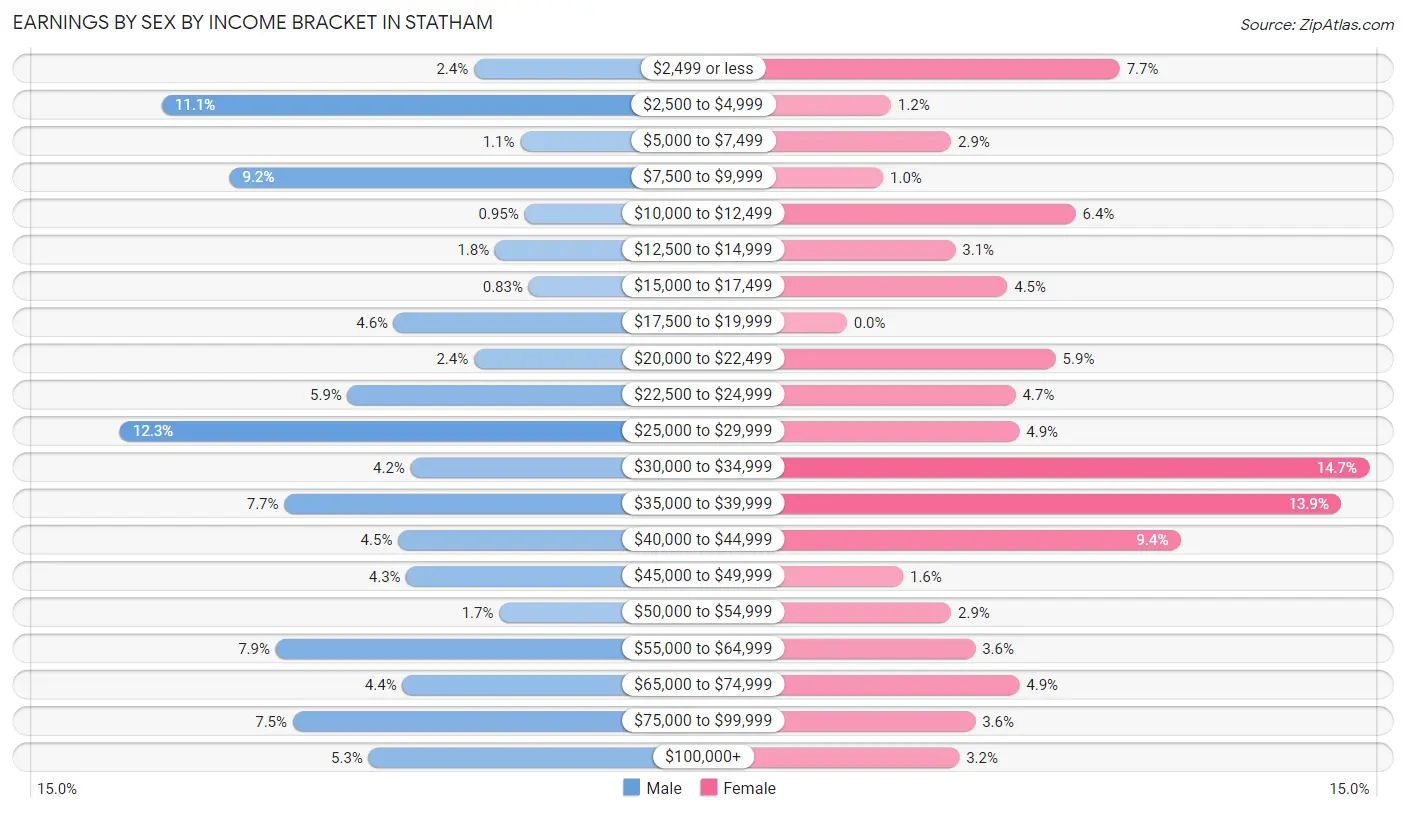
Earnings by Sex by Income Bracket in Statham
The most common earnings brackets in Statham are $25,000 to $29,999 for men (104 | 12.3%) and $30,000 to $34,999 for women (130 | 14.7%).
| Income | Male | Female |
| $2,499 or less | 20 (2.4%) | 68 (7.7%) |
| $2,500 to $4,999 | 94 (11.1%) | 11 (1.2%) |
| $5,000 to $7,499 | 9 (1.1%) | 26 (2.9%) |
| $7,500 to $9,999 | 78 (9.2%) | 9 (1.0%) |
| $10,000 to $12,499 | 8 (0.9%) | 57 (6.4%) |
| $12,500 to $14,999 | 15 (1.8%) | 27 (3.0%) |
| $15,000 to $17,499 | 7 (0.8%) | 40 (4.5%) |
| $17,500 to $19,999 | 39 (4.6%) | 0 (0.0%) |
| $20,000 to $22,499 | 20 (2.4%) | 52 (5.9%) |
| $22,500 to $24,999 | 50 (5.9%) | 42 (4.7%) |
| $25,000 to $29,999 | 104 (12.3%) | 43 (4.9%) |
| $30,000 to $34,999 | 35 (4.2%) | 130 (14.7%) |
| $35,000 to $39,999 | 65 (7.7%) | 123 (13.9%) |
| $40,000 to $44,999 | 38 (4.5%) | 83 (9.4%) |
| $45,000 to $49,999 | 36 (4.3%) | 14 (1.6%) |
| $50,000 to $54,999 | 14 (1.7%) | 26 (2.9%) |
| $55,000 to $64,999 | 67 (7.9%) | 32 (3.6%) |
| $65,000 to $74,999 | 37 (4.4%) | 43 (4.9%) |
| $75,000 to $99,999 | 63 (7.5%) | 32 (3.6%) |
| $100,000+ | 45 (5.3%) | 28 (3.2%) |
| Total | 844 (100.0%) | 886 (100.0%) |
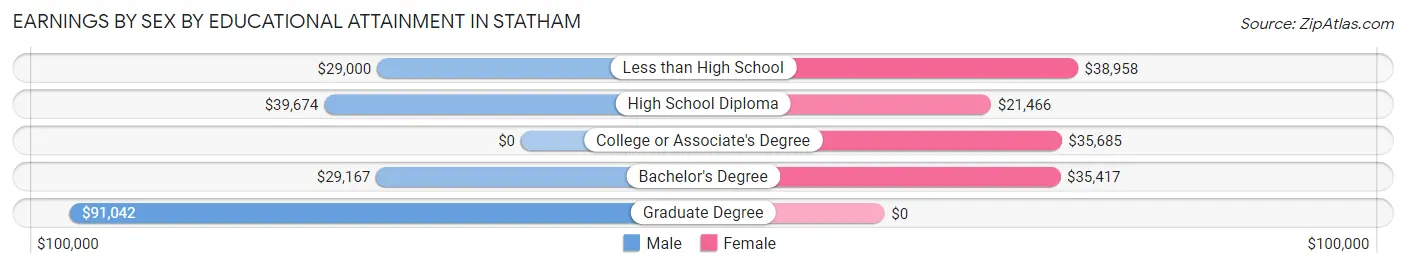
Earnings by Sex by Educational Attainment in Statham
Average earnings in Statham are $31,328 for men and $34,040 for women, a difference of 8.0%. Men with an educational attainment of graduate degree enjoy the highest average annual earnings of $91,042, while those with less than high school education earn the least with $29,000. Women with an educational attainment of less than high school earn the most with the average annual earnings of $38,958, while those with high school diploma education have the smallest earnings of $21,466.
| Educational Attainment | Male Income | Female Income |
| Less than High School | $29,000 | $38,958 |
| High School Diploma | $39,674 | $21,466 |
| College or Associate's Degree | - | - |
| Bachelor's Degree | $29,167 | $35,417 |
| Graduate Degree | $91,042 | $0 |
| Total | $31,328 | $34,040 |
Family Income in Statham
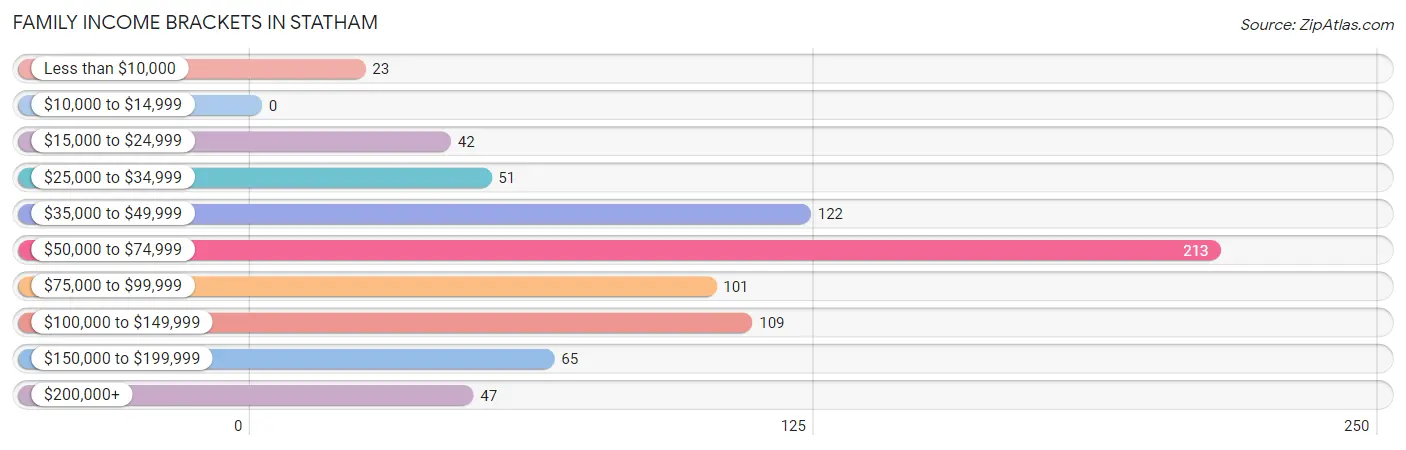
Family Income Brackets in Statham
According to the Statham family income data, there are 213 families falling into the $50,000 to $74,999 income range, which is the most common income bracket and makes up 27.6% of all families.
| Income Bracket | # Families | % Families |
| Less than $10,000 | 23 | 3.0% |
| $10,000 to $14,999 | 0 | 0.0% |
| $15,000 to $24,999 | 42 | 5.4% |
| $25,000 to $34,999 | 51 | 6.6% |
| $35,000 to $49,999 | 122 | 15.8% |
| $50,000 to $74,999 | 213 | 27.6% |
| $75,000 to $99,999 | 101 | 13.1% |
| $100,000 to $149,999 | 109 | 14.1% |
| $150,000 to $199,999 | 65 | 8.4% |
| $200,000+ | 47 | 6.1% |
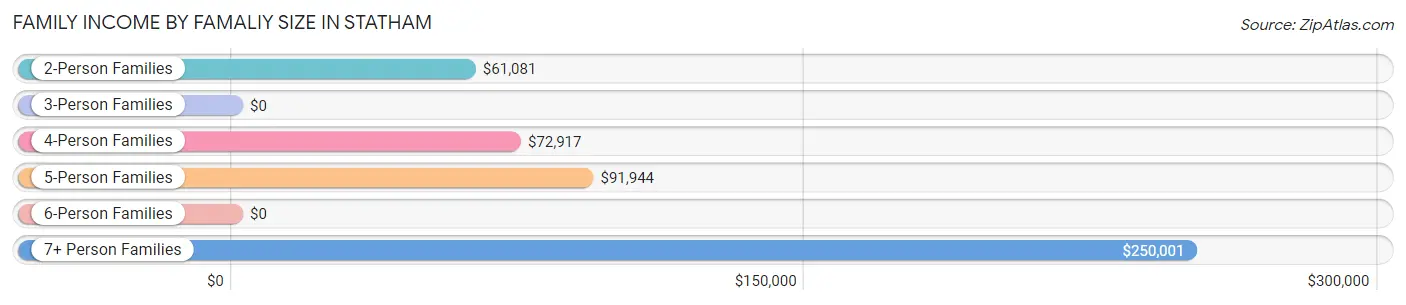
Family Income by Famaliy Size in Statham
7+ person families (56 | 7.2%) account for the highest median family income in Statham with $250,001 per family, while 7+ person families (56 | 7.2%) have the highest median income of $35,714 per family member.
| Income Bracket | # Families | Median Income |
| 2-Person Families | 391 (50.6%) | $61,081 |
| 3-Person Families | 168 (21.7%) | $0 |
| 4-Person Families | 105 (13.6%) | $72,917 |
| 5-Person Families | 50 (6.5%) | $91,944 |
| 6-Person Families | 3 (0.4%) | $0 |
| 7+ Person Families | 56 (7.2%) | $250,001 |
| Total | 773 (100.0%) | $63,361 |
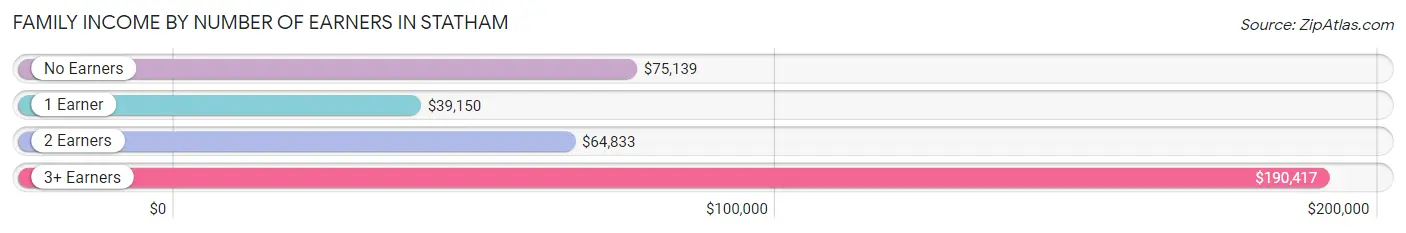
Family Income by Number of Earners in Statham
The median family income in Statham is $63,361, with families comprising 3+ earners (119) having the highest median family income of $190,417, while families with 1 earner (289) have the lowest median family income of $39,150, accounting for 15.4% and 37.4% of families, respectively.
| Number of Earners | # Families | Median Income |
| No Earners | 51 (6.6%) | $75,139 |
| 1 Earner | 289 (37.4%) | $39,150 |
| 2 Earners | 314 (40.6%) | $64,833 |
| 3+ Earners | 119 (15.4%) | $190,417 |
| Total | 773 (100.0%) | $63,361 |
Household Income in Statham
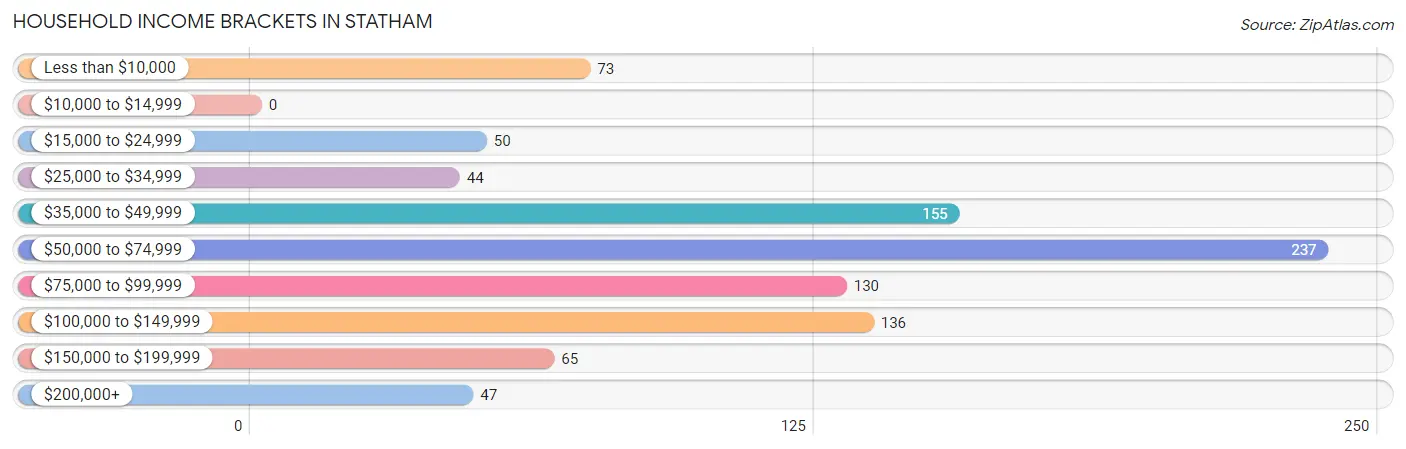
Household Income Brackets in Statham
With 237 households falling in the category, the $50,000 to $74,999 income range is the most frequent in Statham, accounting for 25.3% of all households.
| Income Bracket | # Households | % Households |
| Less than $10,000 | 73 | 7.8% |
| $10,000 to $14,999 | 0 | 0.0% |
| $15,000 to $24,999 | 50 | 5.3% |
| $25,000 to $34,999 | 44 | 4.7% |
| $35,000 to $49,999 | 155 | 16.5% |
| $50,000 to $74,999 | 237 | 25.3% |
| $75,000 to $99,999 | 130 | 13.9% |
| $100,000 to $149,999 | 136 | 14.5% |
| $150,000 to $199,999 | 65 | 6.9% |
| $200,000+ | 47 | 5.0% |
Household Income by Householder Age in Statham
The median household income in Statham is $62,441, with the highest median household income of $75,972 found in the 45 to 64 years age bracket for the primary householder. A total of 303 households (32.3%) fall into this category. Meanwhile, the 15 to 24 years age bracket for the primary householder has the lowest median household income of $0, with 43 households (4.6%) in this group.
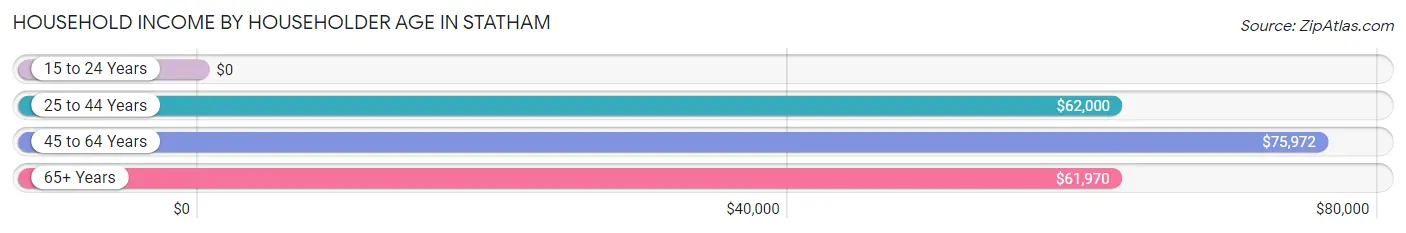
| Income Bracket | # Households | Median Income |
| 15 to 24 Years | 43 (4.6%) | $0 |
| 25 to 44 Years | 330 (35.2%) | $62,000 |
| 45 to 64 Years | 303 (32.3%) | $75,972 |
| 65+ Years | 261 (27.9%) | $61,970 |
| Total | 937 (100.0%) | $62,441 |
Poverty in Statham
Income Below Poverty by Sex and Age in Statham
With 13.2% poverty level for males and 15.8% for females among the residents of Statham, 15 year old males and 12 to 14 year old females are the most vulnerable to poverty, with 5 males (71.4%) and 52 females (59.8%) in their respective age groups living below the poverty level.
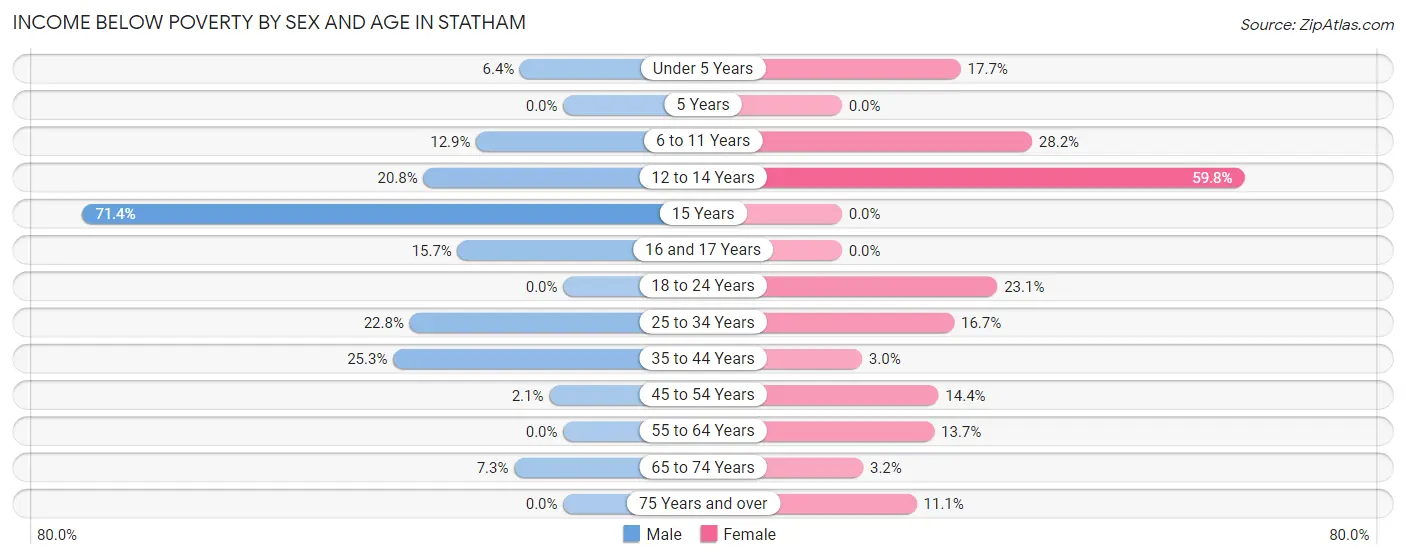
| Age Bracket | Male | Female |
| Under 5 Years | 5 (6.4%) | 12 (17.6%) |
| 5 Years | 0 (0.0%) | 0 (0.0%) |
| 6 to 11 Years | 15 (12.9%) | 35 (28.2%) |
| 12 to 14 Years | 11 (20.7%) | 52 (59.8%) |
| 15 Years | 5 (71.4%) | 0 (0.0%) |
| 16 and 17 Years | 8 (15.7%) | 0 (0.0%) |
| 18 to 24 Years | 0 (0.0%) | 30 (23.1%) |
| 25 to 34 Years | 65 (22.8%) | 46 (16.7%) |
| 35 to 44 Years | 48 (25.3%) | 6 (3.0%) |
| 45 to 54 Years | 4 (2.1%) | 30 (14.3%) |
| 55 to 64 Years | 0 (0.0%) | 17 (13.7%) |
| 65 to 74 Years | 11 (7.3%) | 4 (3.2%) |
| 75 Years and over | 0 (0.0%) | 10 (11.1%) |
| Total | 172 (13.2%) | 242 (15.8%) |
Income Above Poverty by Sex and Age in Statham
According to the poverty statistics in Statham, males aged 18 to 24 years and females aged 15 years are the age groups that are most secure financially, with 100.0% of males and 100.0% of females in these age groups living above the poverty line.
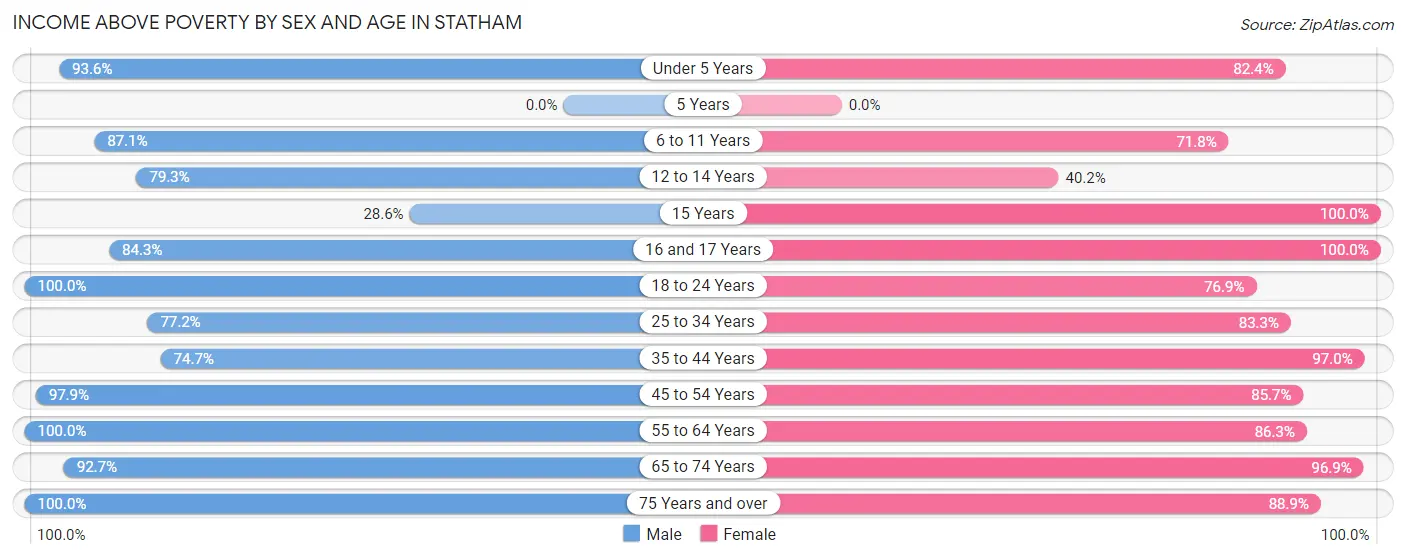
| Age Bracket | Male | Female |
| Under 5 Years | 73 (93.6%) | 56 (82.4%) |
| 5 Years | 0 (0.0%) | 0 (0.0%) |
| 6 to 11 Years | 101 (87.1%) | 89 (71.8%) |
| 12 to 14 Years | 42 (79.2%) | 35 (40.2%) |
| 15 Years | 2 (28.6%) | 54 (100.0%) |
| 16 and 17 Years | 43 (84.3%) | 39 (100.0%) |
| 18 to 24 Years | 78 (100.0%) | 100 (76.9%) |
| 25 to 34 Years | 220 (77.2%) | 230 (83.3%) |
| 35 to 44 Years | 142 (74.7%) | 195 (97.0%) |
| 45 to 54 Years | 188 (97.9%) | 179 (85.7%) |
| 55 to 64 Years | 50 (100.0%) | 107 (86.3%) |
| 65 to 74 Years | 140 (92.7%) | 123 (96.9%) |
| 75 Years and over | 49 (100.0%) | 80 (88.9%) |
| Total | 1,128 (86.8%) | 1,287 (84.2%) |
Income Below Poverty Among Married-Couple Families in Statham
The poverty statistics for married-couple families in Statham show that 5.8% or 25 of the total 431 families live below the poverty line. Families with 5 or more children have the highest poverty rate of 100.0%, comprising of 6 families. On the other hand, families with 1 or 2 children have the lowest poverty rate of 0.0%, which includes 0 families.
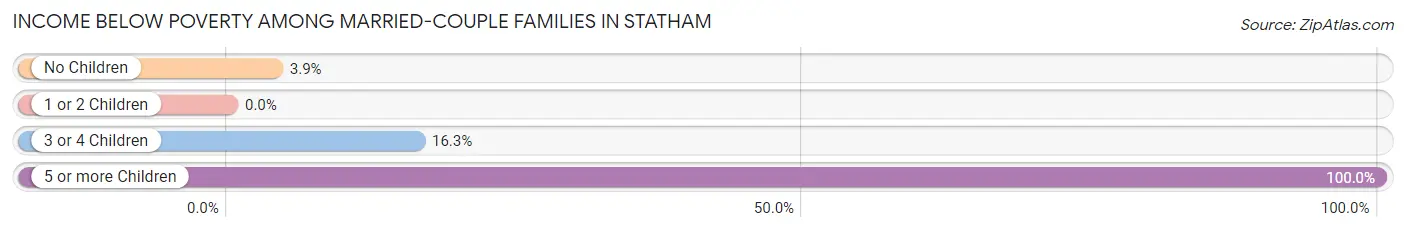
| Children | Above Poverty | Below Poverty |
| No Children | 296 (96.1%) | 12 (3.9%) |
| 1 or 2 Children | 74 (100.0%) | 0 (0.0%) |
| 3 or 4 Children | 36 (83.7%) | 7 (16.3%) |
| 5 or more Children | 0 (0.0%) | 6 (100.0%) |
| Total | 406 (94.2%) | 25 (5.8%) |
Income Below Poverty Among Single-Parent Households in Statham
According to the poverty data in Statham, 7.9% or 5 single-father households and 11.8% or 33 single-mother households are living below the poverty line. Among single-father households, those with no children have the highest poverty rate, with 5 households (15.6%) experiencing poverty. Likewise, among single-mother households, those with 1 or 2 children have the highest poverty rate, with 28 households (17.3%) falling below the poverty line.
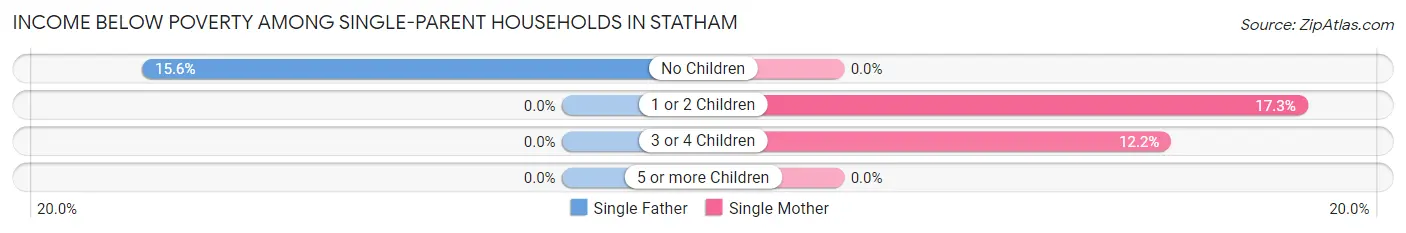
| Children | Single Father | Single Mother |
| No Children | 5 (15.6%) | 0 (0.0%) |
| 1 or 2 Children | 0 (0.0%) | 28 (17.3%) |
| 3 or 4 Children | 0 (0.0%) | 5 (12.2%) |
| 5 or more Children | 0 (0.0%) | 0 (0.0%) |
| Total | 5 (7.9%) | 33 (11.8%) |
Income Below Poverty Among Married-Couple vs Single-Parent Households in Statham
The poverty data for Statham shows that 25 of the married-couple family households (5.8%) and 38 of the single-parent households (11.1%) are living below the poverty level. Within the married-couple family households, those with 5 or more children have the highest poverty rate, with 6 households (100.0%) falling below the poverty line. Among the single-parent households, those with 1 or 2 children have the highest poverty rate, with 28 household (15.2%) living below poverty.
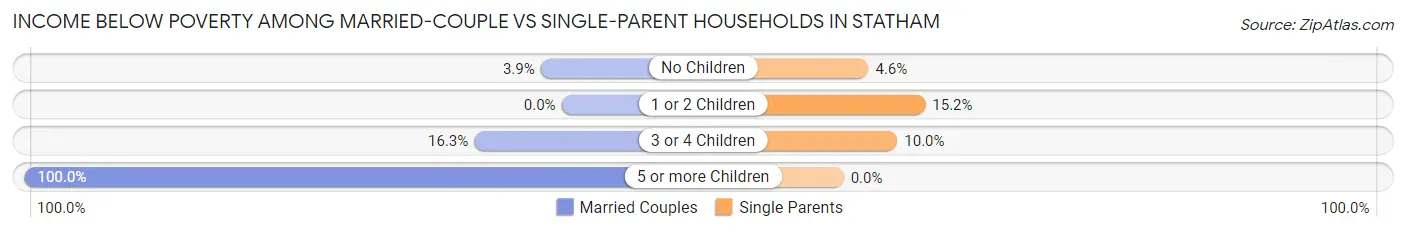
| Children | Married-Couple Families | Single-Parent Households |
| No Children | 12 (3.9%) | 5 (4.6%) |
| 1 or 2 Children | 0 (0.0%) | 28 (15.2%) |
| 3 or 4 Children | 7 (16.3%) | 5 (10.0%) |
| 5 or more Children | 6 (100.0%) | 0 (0.0%) |
| Total | 25 (5.8%) | 38 (11.1%) |
Race in Statham
The most populous races in Statham are White / Caucasian (2,071 | 73.2%), Black / African American (445 | 15.7%), and Hispanic or Latino (329 | 11.6%).
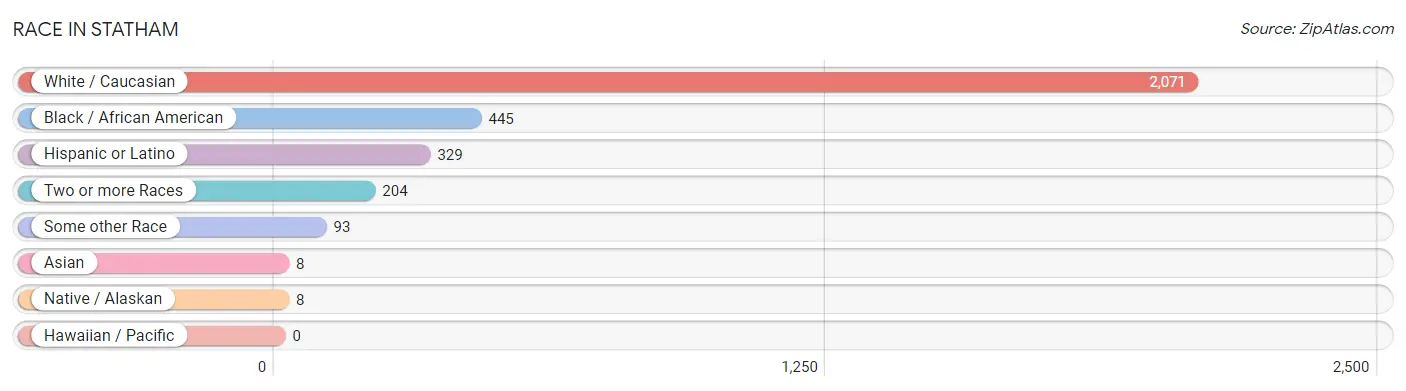
| Race | # Population | % Population |
| Asian | 8 | 0.3% |
| Black / African American | 445 | 15.7% |
| Hawaiian / Pacific | 0 | 0.0% |
| Hispanic or Latino | 329 | 11.6% |
| Native / Alaskan | 8 | 0.3% |
| White / Caucasian | 2,071 | 73.2% |
| Two or more Races | 204 | 7.2% |
| Some other Race | 93 | 3.3% |
| Total | 2,829 | 100.0% |
Ancestry in Statham
The most populous ancestries reported in Statham are English (503 | 17.8%), German (382 | 13.5%), American (193 | 6.8%), Irish (188 | 6.7%), and Mexican (188 | 6.7%), together accounting for 51.4% of all Statham residents.
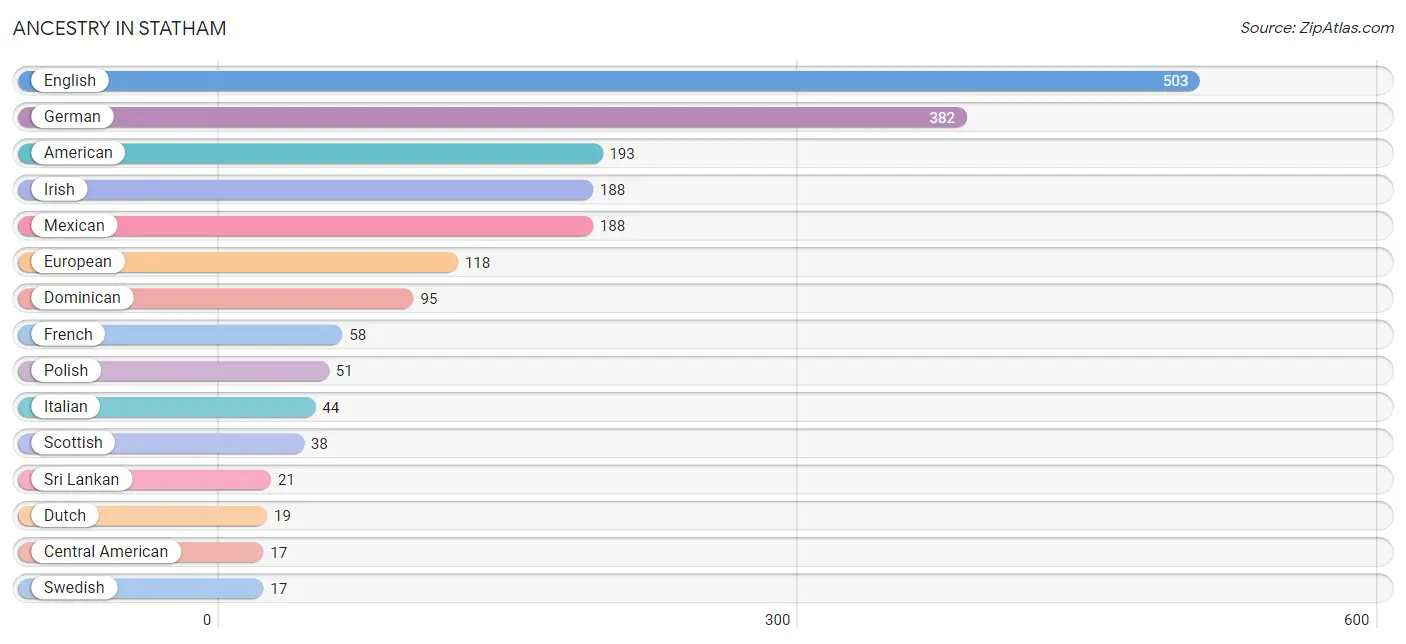
| Ancestry | # Population | % Population |
| American | 193 | 6.8% |
| Bhutanese | 3 | 0.1% |
| Central American | 17 | 0.6% |
| Colombian | 2 | 0.1% |
| Dominican | 95 | 3.4% |
| Dutch | 19 | 0.7% |
| English | 503 | 17.8% |
| European | 118 | 4.2% |
| French | 58 | 2.1% |
| German | 382 | 13.5% |
| Hungarian | 5 | 0.2% |
| Irish | 188 | 6.7% |
| Italian | 44 | 1.6% |
| Korean | 4 | 0.1% |
| Latvian | 5 | 0.2% |
| Mexican | 188 | 6.7% |
| Nicaraguan | 14 | 0.5% |
| Norwegian | 5 | 0.2% |
| Polish | 51 | 1.8% |
| Puerto Rican | 13 | 0.5% |
| Romanian | 11 | 0.4% |
| Salvadoran | 3 | 0.1% |
| Scotch-Irish | 3 | 0.1% |
| Scottish | 38 | 1.3% |
| Slovak | 4 | 0.1% |
| South American | 2 | 0.1% |
| Sri Lankan | 21 | 0.7% |
| Swedish | 17 | 0.6% | View All 28 Rows |
Immigrants in Statham
The most numerous immigrant groups reported in Statham came from Central America (91 | 3.2%), Latin America (91 | 3.2%), Mexico (65 | 2.3%), Asia (32 | 1.1%), and South Eastern Asia (21 | 0.7%), together accounting for 10.6% of all Statham residents.
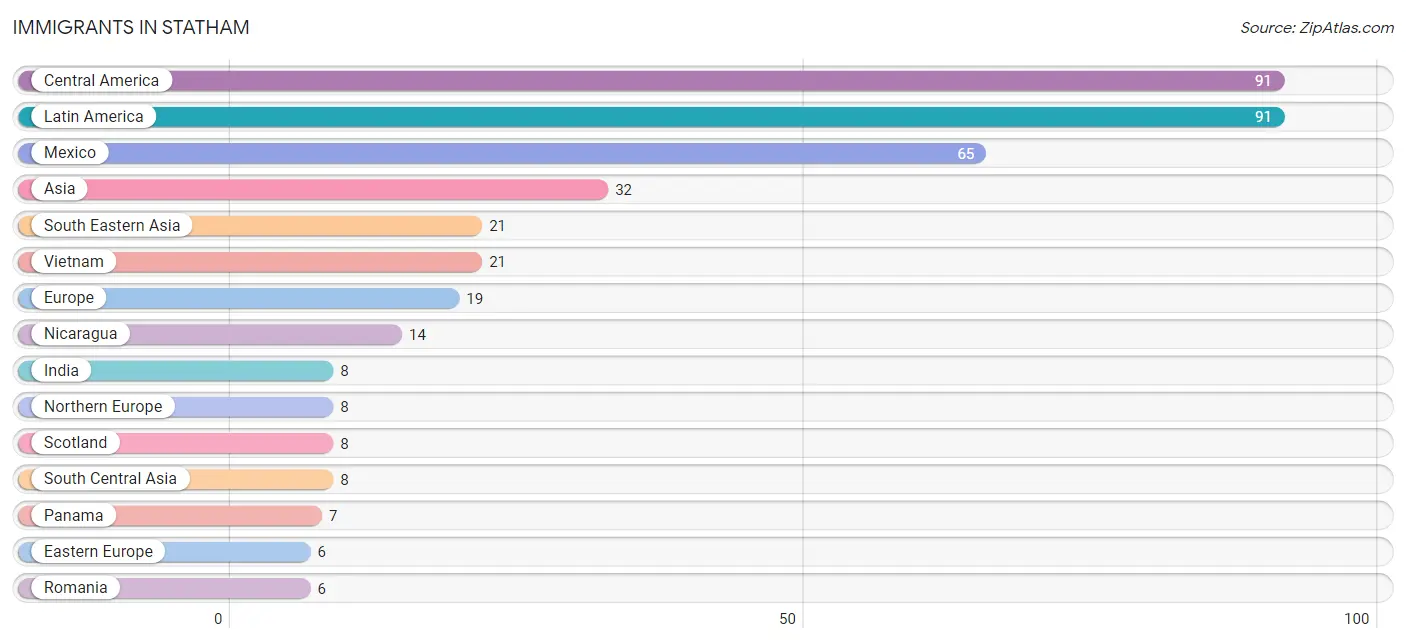
| Immigration Origin | # Population | % Population |
| Asia | 32 | 1.1% |
| Central America | 91 | 3.2% |
| Eastern Asia | 3 | 0.1% |
| Eastern Europe | 6 | 0.2% |
| El Salvador | 5 | 0.2% |
| Europe | 19 | 0.7% |
| Germany | 5 | 0.2% |
| India | 8 | 0.3% |
| Japan | 3 | 0.1% |
| Latin America | 91 | 3.2% |
| Mexico | 65 | 2.3% |
| Nicaragua | 14 | 0.5% |
| Northern Europe | 8 | 0.3% |
| Panama | 7 | 0.3% |
| Romania | 6 | 0.2% |
| Scotland | 8 | 0.3% |
| South Central Asia | 8 | 0.3% |
| South Eastern Asia | 21 | 0.7% |
| Vietnam | 21 | 0.7% |
| Western Europe | 5 | 0.2% | View All 20 Rows |
Sex and Age in Statham
Sex and Age in Statham
The most populous age groups in Statham are 25 to 29 Years (190 | 14.6%) for men and 25 to 29 Years (181 | 11.8%) for women.
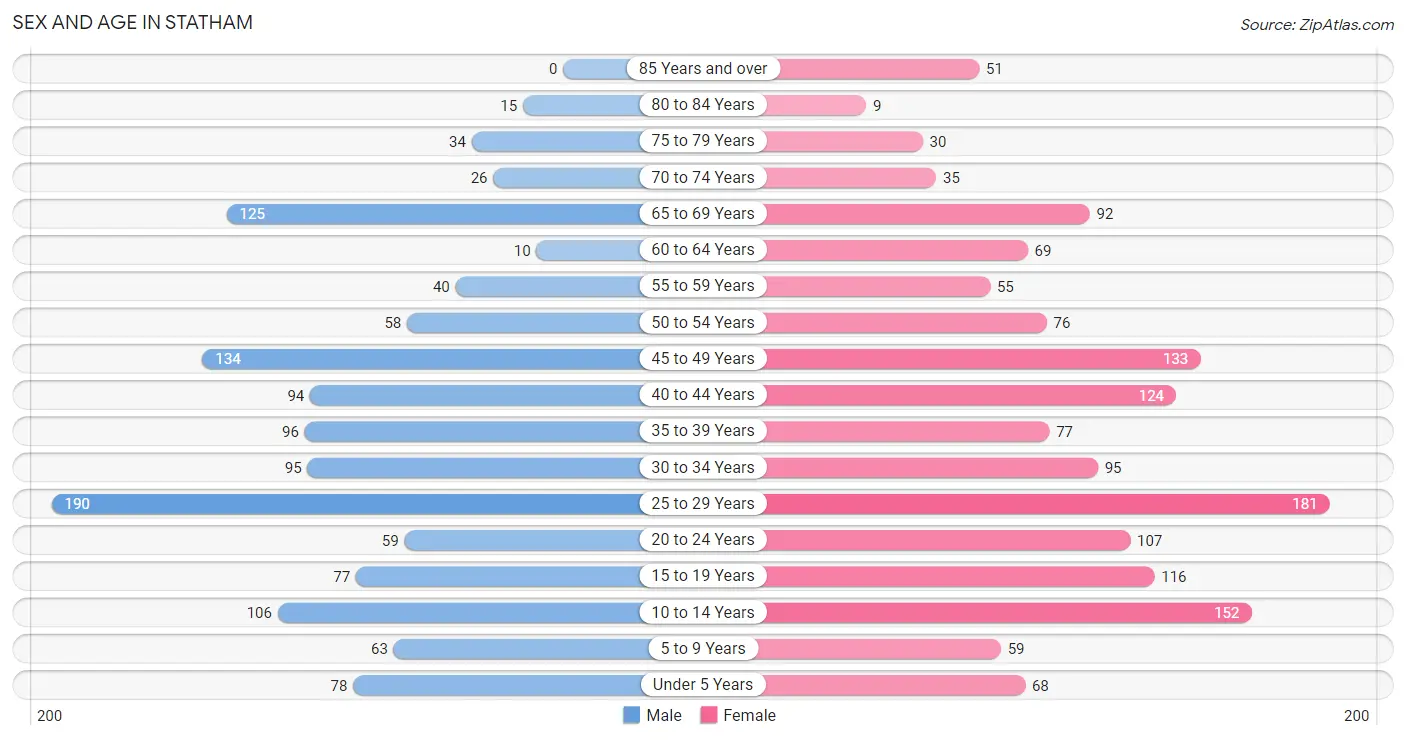
| Age Bracket | Male | Female |
| Under 5 Years | 78 (6.0%) | 68 (4.4%) |
| 5 to 9 Years | 63 (4.9%) | 59 (3.9%) |
| 10 to 14 Years | 106 (8.2%) | 152 (9.9%) |
| 15 to 19 Years | 77 (5.9%) | 116 (7.6%) |
| 20 to 24 Years | 59 (4.5%) | 107 (7.0%) |
| 25 to 29 Years | 190 (14.6%) | 181 (11.8%) |
| 30 to 34 Years | 95 (7.3%) | 95 (6.2%) |
| 35 to 39 Years | 96 (7.4%) | 77 (5.0%) |
| 40 to 44 Years | 94 (7.2%) | 124 (8.1%) |
| 45 to 49 Years | 134 (10.3%) | 133 (8.7%) |
| 50 to 54 Years | 58 (4.5%) | 76 (5.0%) |
| 55 to 59 Years | 40 (3.1%) | 55 (3.6%) |
| 60 to 64 Years | 10 (0.8%) | 69 (4.5%) |
| 65 to 69 Years | 125 (9.6%) | 92 (6.0%) |
| 70 to 74 Years | 26 (2.0%) | 35 (2.3%) |
| 75 to 79 Years | 34 (2.6%) | 30 (2.0%) |
| 80 to 84 Years | 15 (1.1%) | 9 (0.6%) |
| 85 Years and over | 0 (0.0%) | 51 (3.3%) |
| Total | 1,300 (100.0%) | 1,529 (100.0%) |
Families and Households in Statham
Median Family Size in Statham
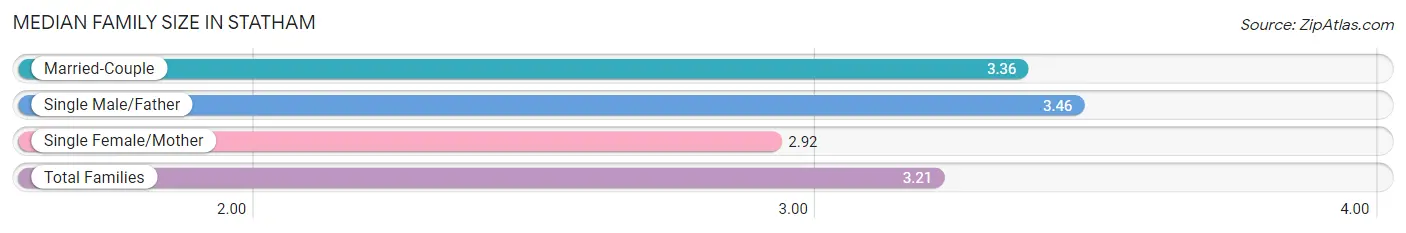
The median family size in Statham is 3.21 persons per family, with single male/father families (63 | 8.2%) accounting for the largest median family size of 3.46 persons per family. On the other hand, single female/mother families (279 | 36.1%) represent the smallest median family size with 2.92 persons per family.
| Family Type | # Families | Family Size |
| Married-Couple | 431 (55.8%) | 3.36 |
| Single Male/Father | 63 (8.2%) | 3.46 |
| Single Female/Mother | 279 (36.1%) | 2.92 |
| Total Families | 773 (100.0%) | 3.21 |
Median Household Size in Statham
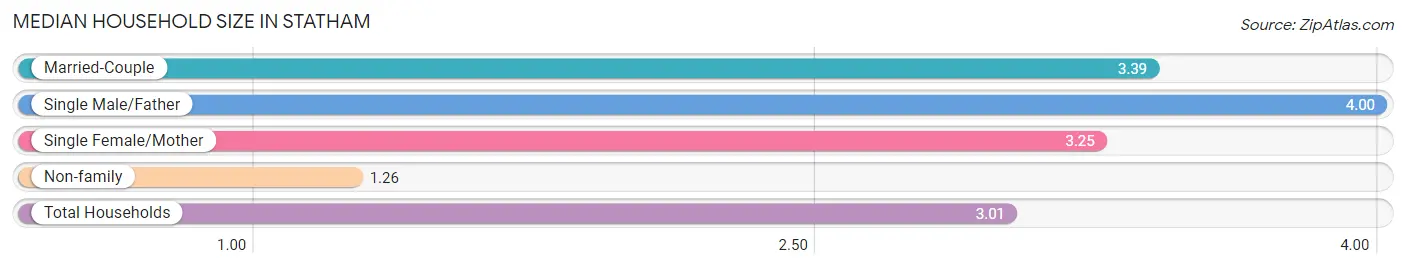
The median household size in Statham is 3.01 persons per household, with single male/father households (63 | 6.7%) accounting for the largest median household size of 4 persons per household. non-family households (164 | 17.5%) represent the smallest median household size with 1.26 persons per household.
| Household Type | # Households | Household Size |
| Married-Couple | 431 (46.0%) | 3.39 |
| Single Male/Father | 63 (6.7%) | 4.00 |
| Single Female/Mother | 279 (29.8%) | 3.25 |
| Non-family | 164 (17.5%) | 1.26 |
| Total Households | 937 (100.0%) | 3.01 |
Household Size by Marriage Status in Statham
Out of a total of 937 households in Statham, 773 (82.5%) are family households, while 164 (17.5%) are nonfamily households. The most numerous type of family households are 2-person households, comprising 343, and the most common type of nonfamily households are 1-person households, comprising 122.
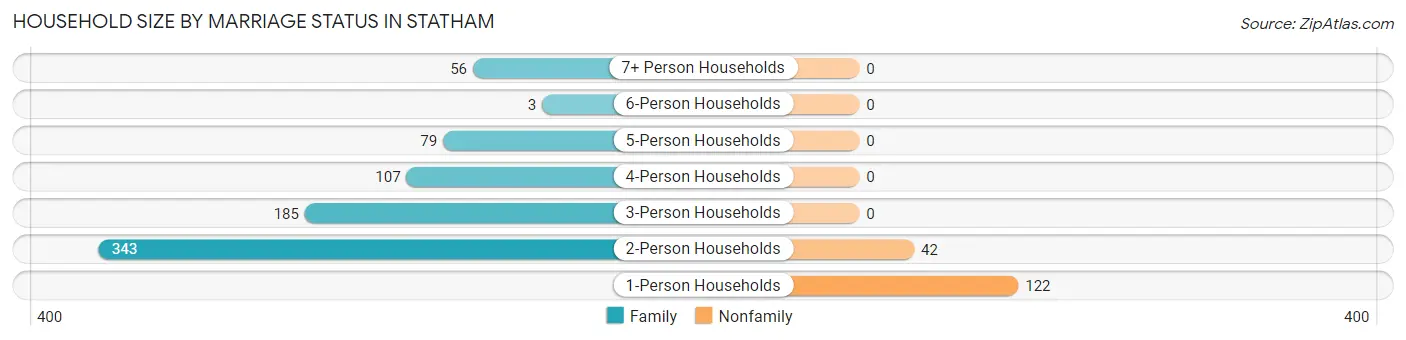
| Household Size | Family Households | Nonfamily Households |
| 1-Person Households | - | 122 (13.0%) |
| 2-Person Households | 343 (36.6%) | 42 (4.5%) |
| 3-Person Households | 185 (19.7%) | 0 (0.0%) |
| 4-Person Households | 107 (11.4%) | 0 (0.0%) |
| 5-Person Households | 79 (8.4%) | 0 (0.0%) |
| 6-Person Households | 3 (0.3%) | 0 (0.0%) |
| 7+ Person Households | 56 (6.0%) | 0 (0.0%) |
| Total | 773 (82.5%) | 164 (17.5%) |
Female Fertility in Statham
Fertility by Age in Statham
Average fertility rate in Statham is 52.0 births per 1,000 women. Women in the age bracket of 20 to 34 years have the highest fertility rate with 115.0 births per 1,000 women. Women in the age bracket of 20 to 34 years acount for 100.0% of all women with births.
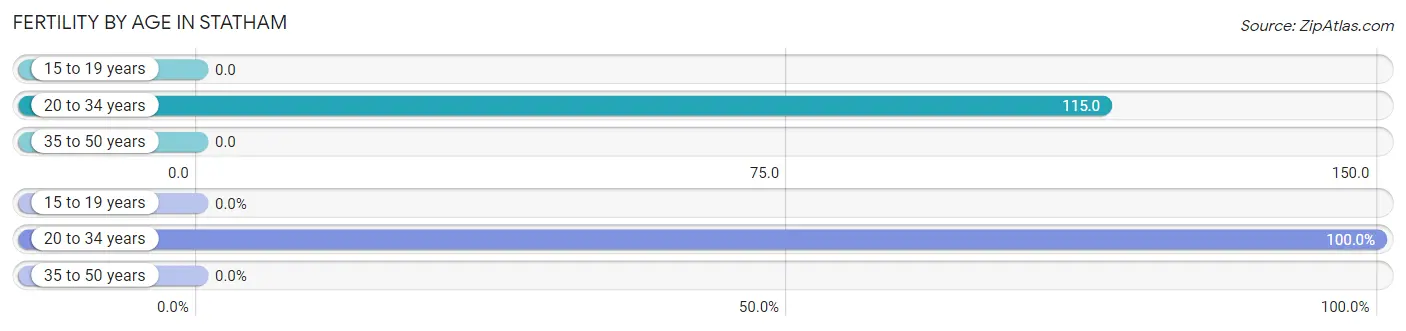
| Age Bracket | Women with Births | Births / 1,000 Women |
| 15 to 19 years | 0 (0.0%) | 0.0 |
| 20 to 34 years | 44 (100.0%) | 115.0 |
| 35 to 50 years | 0 (0.0%) | 0.0 |
| Total | 44 (100.0%) | 52.0 |
Fertility by Age by Marriage Status in Statham
15.9% of women with births (44) in Statham are married. The highest percentage of unmarried women with births falls into 20 to 34 years age bracket with 84.1% of them unmarried at the time of birth, while the lowest percentage of unmarried women with births belong to 20 to 34 years age bracket with 84.1% of them unmarried.
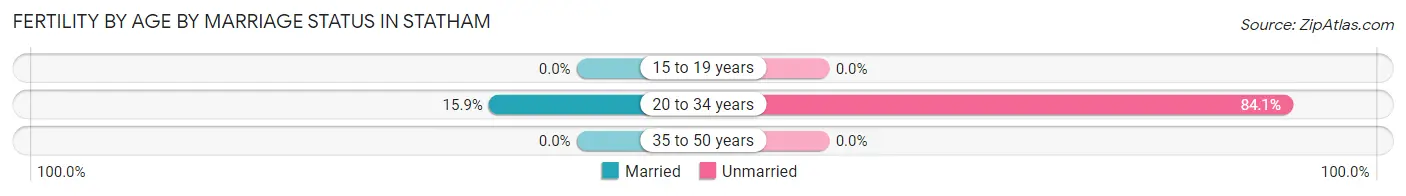
| Age Bracket | Married | Unmarried |
| 15 to 19 years | 0 (0.0%) | 0 (0.0%) |
| 20 to 34 years | 7 (15.9%) | 37 (84.1%) |
| 35 to 50 years | 0 (0.0%) | 0 (0.0%) |
| Total | 7 (15.9%) | 37 (84.1%) |
Fertility by Education in Statham
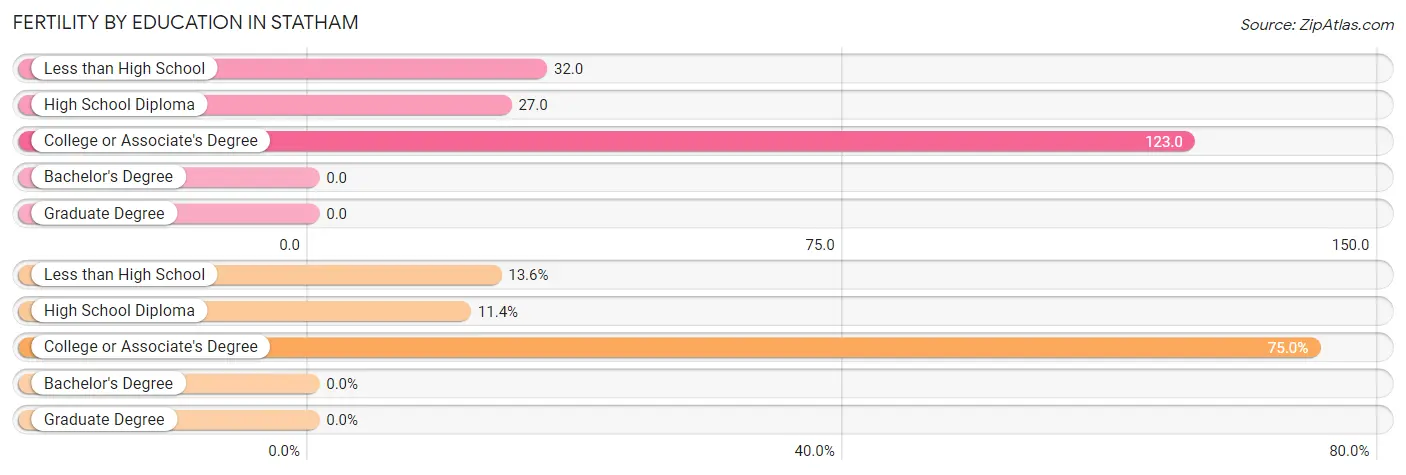
| Educational Attainment | Women with Births | Births / 1,000 Women |
| Less than High School | 6 (13.6%) | 32.0 |
| High School Diploma | 5 (11.4%) | 27.0 |
| College or Associate's Degree | 33 (75.0%) | 123.0 |
| Bachelor's Degree | 0 (0.0%) | 0.0 |
| Graduate Degree | 0 (0.0%) | 0.0 |
| Total | 44 (100.0%) | 52.0 |
Fertility by Education by Marriage Status in Statham
84.1% of women with births in Statham are unmarried. Women with the educational attainment of college or associate's degree are most likely to be married with 21.2% of them married at childbirth, while women with the educational attainment of less than high school are least likely to be married with 100.0% of them unmarried at childbirth.
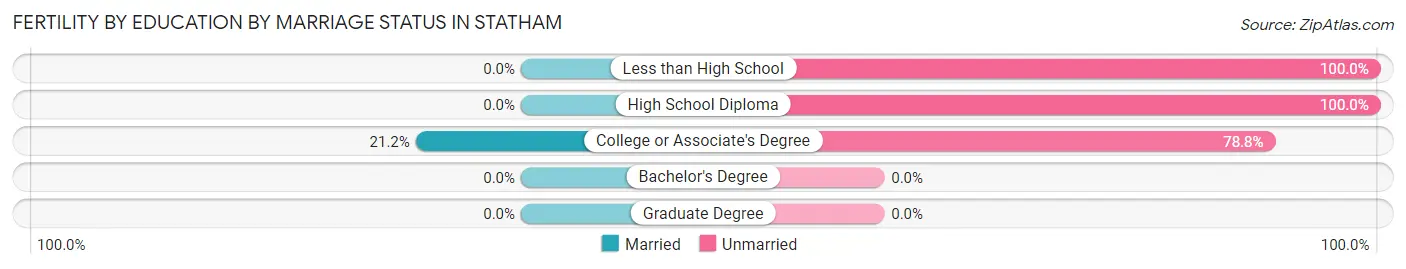
| Educational Attainment | Married | Unmarried |
| Less than High School | 0 (0.0%) | 6 (100.0%) |
| High School Diploma | 0 (0.0%) | 5 (100.0%) |
| College or Associate's Degree | 7 (21.2%) | 26 (78.8%) |
| Bachelor's Degree | 0 (0.0%) | 0 (0.0%) |
| Graduate Degree | 0 (0.0%) | 0 (0.0%) |
| Total | 7 (15.9%) | 37 (84.1%) |
Employment Characteristics in Statham
Employment by Class of Employer in Statham
Among the 1,612 employed individuals in Statham, private company employees (1,115 | 69.2%), state government employees (179 | 11.1%), and not-for-profit organizations (103 | 6.4%) make up the most common classes of employment.
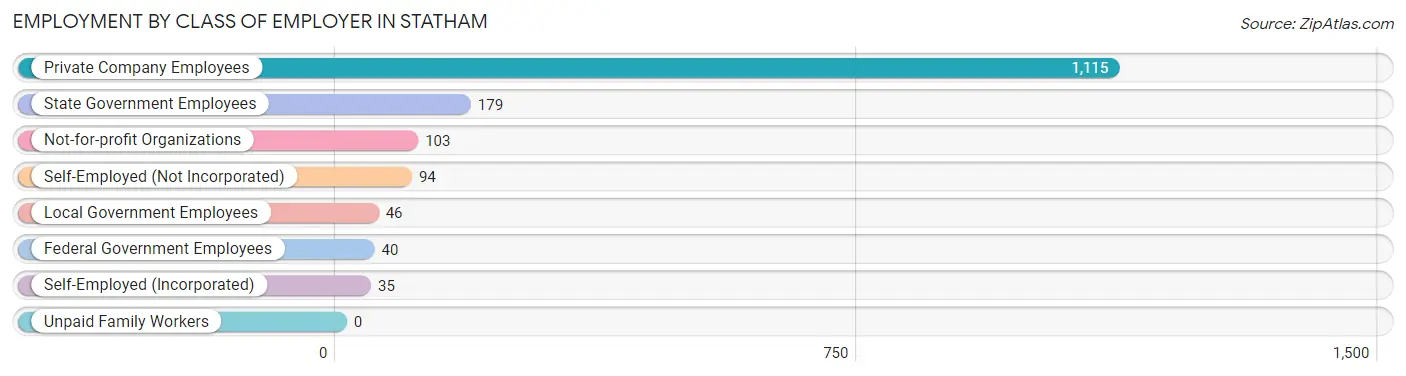
| Employer Class | # Employees | % Employees |
| Private Company Employees | 1,115 | 69.2% |
| Self-Employed (Incorporated) | 35 | 2.2% |
| Self-Employed (Not Incorporated) | 94 | 5.8% |
| Not-for-profit Organizations | 103 | 6.4% |
| Local Government Employees | 46 | 2.9% |
| State Government Employees | 179 | 11.1% |
| Federal Government Employees | 40 | 2.5% |
| Unpaid Family Workers | 0 | 0.0% |
| Total | 1,612 | 100.0% |
Employment Status by Age in Statham
According to the labor force statistics for Statham, out of the total population over 16 years of age (2,242), 76.2% or 1,708 individuals are in the labor force, with 4.2% or 72 of them unemployed. The age group with the highest labor force participation rate is 30 to 34 years, with 93.2% or 177 individuals in the labor force. Within the labor force, the 16 to 19 years age range has the highest percentage of unemployed individuals, with 37.5% or 18 of them being unemployed.
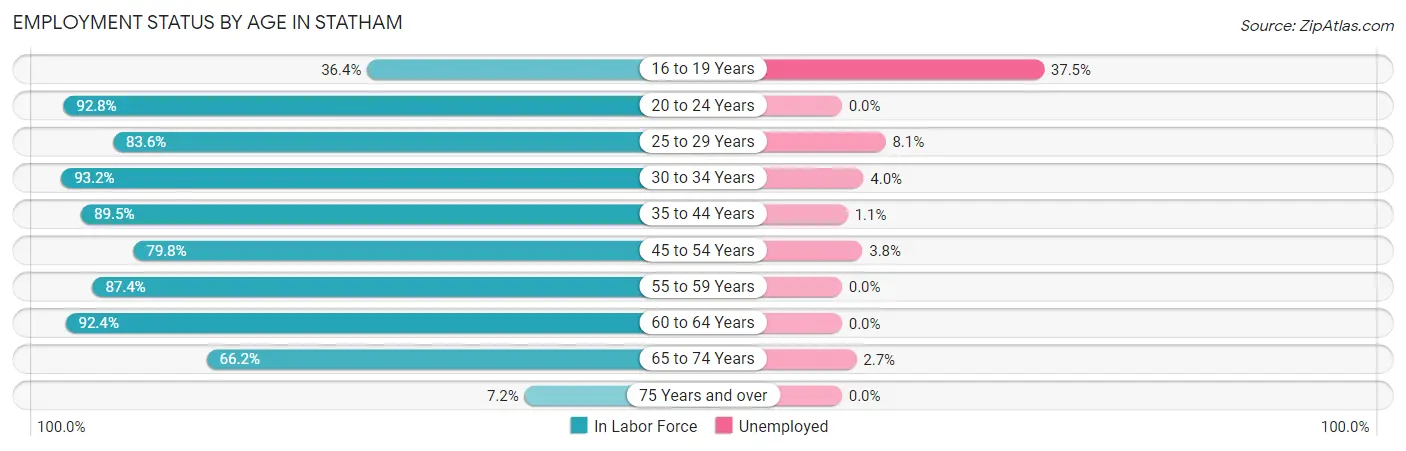
| Age Bracket | In Labor Force | Unemployed |
| 16 to 19 Years | 48 (36.4%) | 18 (37.5%) |
| 20 to 24 Years | 154 (92.8%) | 0 (0.0%) |
| 25 to 29 Years | 310 (83.6%) | 25 (8.1%) |
| 30 to 34 Years | 177 (93.2%) | 7 (4.0%) |
| 35 to 44 Years | 350 (89.5%) | 4 (1.1%) |
| 45 to 54 Years | 320 (79.8%) | 12 (3.8%) |
| 55 to 59 Years | 83 (87.4%) | 0 (0.0%) |
| 60 to 64 Years | 73 (92.4%) | 0 (0.0%) |
| 65 to 74 Years | 184 (66.2%) | 5 (2.7%) |
| 75 Years and over | 10 (7.2%) | 0 (0.0%) |
| Total | 1,708 (76.2%) | 72 (4.2%) |
Employment Status by Educational Attainment in Statham
According to labor force statistics for Statham, 86.0% of individuals (1,313) out of the total population between 25 and 64 years of age (1,527) are in the labor force, with 3.7% or 49 of them being unemployed. The group with the highest labor force participation rate are those with the educational attainment of bachelor's degree or higher, with 99.3% or 404 individuals in the labor force. Within the labor force, individuals with high school diploma education have the highest percentage of unemployment, with 9.4% or 37 of them being unemployed.
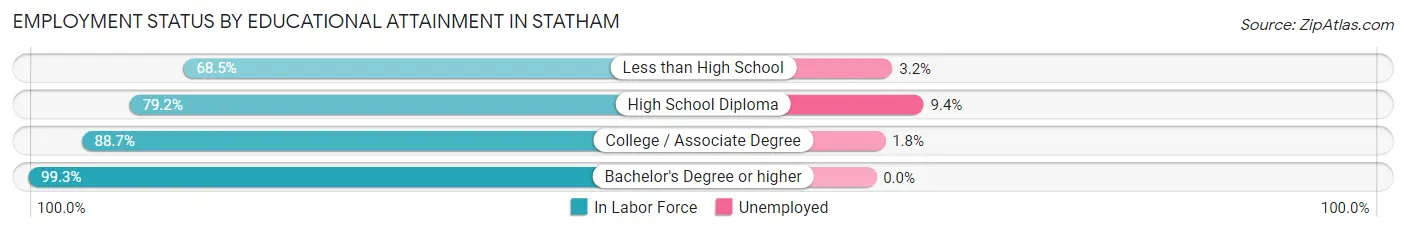
| Educational Attainment | In Labor Force | Unemployed |
| Less than High School | 126 (68.5%) | 6 (3.2%) |
| High School Diploma | 392 (79.2%) | 47 (9.4%) |
| College / Associate Degree | 391 (88.7%) | 8 (1.8%) |
| Bachelor's Degree or higher | 404 (99.3%) | 0 (0.0%) |
| Total | 1,313 (86.0%) | 56 (3.7%) |
Employment Occupations by Sex in Statham
Management, Business, Science and Arts Occupations
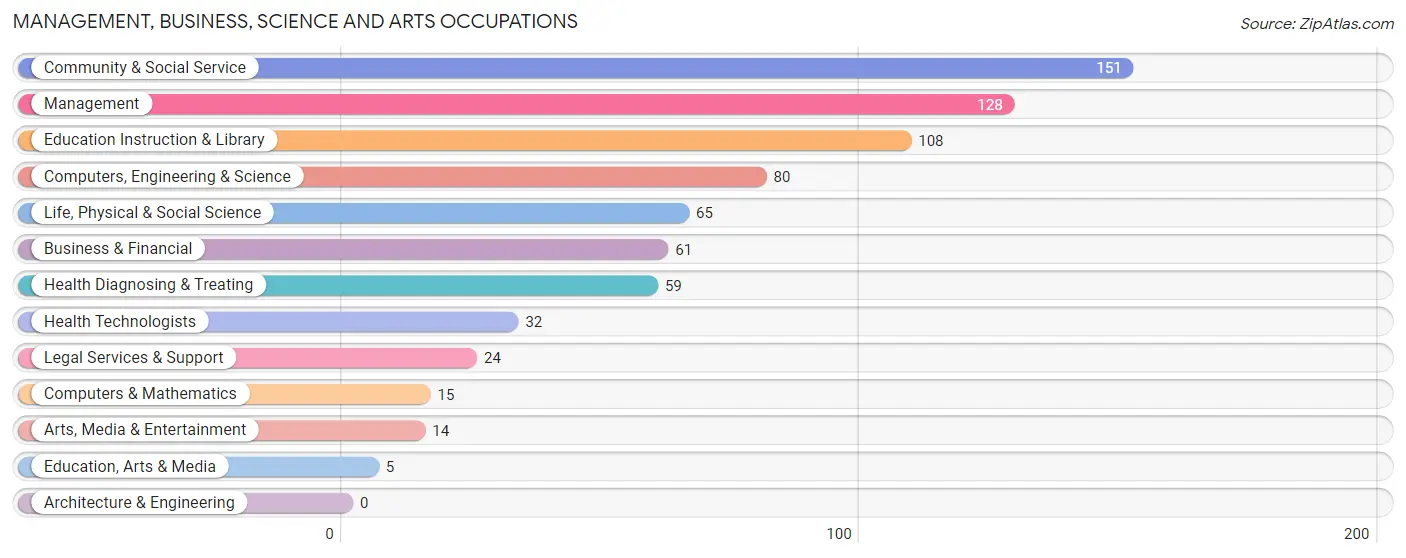
The most common Management, Business, Science and Arts occupations in Statham are Community & Social Service (151 | 9.2%), Management (128 | 7.8%), Education Instruction & Library (108 | 6.6%), Computers, Engineering & Science (80 | 4.9%), and Life, Physical & Social Science (65 | 4.0%).
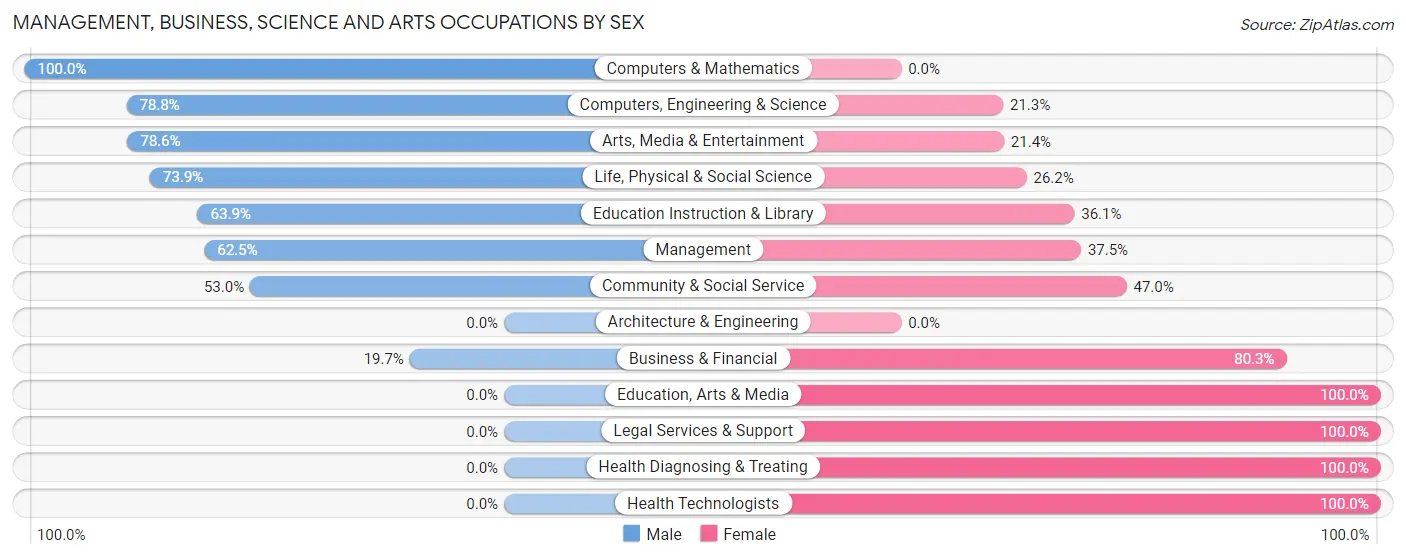
Management, Business, Science and Arts Occupations by Sex
Within the Management, Business, Science and Arts occupations in Statham, the most male-oriented occupations are Computers & Mathematics (100.0%), Computers, Engineering & Science (78.7%), and Arts, Media & Entertainment (78.6%), while the most female-oriented occupations are Education, Arts & Media (100.0%), Legal Services & Support (100.0%), and Health Diagnosing & Treating (100.0%).
| Occupation | Male | Female |
| Management | 80 (62.5%) | 48 (37.5%) |
| Business & Financial | 12 (19.7%) | 49 (80.3%) |
| Computers, Engineering & Science | 63 (78.7%) | 17 (21.2%) |
| Computers & Mathematics | 15 (100.0%) | 0 (0.0%) |
| Architecture & Engineering | 0 (0.0%) | 0 (0.0%) |
| Life, Physical & Social Science | 48 (73.9%) | 17 (26.2%) |
| Community & Social Service | 80 (53.0%) | 71 (47.0%) |
| Education, Arts & Media | 0 (0.0%) | 5 (100.0%) |
| Legal Services & Support | 0 (0.0%) | 24 (100.0%) |
| Education Instruction & Library | 69 (63.9%) | 39 (36.1%) |
| Arts, Media & Entertainment | 11 (78.6%) | 3 (21.4%) |
| Health Diagnosing & Treating | 0 (0.0%) | 59 (100.0%) |
| Health Technologists | 0 (0.0%) | 32 (100.0%) |
| Total (Category) | 235 (49.1%) | 244 (50.9%) |
| Total (Overall) | 793 (48.4%) | 845 (51.6%) |
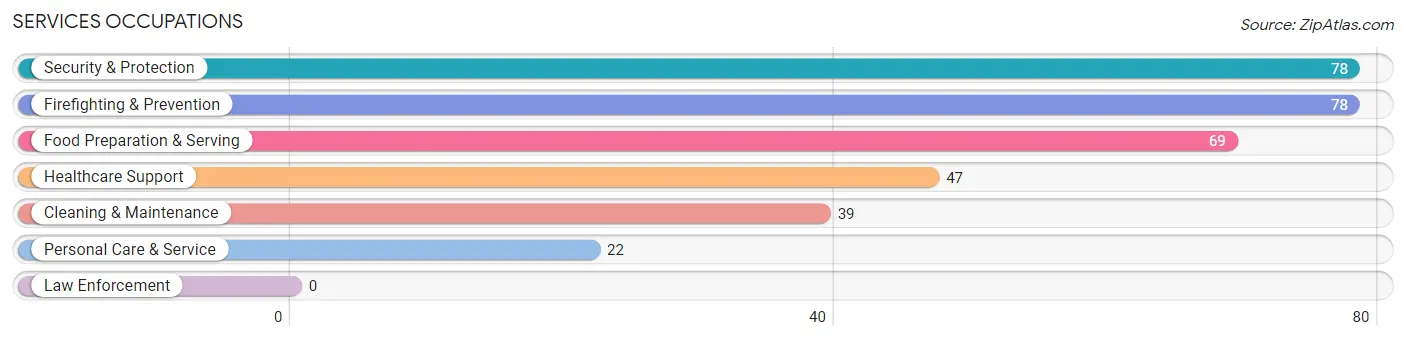
Services Occupations
The most common Services occupations in Statham are Security & Protection (78 | 4.8%), Firefighting & Prevention (78 | 4.8%), Food Preparation & Serving (69 | 4.2%), Healthcare Support (47 | 2.9%), and Cleaning & Maintenance (39 | 2.4%).
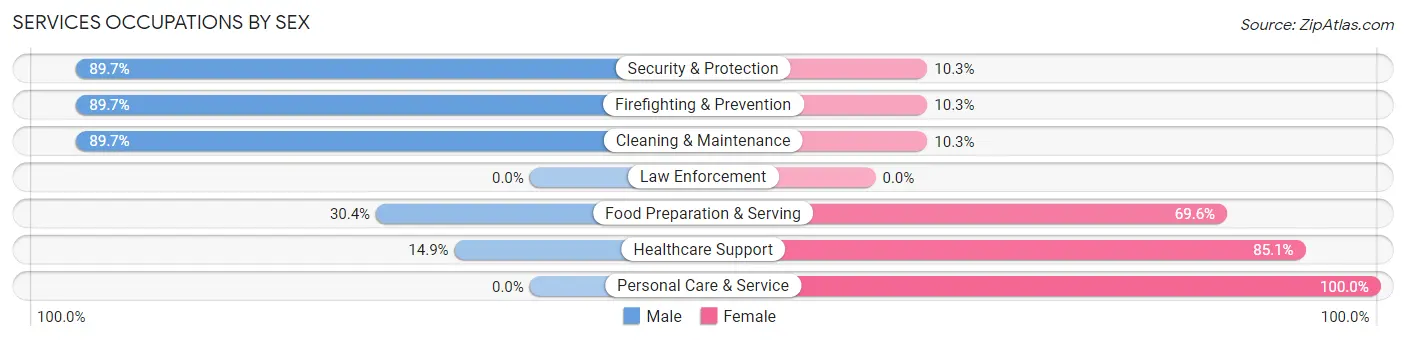
Services Occupations by Sex
Within the Services occupations in Statham, the most male-oriented occupations are Security & Protection (89.7%), Firefighting & Prevention (89.7%), and Cleaning & Maintenance (89.7%), while the most female-oriented occupations are Personal Care & Service (100.0%), Healthcare Support (85.1%), and Food Preparation & Serving (69.6%).
| Occupation | Male | Female |
| Healthcare Support | 7 (14.9%) | 40 (85.1%) |
| Security & Protection | 70 (89.7%) | 8 (10.3%) |
| Firefighting & Prevention | 70 (89.7%) | 8 (10.3%) |
| Law Enforcement | 0 (0.0%) | 0 (0.0%) |
| Food Preparation & Serving | 21 (30.4%) | 48 (69.6%) |
| Cleaning & Maintenance | 35 (89.7%) | 4 (10.3%) |
| Personal Care & Service | 0 (0.0%) | 22 (100.0%) |
| Total (Category) | 133 (52.2%) | 122 (47.8%) |
| Total (Overall) | 793 (48.4%) | 845 (51.6%) |
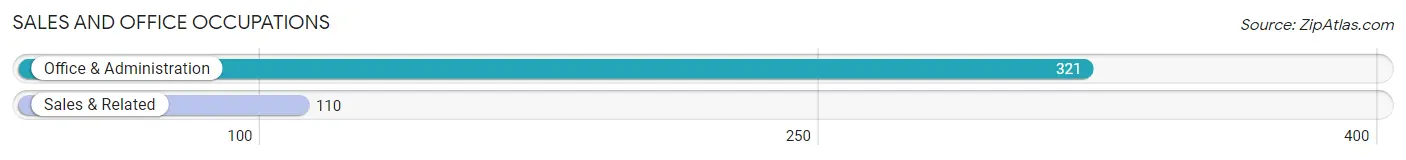
Sales and Office Occupations
The most common Sales and Office occupations in Statham are Office & Administration (321 | 19.6%), and Sales & Related (110 | 6.7%).
Sales and Office Occupations by Sex
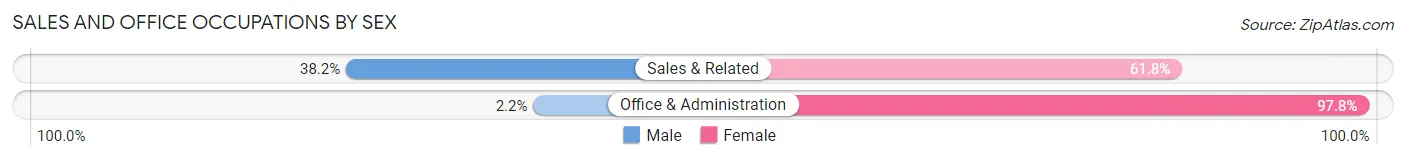
| Occupation | Male | Female |
| Sales & Related | 42 (38.2%) | 68 (61.8%) |
| Office & Administration | 7 (2.2%) | 314 (97.8%) |
| Total (Category) | 49 (11.4%) | 382 (88.6%) |
| Total (Overall) | 793 (48.4%) | 845 (51.6%) |
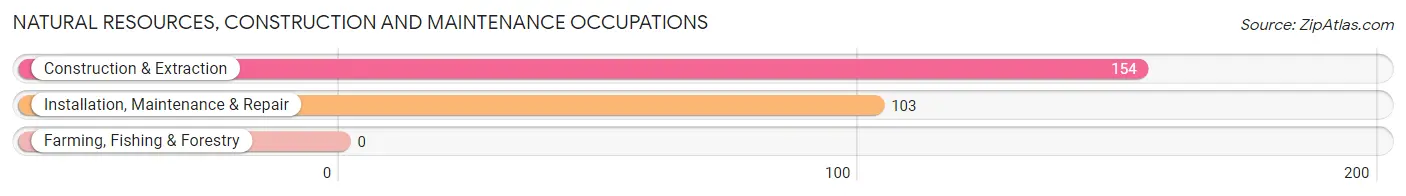
Natural Resources, Construction and Maintenance Occupations
The most common Natural Resources, Construction and Maintenance occupations in Statham are Construction & Extraction (154 | 9.4%), and Installation, Maintenance & Repair (103 | 6.3%).
Natural Resources, Construction and Maintenance Occupations by Sex
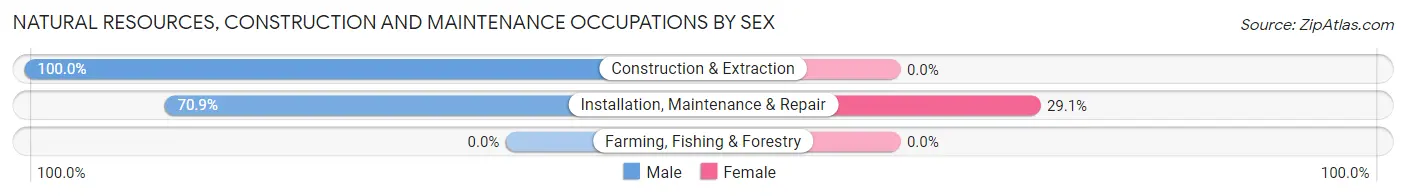
| Occupation | Male | Female |
| Farming, Fishing & Forestry | 0 (0.0%) | 0 (0.0%) |
| Construction & Extraction | 154 (100.0%) | 0 (0.0%) |
| Installation, Maintenance & Repair | 73 (70.9%) | 30 (29.1%) |
| Total (Category) | 227 (88.3%) | 30 (11.7%) |
| Total (Overall) | 793 (48.4%) | 845 (51.6%) |
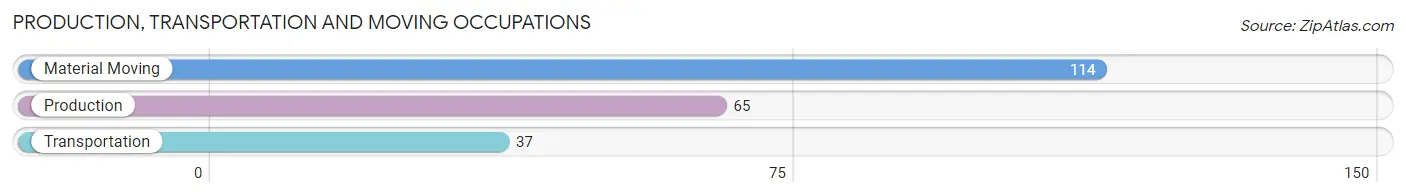
Production, Transportation and Moving Occupations
The most common Production, Transportation and Moving occupations in Statham are Material Moving (114 | 7.0%), Production (65 | 4.0%), and Transportation (37 | 2.3%).
Production, Transportation and Moving Occupations by Sex
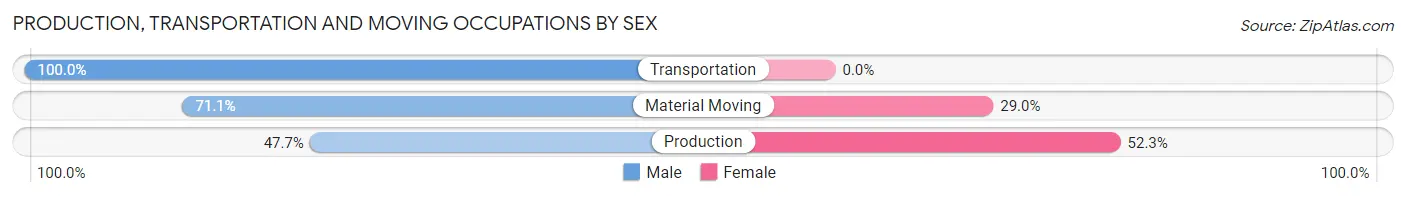
| Occupation | Male | Female |
| Production | 31 (47.7%) | 34 (52.3%) |
| Transportation | 37 (100.0%) | 0 (0.0%) |
| Material Moving | 81 (71.1%) | 33 (28.9%) |
| Total (Category) | 149 (69.0%) | 67 (31.0%) |
| Total (Overall) | 793 (48.4%) | 845 (51.6%) |
Employment Industries by Sex in Statham
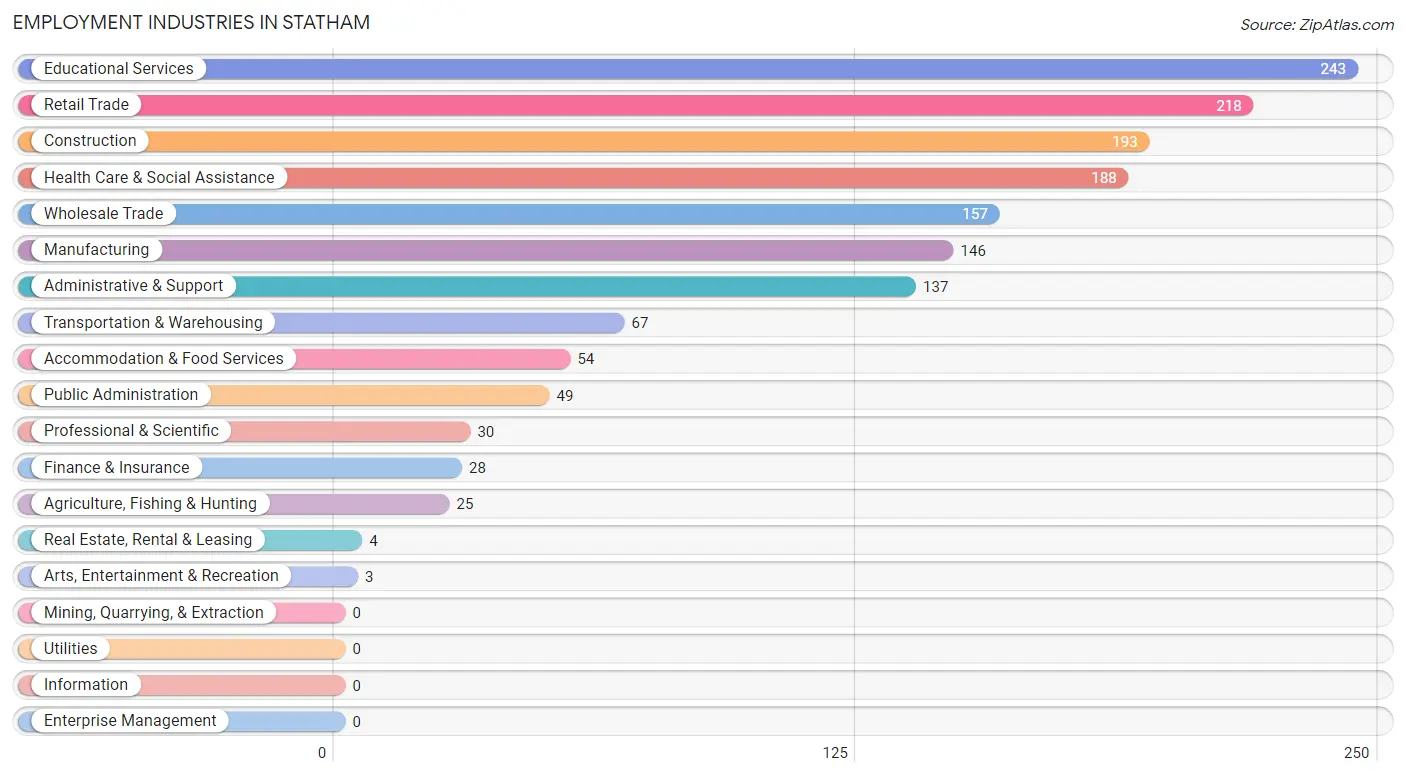
Employment Industries in Statham
The major employment industries in Statham include Educational Services (243 | 14.8%), Retail Trade (218 | 13.3%), Construction (193 | 11.8%), Health Care & Social Assistance (188 | 11.5%), and Wholesale Trade (157 | 9.6%).
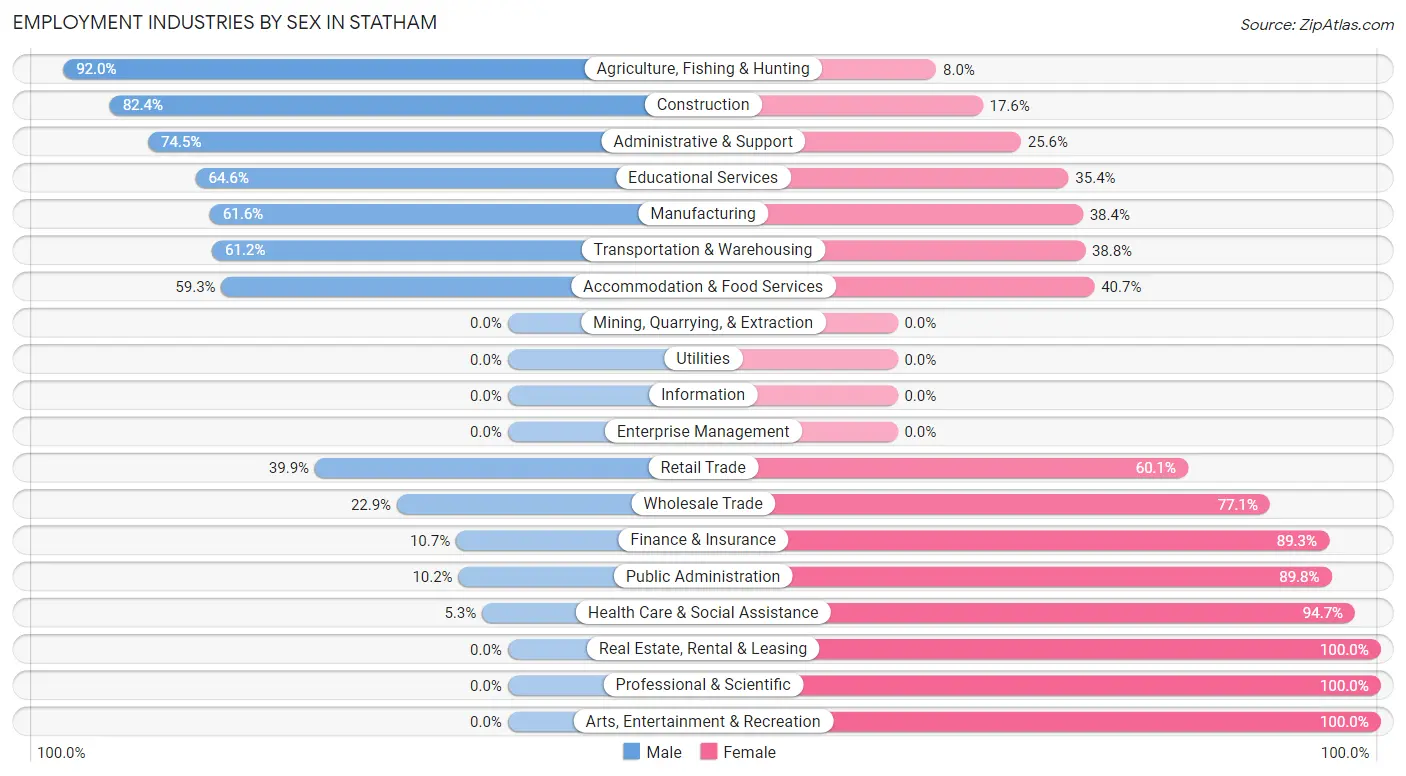
Employment Industries by Sex in Statham
The Statham industries that see more men than women are Agriculture, Fishing & Hunting (92.0%), Construction (82.4%), and Administrative & Support (74.5%), whereas the industries that tend to have a higher number of women are Real Estate, Rental & Leasing (100.0%), Professional & Scientific (100.0%), and Arts, Entertainment & Recreation (100.0%).
| Industry | Male | Female |
| Agriculture, Fishing & Hunting | 23 (92.0%) | 2 (8.0%) |
| Mining, Quarrying, & Extraction | 0 (0.0%) | 0 (0.0%) |
| Construction | 159 (82.4%) | 34 (17.6%) |
| Manufacturing | 90 (61.6%) | 56 (38.4%) |
| Wholesale Trade | 36 (22.9%) | 121 (77.1%) |
| Retail Trade | 87 (39.9%) | 131 (60.1%) |
| Transportation & Warehousing | 41 (61.2%) | 26 (38.8%) |
| Utilities | 0 (0.0%) | 0 (0.0%) |
| Information | 0 (0.0%) | 0 (0.0%) |
| Finance & Insurance | 3 (10.7%) | 25 (89.3%) |
| Real Estate, Rental & Leasing | 0 (0.0%) | 4 (100.0%) |
| Professional & Scientific | 0 (0.0%) | 30 (100.0%) |
| Enterprise Management | 0 (0.0%) | 0 (0.0%) |
| Administrative & Support | 102 (74.5%) | 35 (25.6%) |
| Educational Services | 157 (64.6%) | 86 (35.4%) |
| Health Care & Social Assistance | 10 (5.3%) | 178 (94.7%) |
| Arts, Entertainment & Recreation | 0 (0.0%) | 3 (100.0%) |
| Accommodation & Food Services | 32 (59.3%) | 22 (40.7%) |
| Public Administration | 5 (10.2%) | 44 (89.8%) |
| Total | 793 (48.4%) | 845 (51.6%) |
Education in Statham
School Enrollment in Statham
The most common levels of schooling among the 699 students in Statham are middle school (214 | 30.6%), high school (168 | 24.0%), and elementary school (132 | 18.9%).
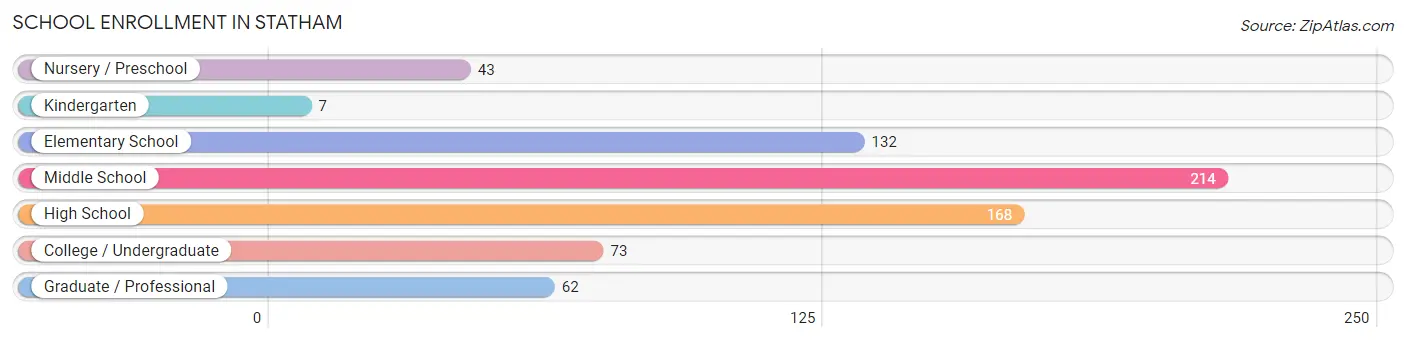
| School Level | # Students | % Students |
| Nursery / Preschool | 43 | 6.1% |
| Kindergarten | 7 | 1.0% |
| Elementary School | 132 | 18.9% |
| Middle School | 214 | 30.6% |
| High School | 168 | 24.0% |
| College / Undergraduate | 73 | 10.4% |
| Graduate / Professional | 62 | 8.9% |
| Total | 699 | 100.0% |
School Enrollment by Age by Funding Source in Statham
Out of a total of 699 students who are enrolled in schools in Statham, 117 (16.7%) attend a private institution, while the remaining 582 (83.3%) are enrolled in public schools. The age group of 18 to 19 year olds has the highest likelihood of being enrolled in private schools, with 10 (66.7% in the age bracket) enrolled. Conversely, the age group of 20 to 24 year olds has the lowest likelihood of being enrolled in a private school, with 22 (100.0% in the age bracket) attending a public institution.
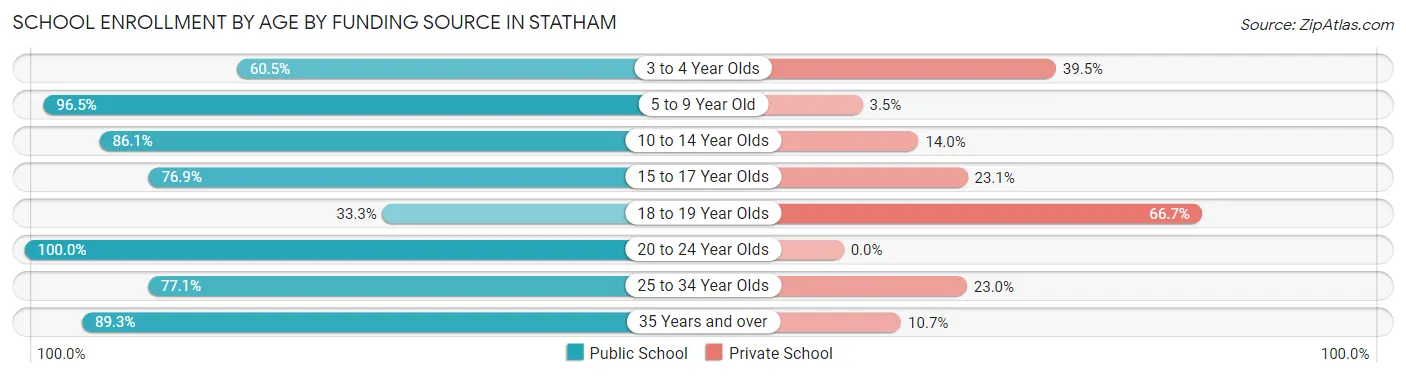
| Age Bracket | Public School | Private School |
| 3 to 4 Year Olds | 26 (60.5%) | 17 (39.5%) |
| 5 to 9 Year Old | 110 (96.5%) | 4 (3.5%) |
| 10 to 14 Year Olds | 222 (86.1%) | 36 (14.0%) |
| 15 to 17 Year Olds | 100 (76.9%) | 30 (23.1%) |
| 18 to 19 Year Olds | 5 (33.3%) | 10 (66.7%) |
| 20 to 24 Year Olds | 22 (100.0%) | 0 (0.0%) |
| 25 to 34 Year Olds | 47 (77.0%) | 14 (23.0%) |
| 35 Years and over | 50 (89.3%) | 6 (10.7%) |
| Total | 582 (83.3%) | 117 (16.7%) |
Educational Attainment by Field of Study in Statham
Education (136 | 27.3%), science & technology (82 | 16.4%), business (63 | 12.6%), bio, nature & agricultural (52 | 10.4%), and visual & performing arts (45 | 9.0%) are the most common fields of study among 499 individuals in Statham who have obtained a bachelor's degree or higher.
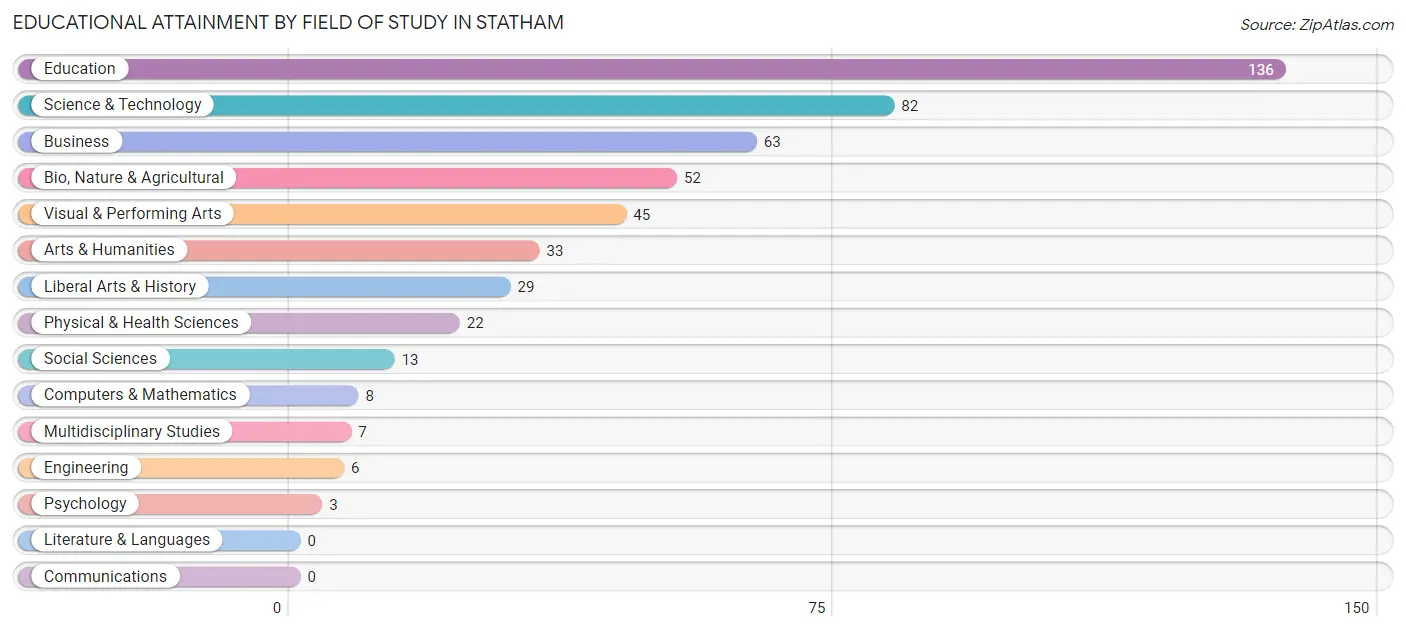
| Field of Study | # Graduates | % Graduates |
| Computers & Mathematics | 8 | 1.6% |
| Bio, Nature & Agricultural | 52 | 10.4% |
| Physical & Health Sciences | 22 | 4.4% |
| Psychology | 3 | 0.6% |
| Social Sciences | 13 | 2.6% |
| Engineering | 6 | 1.2% |
| Multidisciplinary Studies | 7 | 1.4% |
| Science & Technology | 82 | 16.4% |
| Business | 63 | 12.6% |
| Education | 136 | 27.3% |
| Literature & Languages | 0 | 0.0% |
| Liberal Arts & History | 29 | 5.8% |
| Visual & Performing Arts | 45 | 9.0% |
| Communications | 0 | 0.0% |
| Arts & Humanities | 33 | 6.6% |
| Total | 499 | 100.0% |
Transportation & Commute in Statham
Vehicle Availability by Sex in Statham
The most prevalent vehicle ownership categories in Statham are males with 2 vehicles (369, accounting for 47.3%) and females with 2 vehicles (437, making up 44.4%).
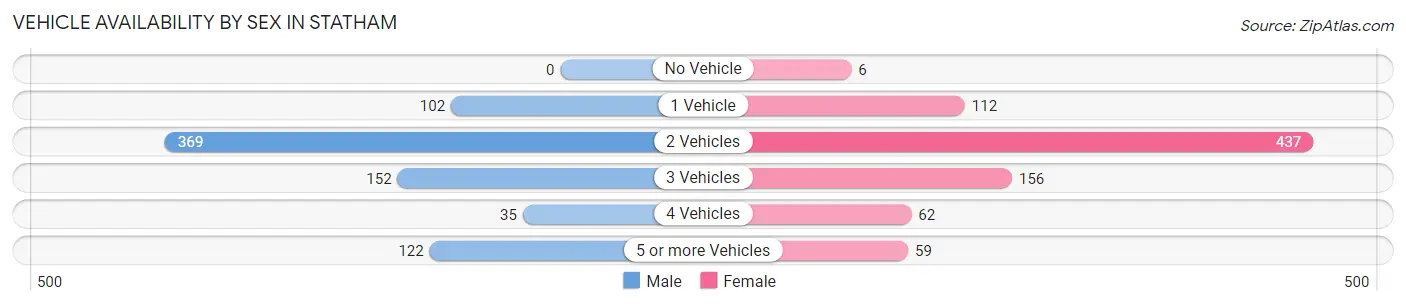
| Vehicles Available | Male | Female |
| No Vehicle | 0 (0.0%) | 6 (0.7%) |
| 1 Vehicle | 102 (13.1%) | 112 (13.5%) |
| 2 Vehicles | 369 (47.3%) | 437 (52.5%) |
| 3 Vehicles | 152 (19.5%) | 156 (18.8%) |
| 4 Vehicles | 35 (4.5%) | 62 (7.4%) |
| 5 or more Vehicles | 122 (15.6%) | 59 (7.1%) |
| Total | 780 (100.0%) | 832 (100.0%) |
Commute Time in Statham
The most frequently occuring commute durations in Statham are 30 to 34 minutes (328 commuters, 21.3%), 15 to 19 minutes (191 commuters, 12.4%), and 5 to 9 minutes (179 commuters, 11.7%).
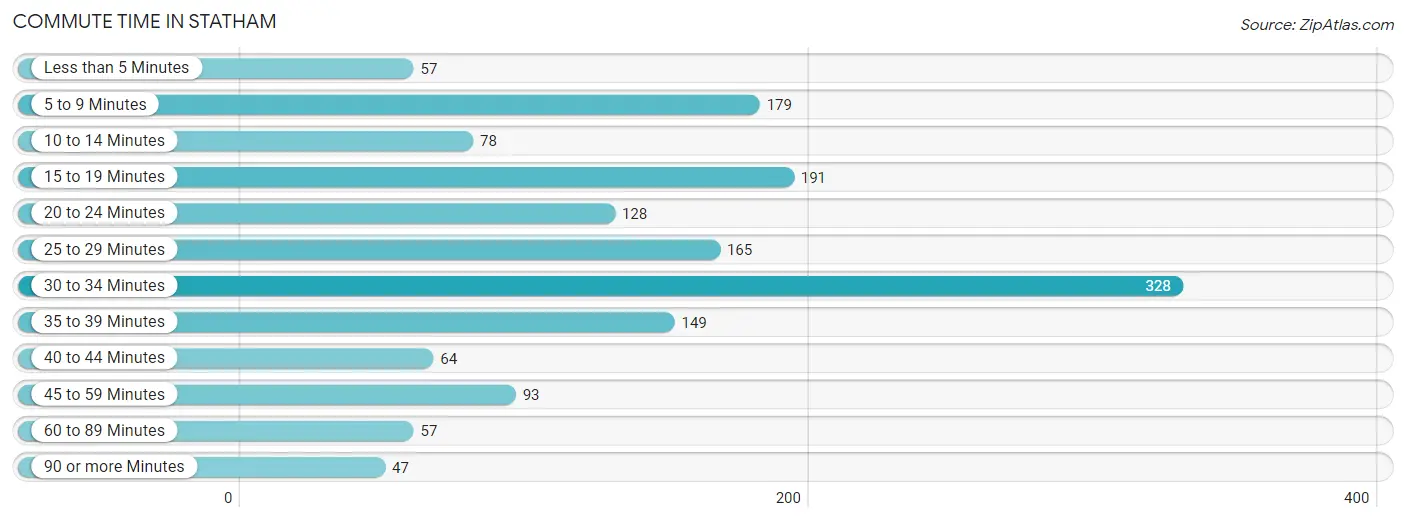
| Commute Time | # Commuters | % Commuters |
| Less than 5 Minutes | 57 | 3.7% |
| 5 to 9 Minutes | 179 | 11.7% |
| 10 to 14 Minutes | 78 | 5.1% |
| 15 to 19 Minutes | 191 | 12.4% |
| 20 to 24 Minutes | 128 | 8.3% |
| 25 to 29 Minutes | 165 | 10.7% |
| 30 to 34 Minutes | 328 | 21.3% |
| 35 to 39 Minutes | 149 | 9.7% |
| 40 to 44 Minutes | 64 | 4.2% |
| 45 to 59 Minutes | 93 | 6.0% |
| 60 to 89 Minutes | 57 | 3.7% |
| 90 or more Minutes | 47 | 3.1% |
Commute Time by Sex in Statham
The most common commute times in Statham are 5 to 9 minutes (179 commuters, 23.7%) for males and 30 to 34 minutes (156 commuters, 20.0%) for females.
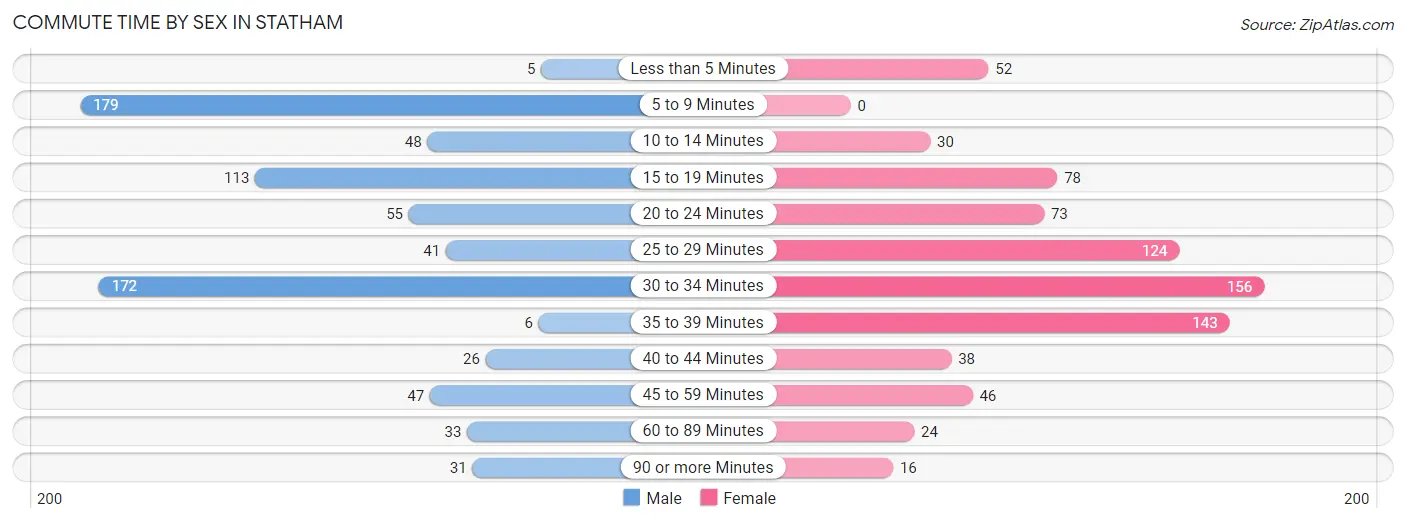
| Commute Time | Male | Female |
| Less than 5 Minutes | 5 (0.7%) | 52 (6.7%) |
| 5 to 9 Minutes | 179 (23.7%) | 0 (0.0%) |
| 10 to 14 Minutes | 48 (6.4%) | 30 (3.8%) |
| 15 to 19 Minutes | 113 (14.9%) | 78 (10.0%) |
| 20 to 24 Minutes | 55 (7.3%) | 73 (9.4%) |
| 25 to 29 Minutes | 41 (5.4%) | 124 (15.9%) |
| 30 to 34 Minutes | 172 (22.8%) | 156 (20.0%) |
| 35 to 39 Minutes | 6 (0.8%) | 143 (18.3%) |
| 40 to 44 Minutes | 26 (3.4%) | 38 (4.9%) |
| 45 to 59 Minutes | 47 (6.2%) | 46 (5.9%) |
| 60 to 89 Minutes | 33 (4.4%) | 24 (3.1%) |
| 90 or more Minutes | 31 (4.1%) | 16 (2.1%) |
Time of Departure to Work by Sex in Statham
The most frequent times of departure to work in Statham are 7:30 AM to 7:59 AM (122, 16.1%) for males and 8:00 AM to 8:29 AM (140, 17.9%) for females.
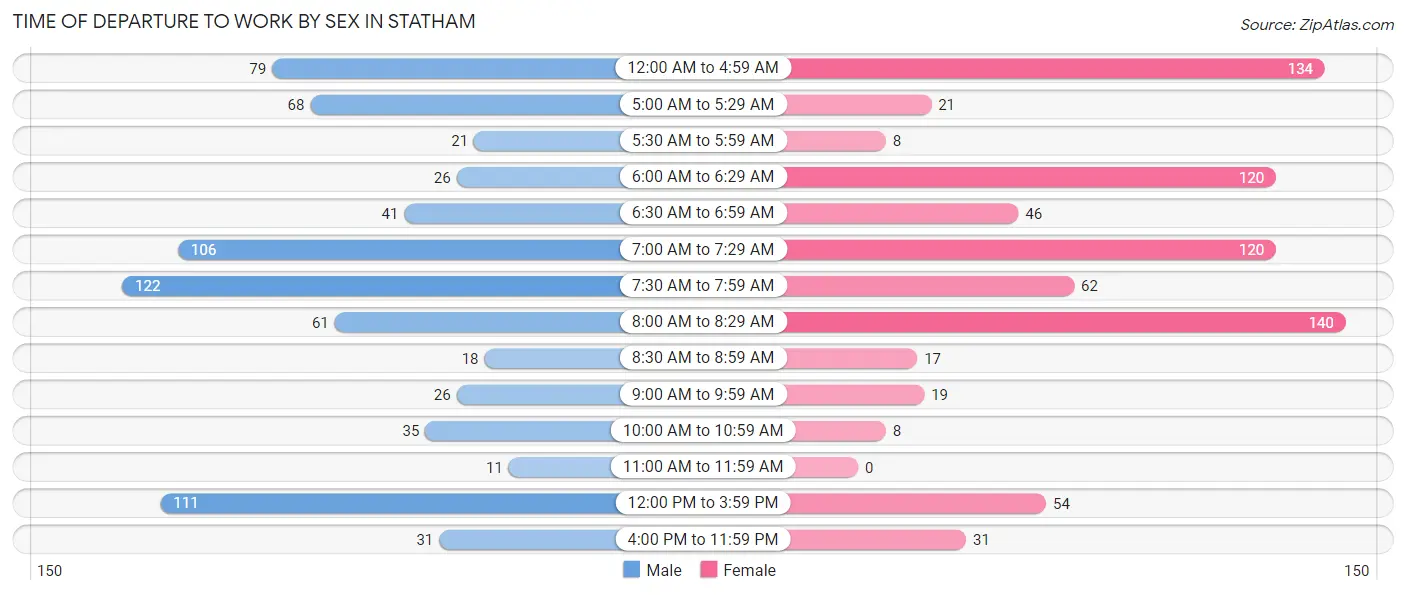
| Time of Departure | Male | Female |
| 12:00 AM to 4:59 AM | 79 (10.4%) | 134 (17.2%) |
| 5:00 AM to 5:29 AM | 68 (9.0%) | 21 (2.7%) |
| 5:30 AM to 5:59 AM | 21 (2.8%) | 8 (1.0%) |
| 6:00 AM to 6:29 AM | 26 (3.4%) | 120 (15.4%) |
| 6:30 AM to 6:59 AM | 41 (5.4%) | 46 (5.9%) |
| 7:00 AM to 7:29 AM | 106 (14.0%) | 120 (15.4%) |
| 7:30 AM to 7:59 AM | 122 (16.1%) | 62 (8.0%) |
| 8:00 AM to 8:29 AM | 61 (8.1%) | 140 (17.9%) |
| 8:30 AM to 8:59 AM | 18 (2.4%) | 17 (2.2%) |
| 9:00 AM to 9:59 AM | 26 (3.4%) | 19 (2.4%) |
| 10:00 AM to 10:59 AM | 35 (4.6%) | 8 (1.0%) |
| 11:00 AM to 11:59 AM | 11 (1.5%) | 0 (0.0%) |
| 12:00 PM to 3:59 PM | 111 (14.7%) | 54 (6.9%) |
| 4:00 PM to 11:59 PM | 31 (4.1%) | 31 (4.0%) |
| Total | 756 (100.0%) | 780 (100.0%) |
Housing Occupancy in Statham
Occupancy by Ownership in Statham
Of the total 937 dwellings in Statham, owner-occupied units account for 721 (76.9%), while renter-occupied units make up 216 (23.1%).
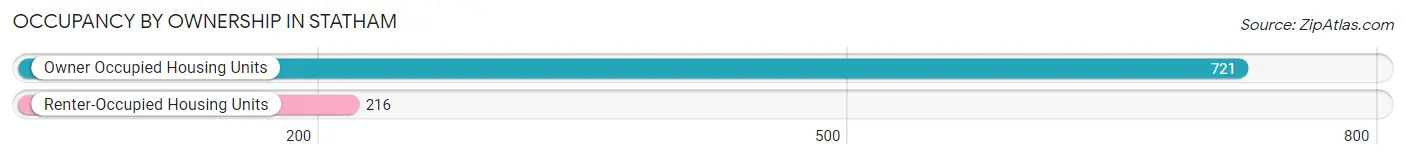
| Occupancy | # Housing Units | % Housing Units |
| Owner Occupied Housing Units | 721 | 76.9% |
| Renter-Occupied Housing Units | 216 | 23.1% |
| Total Occupied Housing Units | 937 | 100.0% |
Occupancy by Household Size in Statham
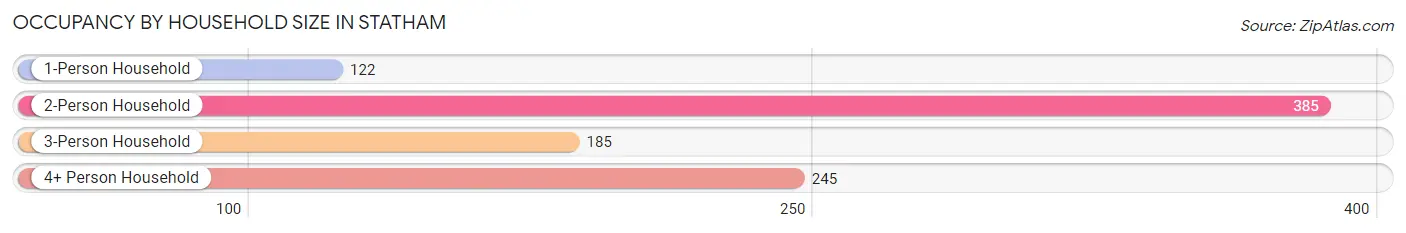
| Household Size | # Housing Units | % Housing Units |
| 1-Person Household | 122 | 13.0% |
| 2-Person Household | 385 | 41.1% |
| 3-Person Household | 185 | 19.7% |
| 4+ Person Household | 245 | 26.2% |
| Total Housing Units | 937 | 100.0% |
Occupancy by Ownership by Household Size in Statham
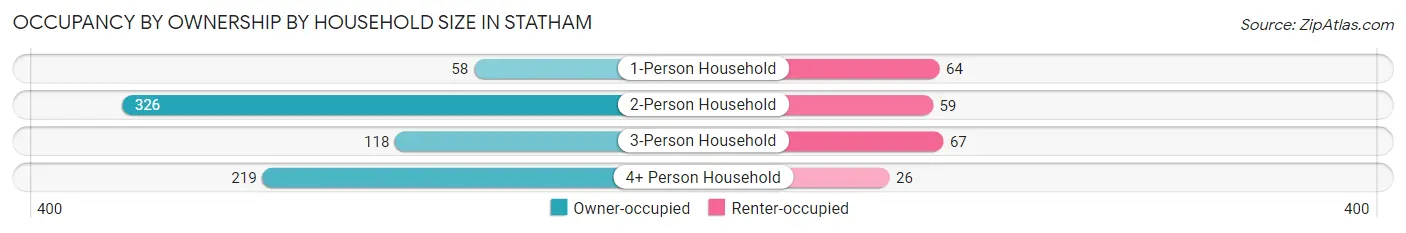
| Household Size | Owner-occupied | Renter-occupied |
| 1-Person Household | 58 (47.5%) | 64 (52.5%) |
| 2-Person Household | 326 (84.7%) | 59 (15.3%) |
| 3-Person Household | 118 (63.8%) | 67 (36.2%) |
| 4+ Person Household | 219 (89.4%) | 26 (10.6%) |
| Total Housing Units | 721 (76.9%) | 216 (23.1%) |
Occupancy by Educational Attainment in Statham
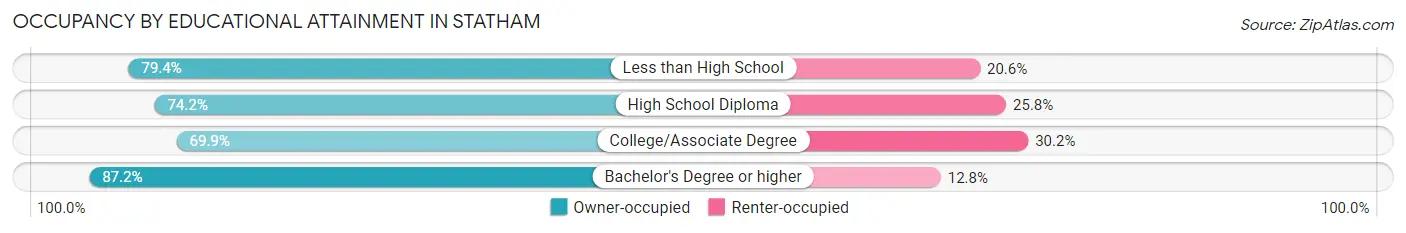
| Household Size | Owner-occupied | Renter-occupied |
| Less than High School | 108 (79.4%) | 28 (20.6%) |
| High School Diploma | 219 (74.2%) | 76 (25.8%) |
| College/Associate Degree | 190 (69.9%) | 82 (30.1%) |
| Bachelor's Degree or higher | 204 (87.2%) | 30 (12.8%) |
Occupancy by Age of Householder in Statham
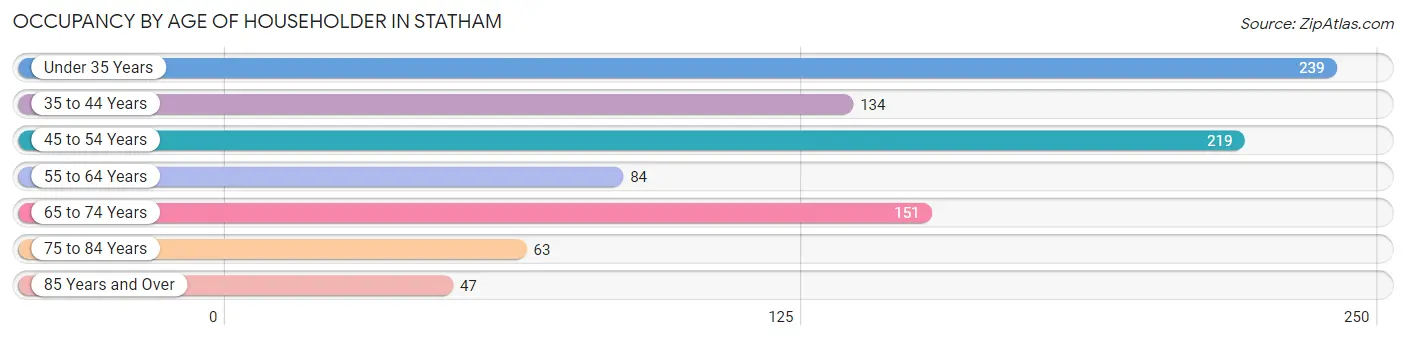
| Age Bracket | # Households | % Households |
| Under 35 Years | 239 | 25.5% |
| 35 to 44 Years | 134 | 14.3% |
| 45 to 54 Years | 219 | 23.4% |
| 55 to 64 Years | 84 | 9.0% |
| 65 to 74 Years | 151 | 16.1% |
| 75 to 84 Years | 63 | 6.7% |
| 85 Years and Over | 47 | 5.0% |
| Total | 937 | 100.0% |
Housing Finances in Statham
Median Income by Occupancy in Statham
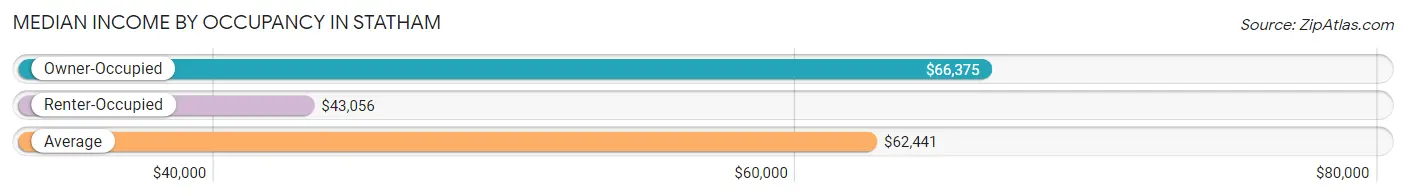
| Occupancy Type | # Households | Median Income |
| Owner-Occupied | 721 (76.9%) | $66,375 |
| Renter-Occupied | 216 (23.1%) | $43,056 |
| Average | 937 (100.0%) | $62,441 |
Occupancy by Householder Income Bracket in Statham
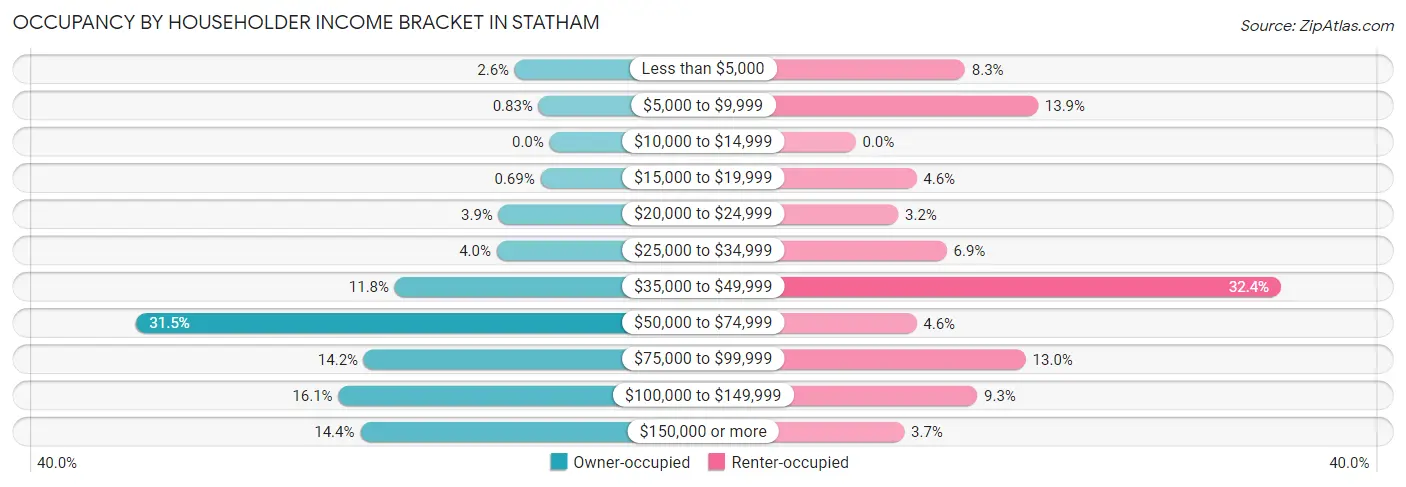
| Income Bracket | Owner-occupied | Renter-occupied |
| Less than $5,000 | 19 (2.6%) | 18 (8.3%) |
| $5,000 to $9,999 | 6 (0.8%) | 30 (13.9%) |
| $10,000 to $14,999 | 0 (0.0%) | 0 (0.0%) |
| $15,000 to $19,999 | 5 (0.7%) | 10 (4.6%) |
| $20,000 to $24,999 | 28 (3.9%) | 7 (3.2%) |
| $25,000 to $34,999 | 29 (4.0%) | 15 (6.9%) |
| $35,000 to $49,999 | 85 (11.8%) | 70 (32.4%) |
| $50,000 to $74,999 | 227 (31.5%) | 10 (4.6%) |
| $75,000 to $99,999 | 102 (14.1%) | 28 (13.0%) |
| $100,000 to $149,999 | 116 (16.1%) | 20 (9.3%) |
| $150,000 or more | 104 (14.4%) | 8 (3.7%) |
| Total | 721 (100.0%) | 216 (100.0%) |
Monthly Housing Cost Tiers in Statham
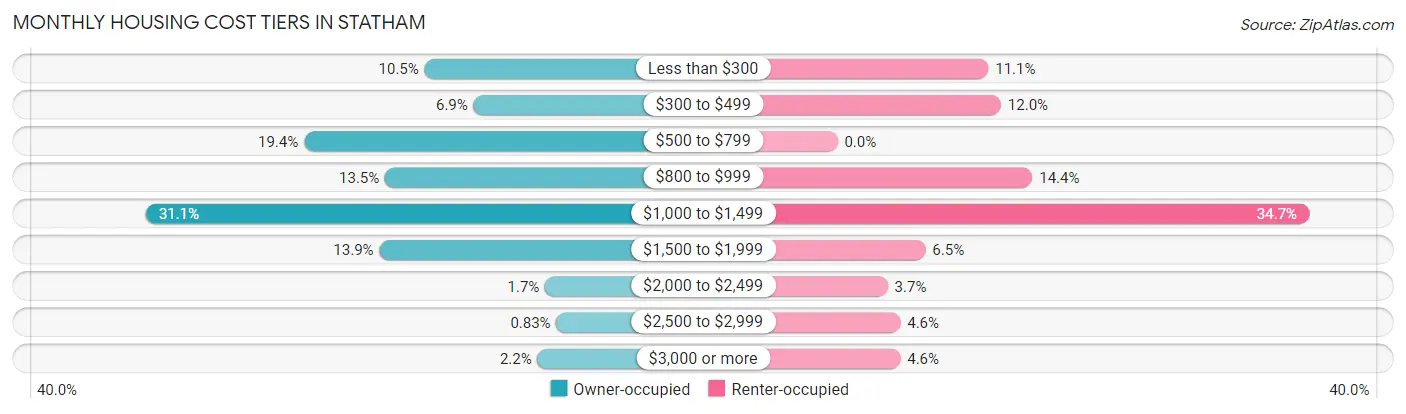
| Monthly Cost | Owner-occupied | Renter-occupied |
| Less than $300 | 76 (10.5%) | 24 (11.1%) |
| $300 to $499 | 50 (6.9%) | 26 (12.0%) |
| $500 to $799 | 140 (19.4%) | 0 (0.0%) |
| $800 to $999 | 97 (13.5%) | 31 (14.3%) |
| $1,000 to $1,499 | 224 (31.1%) | 75 (34.7%) |
| $1,500 to $1,999 | 100 (13.9%) | 14 (6.5%) |
| $2,000 to $2,499 | 12 (1.7%) | 8 (3.7%) |
| $2,500 to $2,999 | 6 (0.8%) | 10 (4.6%) |
| $3,000 or more | 16 (2.2%) | 10 (4.6%) |
| Total | 721 (100.0%) | 216 (100.0%) |
Physical Housing Characteristics in Statham
Housing Structures in Statham
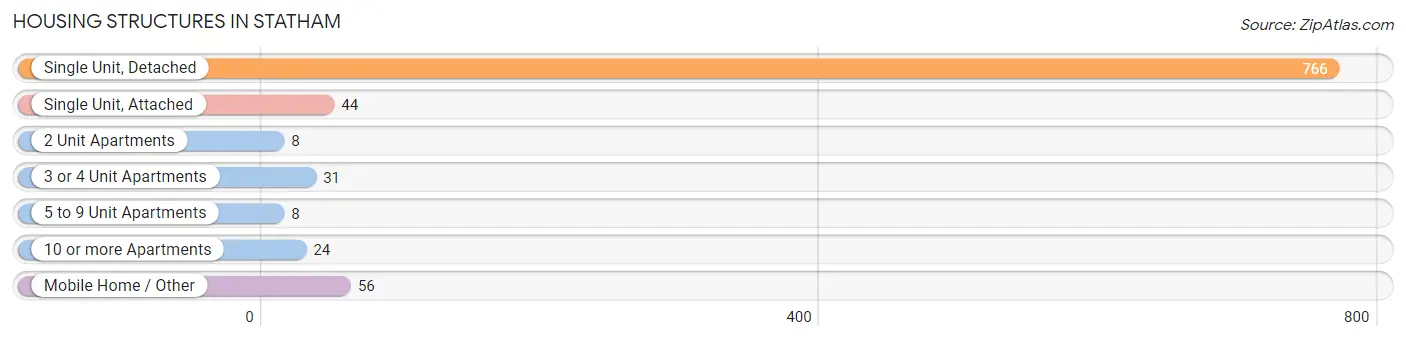
| Structure Type | # Housing Units | % Housing Units |
| Single Unit, Detached | 766 | 81.8% |
| Single Unit, Attached | 44 | 4.7% |
| 2 Unit Apartments | 8 | 0.9% |
| 3 or 4 Unit Apartments | 31 | 3.3% |
| 5 to 9 Unit Apartments | 8 | 0.9% |
| 10 or more Apartments | 24 | 2.6% |
| Mobile Home / Other | 56 | 6.0% |
| Total | 937 | 100.0% |
Housing Structures by Occupancy in Statham
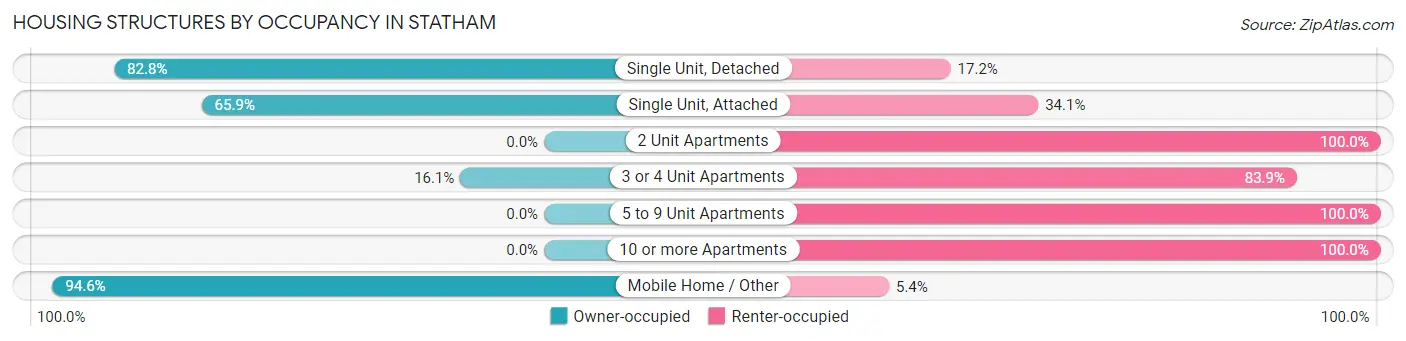
| Structure Type | Owner-occupied | Renter-occupied |
| Single Unit, Detached | 634 (82.8%) | 132 (17.2%) |
| Single Unit, Attached | 29 (65.9%) | 15 (34.1%) |
| 2 Unit Apartments | 0 (0.0%) | 8 (100.0%) |
| 3 or 4 Unit Apartments | 5 (16.1%) | 26 (83.9%) |
| 5 to 9 Unit Apartments | 0 (0.0%) | 8 (100.0%) |
| 10 or more Apartments | 0 (0.0%) | 24 (100.0%) |
| Mobile Home / Other | 53 (94.6%) | 3 (5.4%) |
| Total | 721 (76.9%) | 216 (23.1%) |
Housing Structures by Number of Rooms in Statham
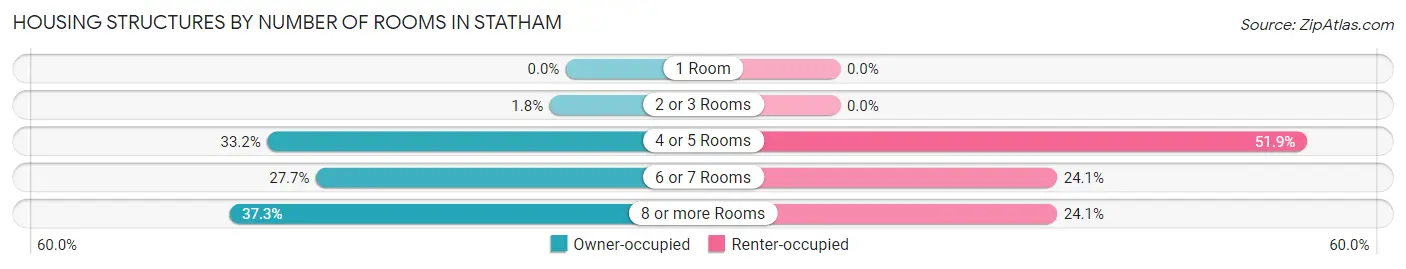
| Number of Rooms | Owner-occupied | Renter-occupied |
| 1 Room | 0 (0.0%) | 0 (0.0%) |
| 2 or 3 Rooms | 13 (1.8%) | 0 (0.0%) |
| 4 or 5 Rooms | 239 (33.2%) | 112 (51.8%) |
| 6 or 7 Rooms | 200 (27.7%) | 52 (24.1%) |
| 8 or more Rooms | 269 (37.3%) | 52 (24.1%) |
| Total | 721 (100.0%) | 216 (100.0%) |
Housing Structure by Heating Type in Statham
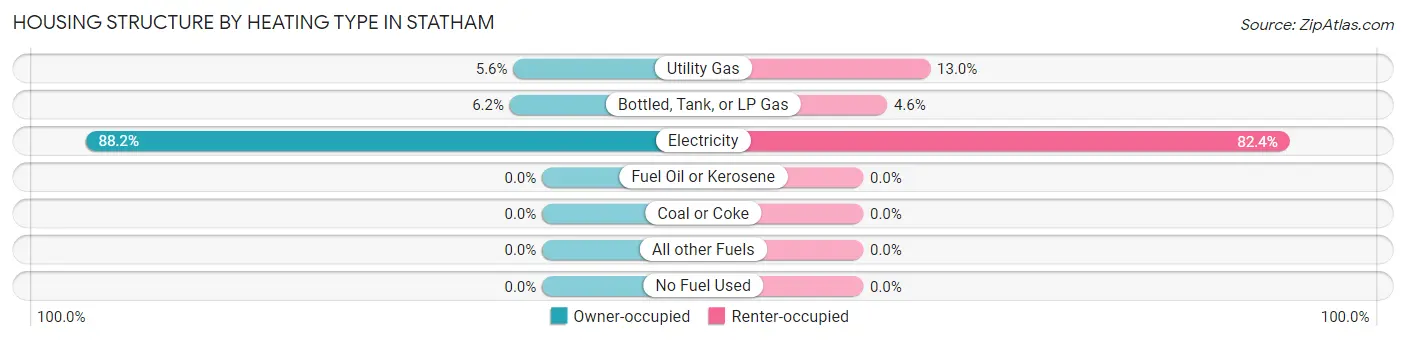
| Heating Type | Owner-occupied | Renter-occupied |
| Utility Gas | 40 (5.6%) | 28 (13.0%) |
| Bottled, Tank, or LP Gas | 45 (6.2%) | 10 (4.6%) |
| Electricity | 636 (88.2%) | 178 (82.4%) |
| Fuel Oil or Kerosene | 0 (0.0%) | 0 (0.0%) |
| Coal or Coke | 0 (0.0%) | 0 (0.0%) |
| All other Fuels | 0 (0.0%) | 0 (0.0%) |
| No Fuel Used | 0 (0.0%) | 0 (0.0%) |
| Total | 721 (100.0%) | 216 (100.0%) |
Household Vehicle Usage in Statham
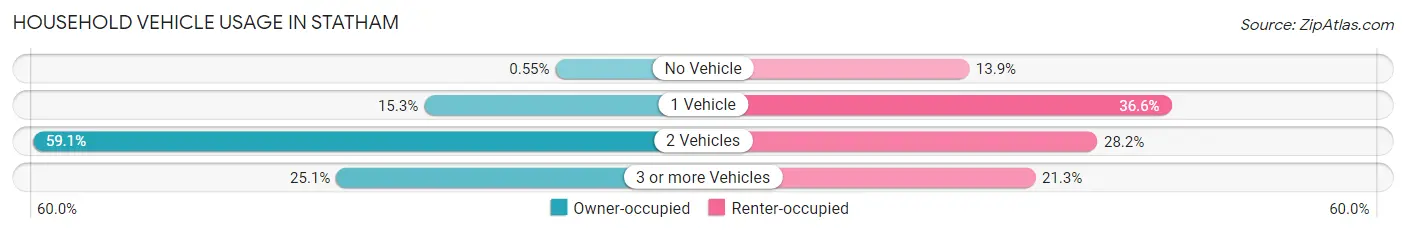
| Vehicles per Household | Owner-occupied | Renter-occupied |
| No Vehicle | 4 (0.5%) | 30 (13.9%) |
| 1 Vehicle | 110 (15.3%) | 79 (36.6%) |
| 2 Vehicles | 426 (59.1%) | 61 (28.2%) |
| 3 or more Vehicles | 181 (25.1%) | 46 (21.3%) |
| Total | 721 (100.0%) | 216 (100.0%) |
Real Estate & Mortgages in Statham
Real Estate and Mortgage Overview in Statham
| Characteristic | Without Mortgage | With Mortgage |
| Housing Units | 222 | 499 |
| Median Property Value | $213,000 | $194,600 |
| Median Household Income | $62,161 | $61 |
| Monthly Housing Costs | $421 | $16 |
| Real Estate Taxes | $1,119 | $21 |
Property Value by Mortgage Status in Statham
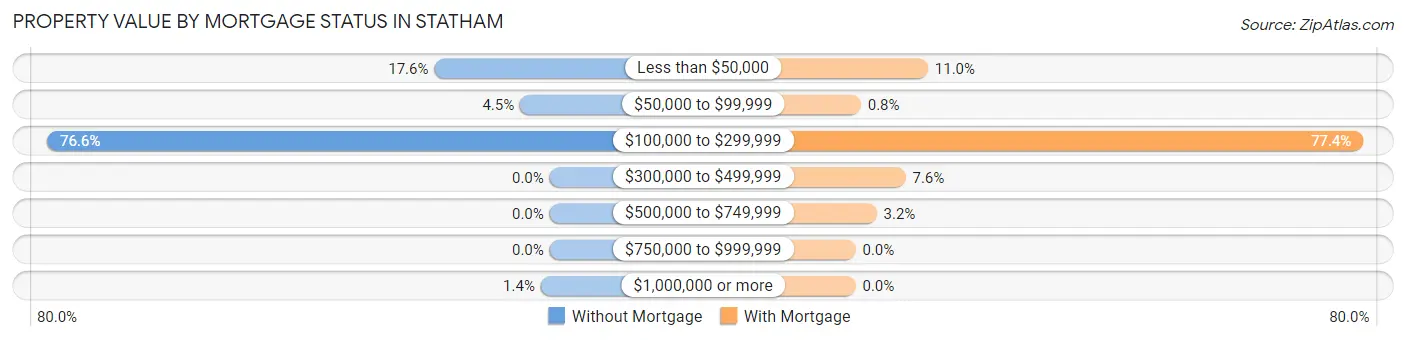
| Property Value | Without Mortgage | With Mortgage |
| Less than $50,000 | 39 (17.6%) | 55 (11.0%) |
| $50,000 to $99,999 | 10 (4.5%) | 4 (0.8%) |
| $100,000 to $299,999 | 170 (76.6%) | 386 (77.3%) |
| $300,000 to $499,999 | 0 (0.0%) | 38 (7.6%) |
| $500,000 to $749,999 | 0 (0.0%) | 16 (3.2%) |
| $750,000 to $999,999 | 0 (0.0%) | 0 (0.0%) |
| $1,000,000 or more | 3 (1.3%) | 0 (0.0%) |
| Total | 222 (100.0%) | 499 (100.0%) |
Household Income by Mortgage Status in Statham
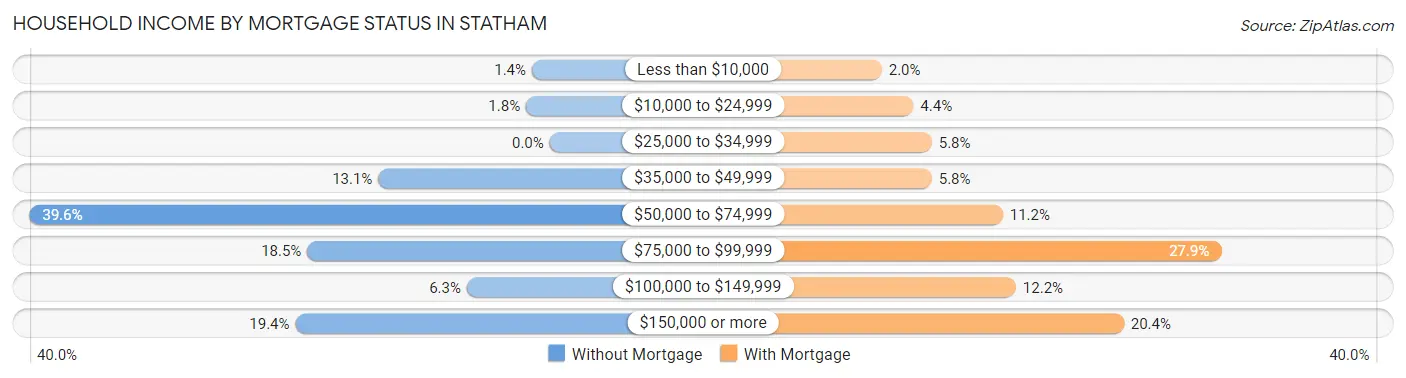
| Household Income | Without Mortgage | With Mortgage |
| Less than $10,000 | 3 (1.3%) | 10 (2.0%) |
| $10,000 to $24,999 | 4 (1.8%) | 22 (4.4%) |
| $25,000 to $34,999 | 0 (0.0%) | 29 (5.8%) |
| $35,000 to $49,999 | 29 (13.1%) | 29 (5.8%) |
| $50,000 to $74,999 | 88 (39.6%) | 56 (11.2%) |
| $75,000 to $99,999 | 41 (18.5%) | 139 (27.9%) |
| $100,000 to $149,999 | 14 (6.3%) | 61 (12.2%) |
| $150,000 or more | 43 (19.4%) | 102 (20.4%) |
| Total | 222 (100.0%) | 499 (100.0%) |
Property Value to Household Income Ratio in Statham
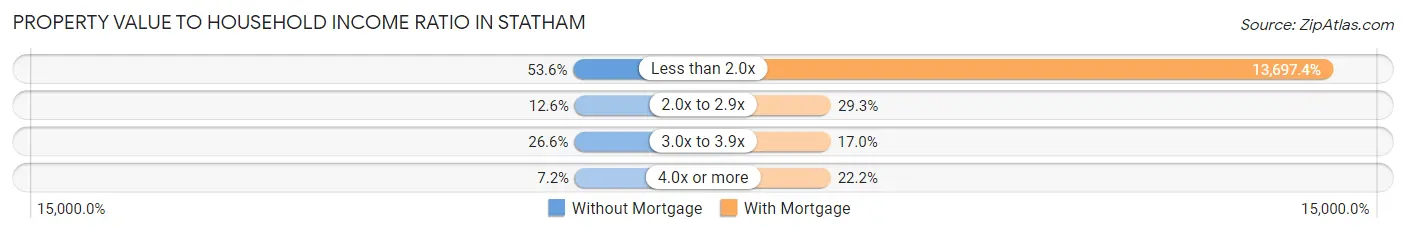
| Value-to-Income Ratio | Without Mortgage | With Mortgage |
| Less than 2.0x | 119 (53.6%) | 68,350 (13,697.4%) |
| 2.0x to 2.9x | 28 (12.6%) | 146 (29.3%) |
| 3.0x to 3.9x | 59 (26.6%) | 85 (17.0%) |
| 4.0x or more | 16 (7.2%) | 111 (22.2%) |
| Total | 222 (100.0%) | 499 (100.0%) |
Real Estate Taxes by Mortgage Status in Statham
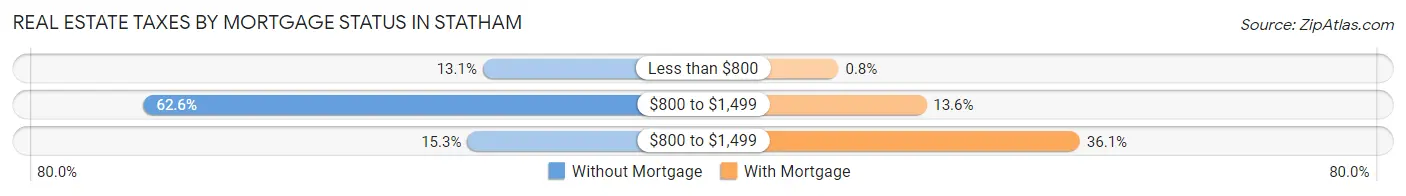
| Property Taxes | Without Mortgage | With Mortgage |
| Less than $800 | 29 (13.1%) | 4 (0.8%) |
| $800 to $1,499 | 139 (62.6%) | 68 (13.6%) |
| $800 to $1,499 | 34 (15.3%) | 180 (36.1%) |
| Total | 222 (100.0%) | 499 (100.0%) |
Health & Disability in Statham
Health Insurance Coverage by Age in Statham
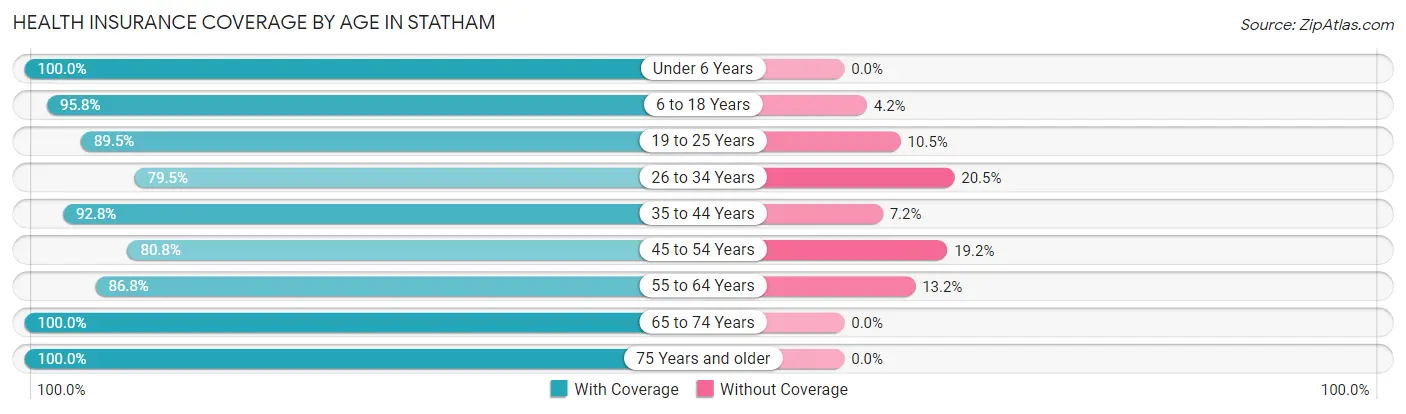
| Age Bracket | With Coverage | Without Coverage |
| Under 6 Years | 146 (100.0%) | 0 (0.0%) |
| 6 to 18 Years | 523 (95.8%) | 23 (4.2%) |
| 19 to 25 Years | 230 (89.5%) | 27 (10.5%) |
| 26 to 34 Years | 395 (79.5%) | 102 (20.5%) |
| 35 to 44 Years | 363 (92.8%) | 28 (7.2%) |
| 45 to 54 Years | 324 (80.8%) | 77 (19.2%) |
| 55 to 64 Years | 151 (86.8%) | 23 (13.2%) |
| 65 to 74 Years | 278 (100.0%) | 0 (0.0%) |
| 75 Years and older | 139 (100.0%) | 0 (0.0%) |
| Total | 2,549 (90.1%) | 280 (9.9%) |
Health Insurance Coverage by Citizenship Status in Statham
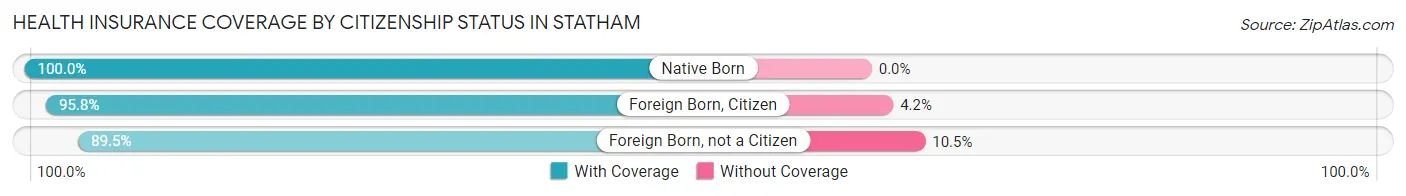
| Citizenship Status | With Coverage | Without Coverage |
| Native Born | 146 (100.0%) | 0 (0.0%) |
| Foreign Born, Citizen | 523 (95.8%) | 23 (4.2%) |
| Foreign Born, not a Citizen | 230 (89.5%) | 27 (10.5%) |
Health Insurance Coverage by Household Income in Statham
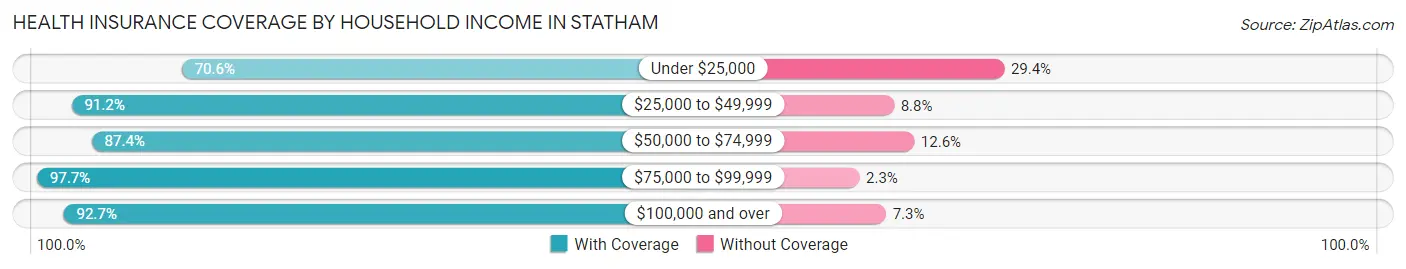
| Household Income | With Coverage | Without Coverage |
| Under $25,000 | 175 (70.6%) | 73 (29.4%) |
| $25,000 to $49,999 | 550 (91.2%) | 53 (8.8%) |
| $50,000 to $74,999 | 487 (87.4%) | 70 (12.6%) |
| $75,000 to $99,999 | 380 (97.7%) | 9 (2.3%) |
| $100,000 and over | 952 (92.7%) | 75 (7.3%) |
Public vs Private Health Insurance Coverage by Age in Statham
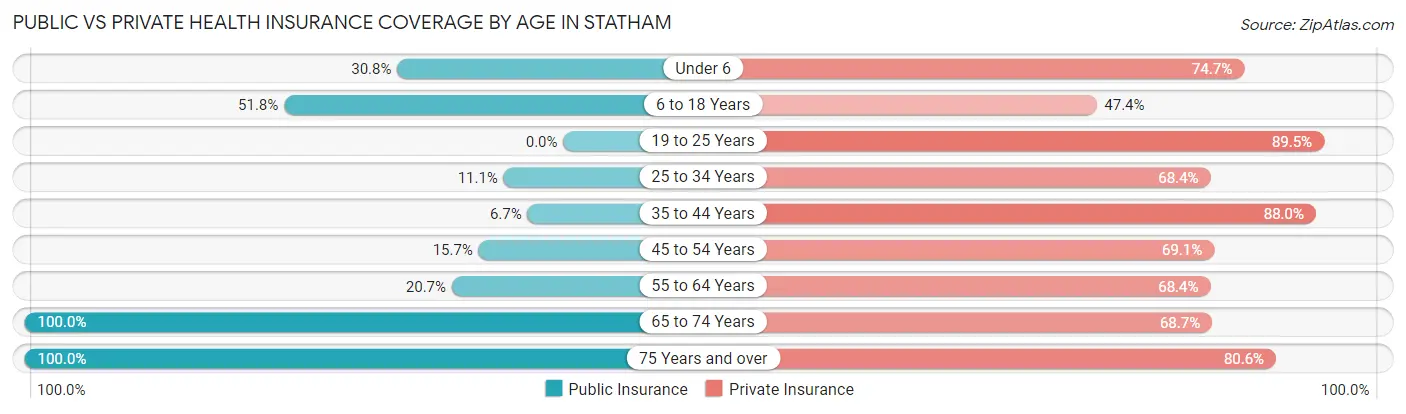
| Age Bracket | Public Insurance | Private Insurance |
| Under 6 | 45 (30.8%) | 109 (74.7%) |
| 6 to 18 Years | 283 (51.8%) | 259 (47.4%) |
| 19 to 25 Years | 0 (0.0%) | 230 (89.5%) |
| 25 to 34 Years | 55 (11.1%) | 340 (68.4%) |
| 35 to 44 Years | 26 (6.7%) | 344 (88.0%) |
| 45 to 54 Years | 63 (15.7%) | 277 (69.1%) |
| 55 to 64 Years | 36 (20.7%) | 119 (68.4%) |
| 65 to 74 Years | 278 (100.0%) | 191 (68.7%) |
| 75 Years and over | 139 (100.0%) | 112 (80.6%) |
| Total | 925 (32.7%) | 1,981 (70.0%) |
Disability Status by Sex by Age in Statham
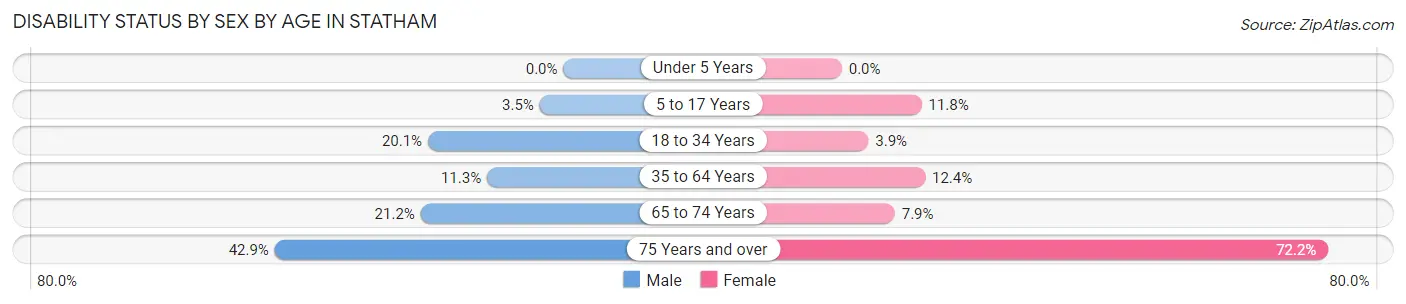
| Age Bracket | Male | Female |
| Under 5 Years | 0 (0.0%) | 0 (0.0%) |
| 5 to 17 Years | 8 (3.5%) | 36 (11.8%) |
| 18 to 34 Years | 73 (20.1%) | 16 (3.9%) |
| 35 to 64 Years | 49 (11.3%) | 66 (12.4%) |
| 65 to 74 Years | 32 (21.2%) | 10 (7.9%) |
| 75 Years and over | 21 (42.9%) | 65 (72.2%) |
Disability Class by Sex by Age in Statham
Disability Class: Hearing Difficulty
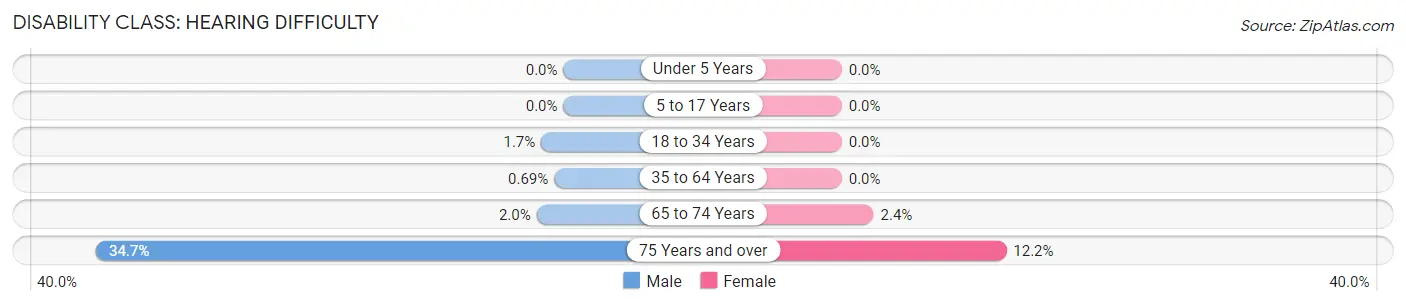
| Age Bracket | Male | Female |
| Under 5 Years | 0 (0.0%) | 0 (0.0%) |
| 5 to 17 Years | 0 (0.0%) | 0 (0.0%) |
| 18 to 34 Years | 6 (1.7%) | 0 (0.0%) |
| 35 to 64 Years | 3 (0.7%) | 0 (0.0%) |
| 65 to 74 Years | 3 (2.0%) | 3 (2.4%) |
| 75 Years and over | 17 (34.7%) | 11 (12.2%) |
Disability Class: Vision Difficulty
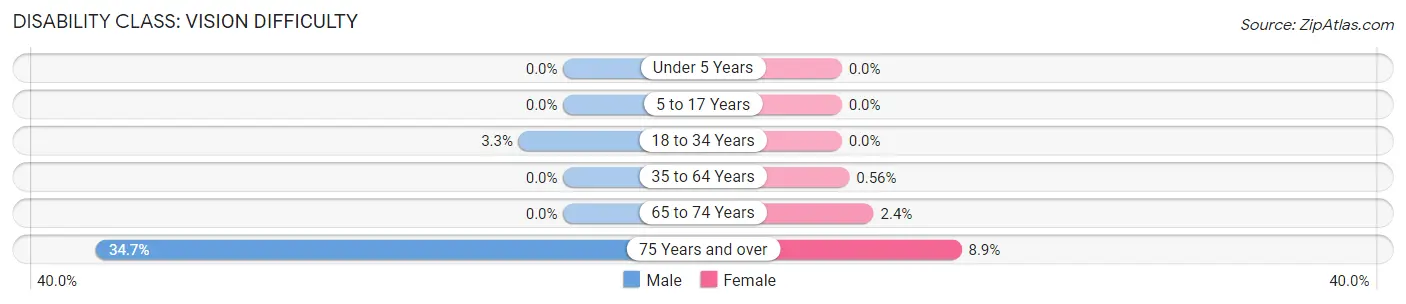
| Age Bracket | Male | Female |
| Under 5 Years | 0 (0.0%) | 0 (0.0%) |
| 5 to 17 Years | 0 (0.0%) | 0 (0.0%) |
| 18 to 34 Years | 12 (3.3%) | 0 (0.0%) |
| 35 to 64 Years | 0 (0.0%) | 3 (0.6%) |
| 65 to 74 Years | 0 (0.0%) | 3 (2.4%) |
| 75 Years and over | 17 (34.7%) | 8 (8.9%) |
Disability Class: Cognitive Difficulty
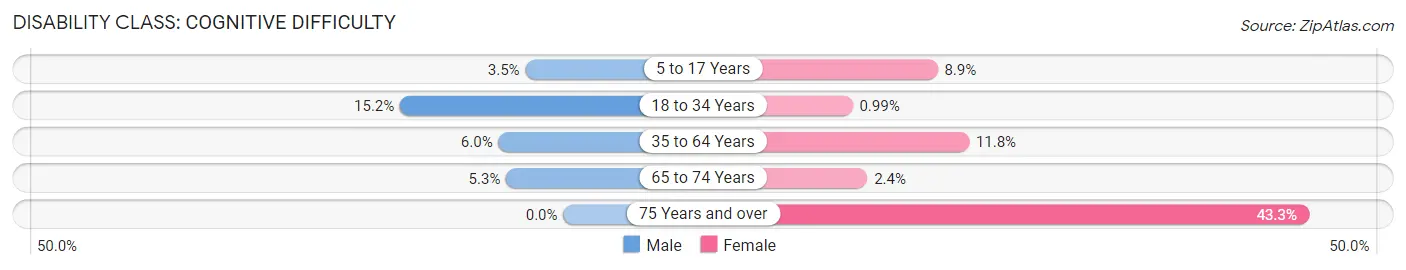
| Age Bracket | Male | Female |
| 5 to 17 Years | 8 (3.5%) | 27 (8.9%) |
| 18 to 34 Years | 55 (15.1%) | 4 (1.0%) |
| 35 to 64 Years | 26 (6.0%) | 63 (11.8%) |
| 65 to 74 Years | 8 (5.3%) | 3 (2.4%) |
| 75 Years and over | 0 (0.0%) | 39 (43.3%) |
Disability Class: Ambulatory Difficulty
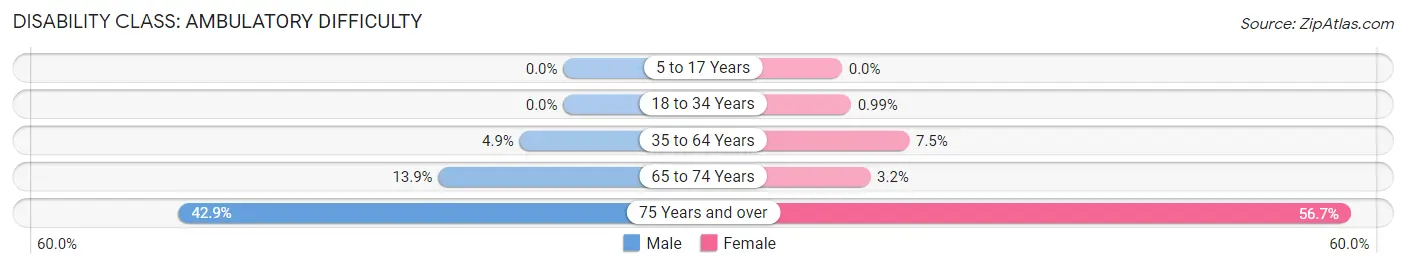
| Age Bracket | Male | Female |
| 5 to 17 Years | 0 (0.0%) | 0 (0.0%) |
| 18 to 34 Years | 0 (0.0%) | 4 (1.0%) |
| 35 to 64 Years | 21 (4.9%) | 40 (7.5%) |
| 65 to 74 Years | 21 (13.9%) | 4 (3.2%) |
| 75 Years and over | 21 (42.9%) | 51 (56.7%) |
Disability Class: Self-Care Difficulty
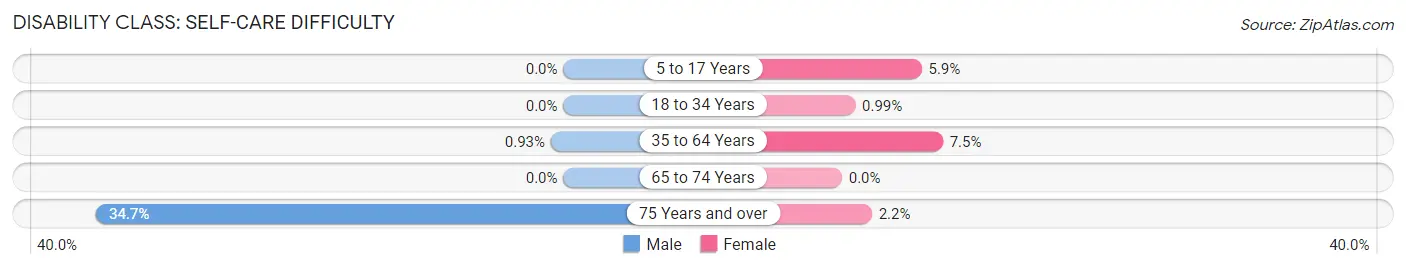
| Age Bracket | Male | Female |
| 5 to 17 Years | 0 (0.0%) | 18 (5.9%) |
| 18 to 34 Years | 0 (0.0%) | 4 (1.0%) |
| 35 to 64 Years | 4 (0.9%) | 40 (7.5%) |
| 65 to 74 Years | 0 (0.0%) | 0 (0.0%) |
| 75 Years and over | 17 (34.7%) | 2 (2.2%) |
Technology Access in Statham
Computing Device Access in Statham
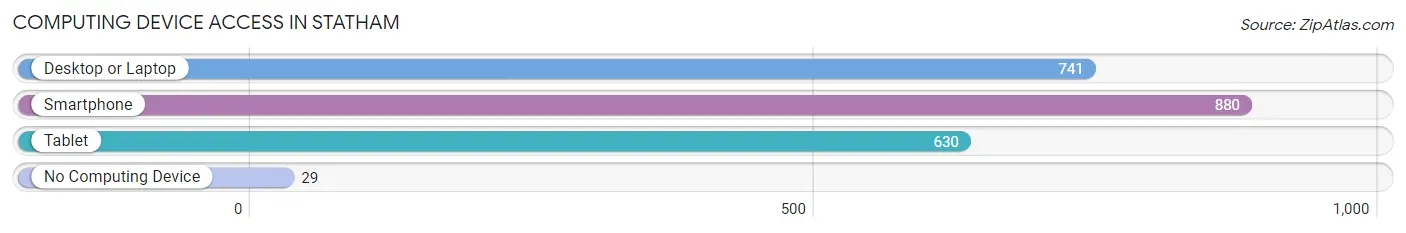
| Device Type | # Households | % Households |
| Desktop or Laptop | 741 | 79.1% |
| Smartphone | 880 | 93.9% |
| Tablet | 630 | 67.2% |
| No Computing Device | 29 | 3.1% |
| Total | 937 | 100.0% |
Internet Access in Statham
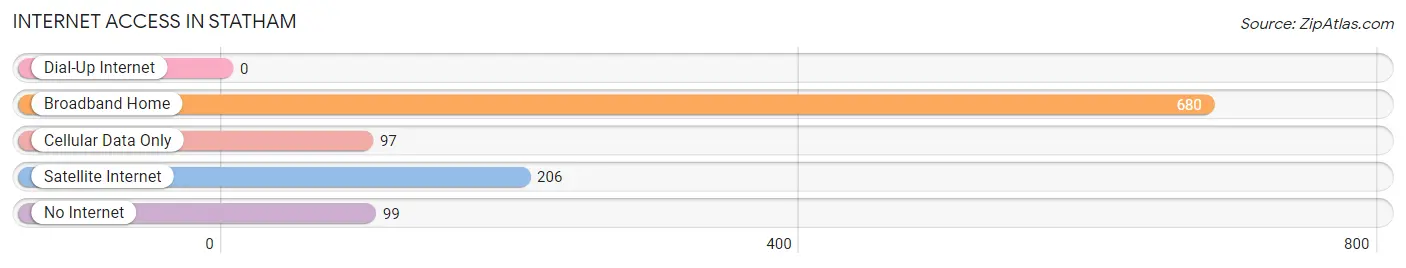
| Internet Type | # Households | % Households |
| Dial-Up Internet | 0 | 0.0% |
| Broadband Home | 680 | 72.6% |
| Cellular Data Only | 97 | 10.3% |
| Satellite Internet | 206 | 22.0% |
| No Internet | 99 | 10.6% |
| Total | 937 | 100.0% |
Statham Summary
Statham, Georgia is a small city located in Barrow County, Georgia, United States. It is part of the Atlanta metropolitan area and is located about 40 miles northeast of downtown Atlanta. The population of Statham was 1,845 at the 2010 census.
History
Statham was founded in 1882 by William Statham, a former Confederate soldier. The town was originally called Stathamville, but the name was changed to Statham in 1883. The town was incorporated in 1906.
Statham was a rural farming community until the 1950s, when the town began to experience growth due to the expansion of the Atlanta metropolitan area. The town was home to several small businesses, including a cotton gin, a sawmill, and a grist mill.
Geography
Statham is located in Barrow County, Georgia, at 33°58'N, 83°45'W (33.967, -83.750). The city is situated in the foothills of the Appalachian Mountains, about 40 miles northeast of downtown Atlanta. The city has a total area of 2.2 square miles, all of which is land.
Economy
Statham's economy is largely based on agriculture and manufacturing. The city is home to several small businesses, including a cotton gin, a sawmill, and a grist mill. The city is also home to several industrial parks, which provide employment opportunities for local residents.
Demographics
As of the 2010 census, there were 1,845 people, 717 households, and 486 families residing in Statham. The population density was 837.5 people per square mile. The racial makeup of the city was 79.2% White, 15.3% African American, 0.2% Native American, 0.7% Asian, 0.1% Pacific Islander, 2.3% from other races, and 2.4% from two or more races. Hispanic or Latino of any race were 4.2% of the population.
The median income for a household in Statham was $41,250, and the median income for a family was $50,000. The per capita income for the city was $20,945. About 11.2% of families and 14.2% of the population were below the poverty line, including 18.2% of those under age 18 and 8.3% of those age 65 or over.
Statham is a small city with a rich history and a diverse population. The city is home to several small businesses and industrial parks, providing employment opportunities for local residents. The city is also home to a variety of recreational activities, including fishing, camping, and hiking. Statham is a great place to live and work, and is a great place to call home.
Common Questions
What is Per Capita Income in Statham?
Per Capita income in Statham is $27,240.
What is the Median Family Income in Statham?
Median Family Income in Statham is $63,361.
What is the Median Household income in Statham?
Median Household Income in Statham is $62,441.
What is Income or Wage Gap in Statham?
Income or Wage Gap in Statham is 12.7%.
Women in Statham earn 87.3 cents for every dollar earned by a man.
What is Inequality or Gini Index in Statham?
Inequality or Gini Index in Statham is 0.41.
What is the Total Population of Statham?
Total Population of Statham is 2,829.
What is the Total Male Population of Statham?
Total Male Population of Statham is 1,300.
What is the Total Female Population of Statham?
Total Female Population of Statham is 1,529.
What is the Ratio of Males per 100 Females in Statham?
There are 85.02 Males per 100 Females in Statham.
What is the Ratio of Females per 100 Males in Statham?
There are 117.62 Females per 100 Males in Statham.
What is the Median Population Age in Statham?
Median Population Age in Statham is 34.1 Years.
What is the Average Family Size in Statham
Average Family Size in Statham is 3.2 People.
What is the Average Household Size in Statham
Average Household Size in Statham is 3.0 People.
How Large is the Labor Force in Statham?
There are 1,708 People in the Labor Forcein in Statham.
What is the Percentage of People in the Labor Force in Statham?
76.2% of People are in the Labor Force in Statham.
What is the Unemployment Rate in Statham?
Unemployment Rate in Statham is 4.2%.