Kingston, GA Map & Demographics
Kingston Map
Kingston Overview
$20,525
PER CAPITA INCOME
$48,750
AVG FAMILY INCOME
$50,000
AVG HOUSEHOLD INCOME
66.6%
WAGE / INCOME GAP [ % ]
33.4¢/ $1
WAGE / INCOME GAP [ $ ]
0.45
INEQUALITY / GINI INDEX
774
TOTAL POPULATION
318
MALE POPULATION
456
FEMALE POPULATION
69.74
MALES / 100 FEMALES
143.40
FEMALES / 100 MALES
43.3
MEDIAN AGE
3.9
AVG FAMILY SIZE
2.8
AVG HOUSEHOLD SIZE
389
LABOR FORCE [ PEOPLE ]
60.9%
PERCENT IN LABOR FORCE
9.0%
UNEMPLOYMENT RATE
Kingston Zip Codes
Income in Kingston
Income Overview in Kingston
Per Capita Income in Kingston is $20,525, while median incomes of families and households are $48,750 and $50,000 respectively.
| Characteristic | Number | Measure |
| Per Capita Income | 774 | $20,525 |
| Median Family Income | 159 | $48,750 |
| Mean Family Income | 159 | $66,626 |
| Median Household Income | 276 | $50,000 |
| Mean Household Income | 276 | $54,956 |
| Income Deficit | 159 | $0 |
| Wage / Income Gap (%) | 774 | 66.56% |
| Wage / Income Gap ($) | 774 | 33.44¢ per $1 |
| Gini / Inequality Index | 774 | 0.45 |
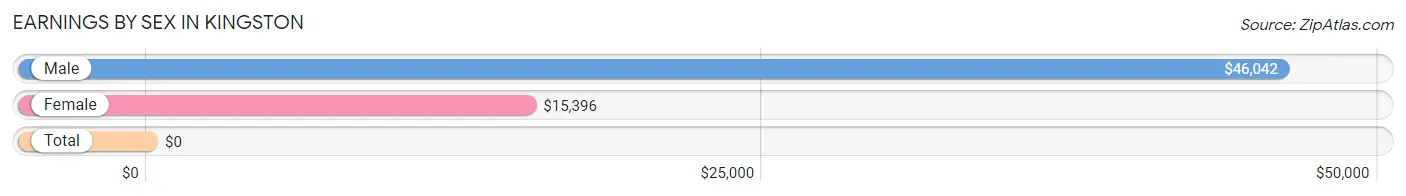
Earnings by Sex in Kingston
| Sex | Number | Average Earnings |
| Male | 177 (45.4%) | $46,042 |
| Female | 213 (54.6%) | $15,396 |
| Total | 390 (100.0%) | $0 |
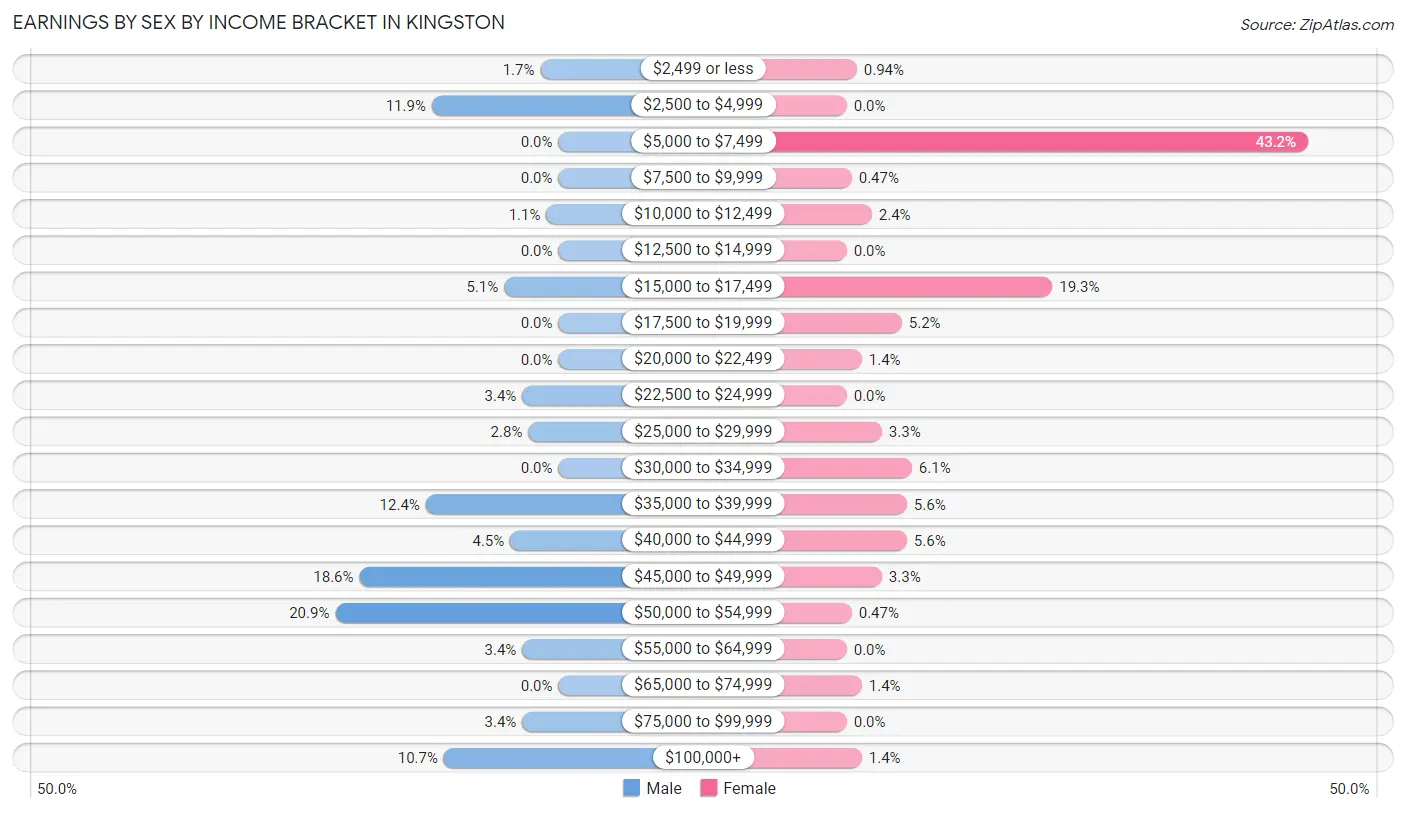
Earnings by Sex by Income Bracket in Kingston
The most common earnings brackets in Kingston are $50,000 to $54,999 for men (37 | 20.9%) and $5,000 to $7,499 for women (92 | 43.2%).
| Income | Male | Female |
| $2,499 or less | 3 (1.7%) | 2 (0.9%) |
| $2,500 to $4,999 | 21 (11.9%) | 0 (0.0%) |
| $5,000 to $7,499 | 0 (0.0%) | 92 (43.2%) |
| $7,500 to $9,999 | 0 (0.0%) | 1 (0.5%) |
| $10,000 to $12,499 | 2 (1.1%) | 5 (2.4%) |
| $12,500 to $14,999 | 0 (0.0%) | 0 (0.0%) |
| $15,000 to $17,499 | 9 (5.1%) | 41 (19.3%) |
| $17,500 to $19,999 | 0 (0.0%) | 11 (5.2%) |
| $20,000 to $22,499 | 0 (0.0%) | 3 (1.4%) |
| $22,500 to $24,999 | 6 (3.4%) | 0 (0.0%) |
| $25,000 to $29,999 | 5 (2.8%) | 7 (3.3%) |
| $30,000 to $34,999 | 0 (0.0%) | 13 (6.1%) |
| $35,000 to $39,999 | 22 (12.4%) | 12 (5.6%) |
| $40,000 to $44,999 | 8 (4.5%) | 12 (5.6%) |
| $45,000 to $49,999 | 33 (18.6%) | 7 (3.3%) |
| $50,000 to $54,999 | 37 (20.9%) | 1 (0.5%) |
| $55,000 to $64,999 | 6 (3.4%) | 0 (0.0%) |
| $65,000 to $74,999 | 0 (0.0%) | 3 (1.4%) |
| $75,000 to $99,999 | 6 (3.4%) | 0 (0.0%) |
| $100,000+ | 19 (10.7%) | 3 (1.4%) |
| Total | 177 (100.0%) | 213 (100.0%) |
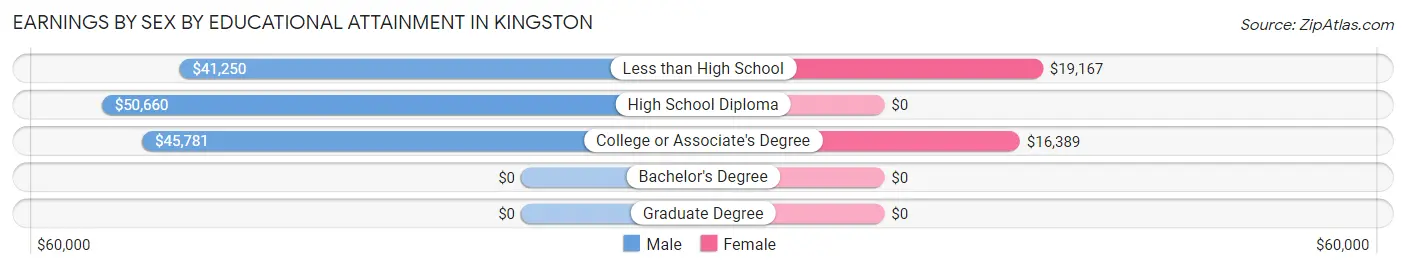
Earnings by Sex by Educational Attainment in Kingston
| Educational Attainment | Male Income | Female Income |
| Less than High School | $41,250 | $19,167 |
| High School Diploma | $50,660 | $0 |
| College or Associate's Degree | $45,781 | $16,389 |
| Bachelor's Degree | - | - |
| Graduate Degree | - | - |
| Total | $47,500 | $0 |
Family Income in Kingston
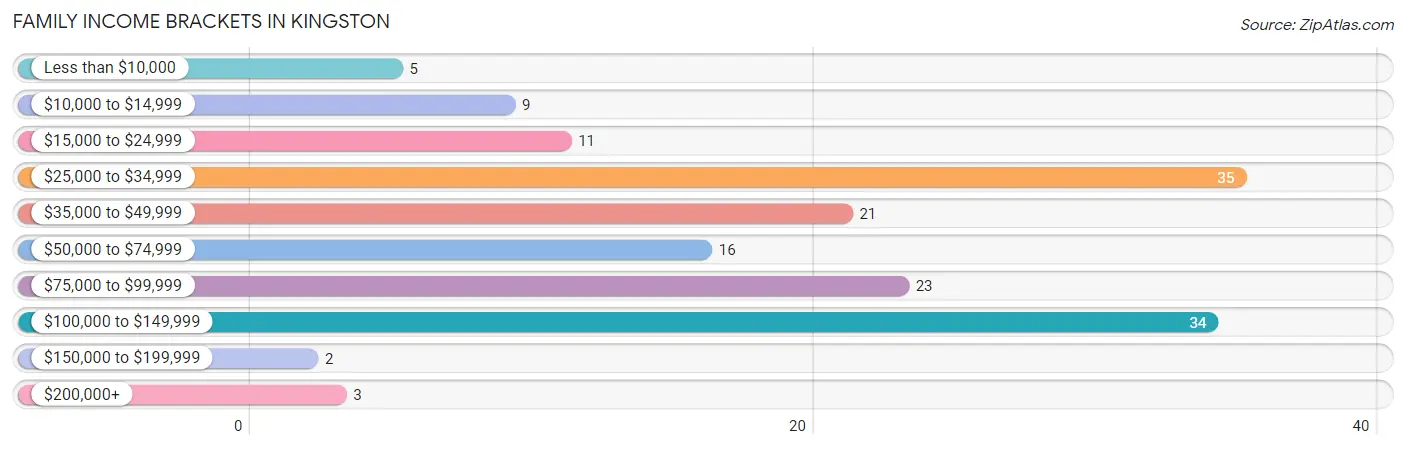
Family Income Brackets in Kingston
According to the Kingston family income data, there are 35 families falling into the $25,000 to $34,999 income range, which is the most common income bracket and makes up 22.0% of all families. Conversely, the $150,000 to $199,999 income bracket is the least frequent group with only 2 families (1.3%) belonging to this category.
| Income Bracket | # Families | % Families |
| Less than $10,000 | 5 | 3.1% |
| $10,000 to $14,999 | 9 | 5.7% |
| $15,000 to $24,999 | 11 | 6.9% |
| $25,000 to $34,999 | 35 | 22.0% |
| $35,000 to $49,999 | 21 | 13.2% |
| $50,000 to $74,999 | 16 | 10.1% |
| $75,000 to $99,999 | 23 | 14.5% |
| $100,000 to $149,999 | 34 | 21.4% |
| $150,000 to $199,999 | 2 | 1.3% |
| $200,000+ | 3 | 1.9% |
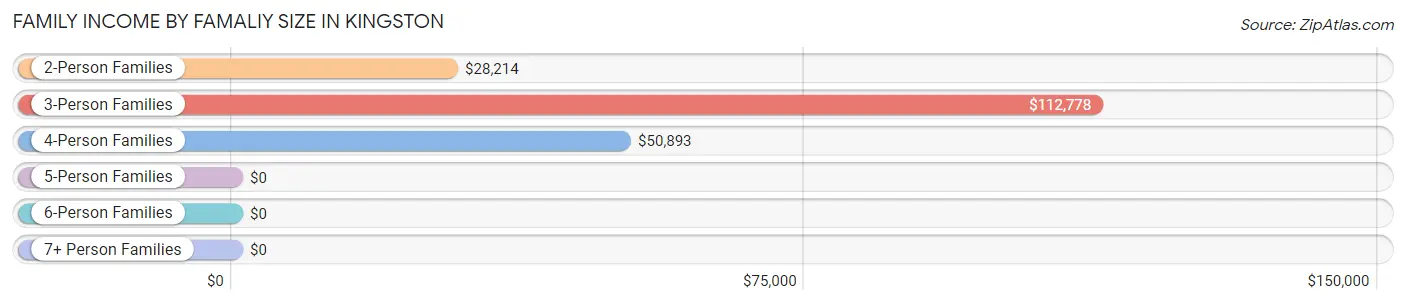
Family Income by Famaliy Size in Kingston
3-person families (60 | 37.7%) account for the highest median family income in Kingston with $112,778 per family, while 3-person families (60 | 37.7%) have the highest median income of $37,593 per family member.
| Income Bracket | # Families | Median Income |
| 2-Person Families | 56 (35.2%) | $28,214 |
| 3-Person Families | 60 (37.7%) | $112,778 |
| 4-Person Families | 15 (9.4%) | $50,893 |
| 5-Person Families | 15 (9.4%) | $0 |
| 6-Person Families | 11 (6.9%) | $0 |
| 7+ Person Families | 2 (1.3%) | $0 |
| Total | 159 (100.0%) | $48,750 |
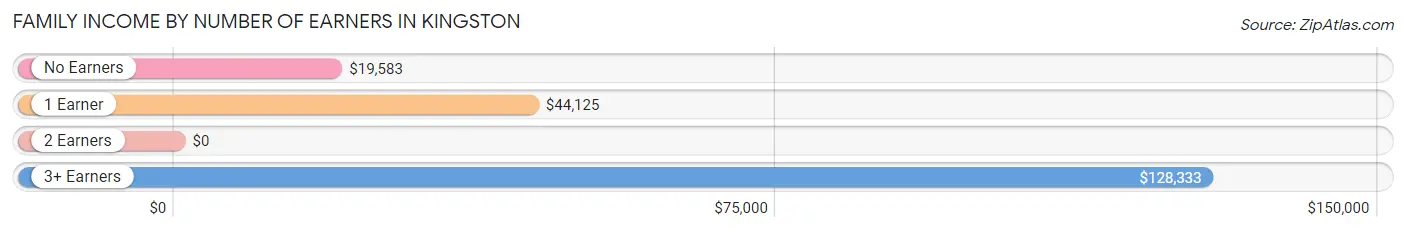
Family Income by Number of Earners in Kingston
| Number of Earners | # Families | Median Income |
| No Earners | 38 (23.9%) | $19,583 |
| 1 Earner | 39 (24.5%) | $44,125 |
| 2 Earners | 42 (26.4%) | $0 |
| 3+ Earners | 40 (25.2%) | $128,333 |
| Total | 159 (100.0%) | $48,750 |
Household Income in Kingston
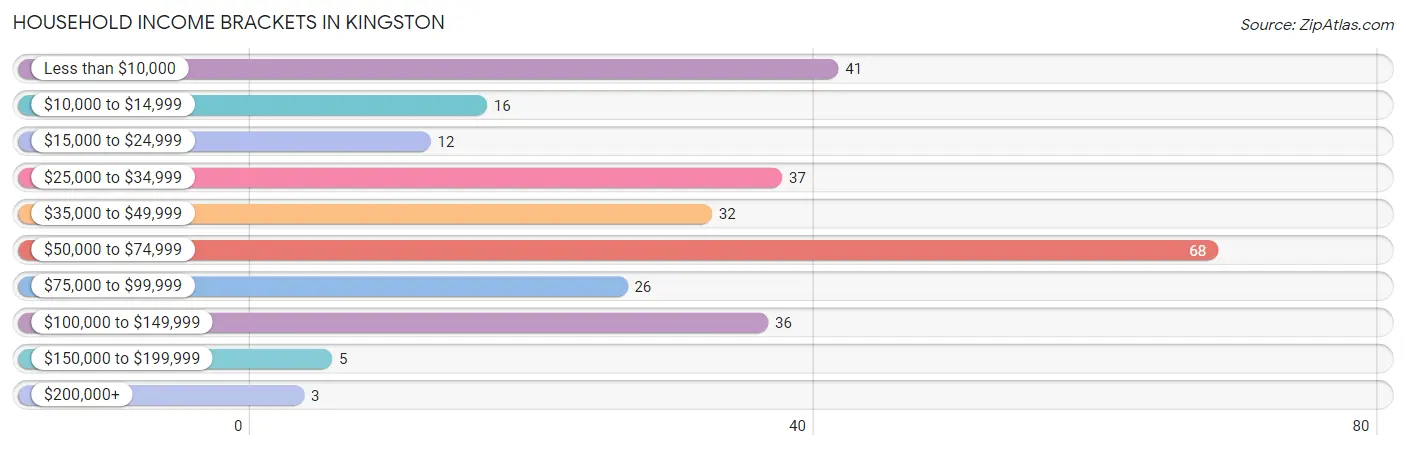
Household Income Brackets in Kingston
With 68 households falling in the category, the $50,000 to $74,999 income range is the most frequent in Kingston, accounting for 24.6% of all households. In contrast, only 3 households (1.1%) fall into the $200,000+ income bracket, making it the least populous group.
| Income Bracket | # Households | % Households |
| Less than $10,000 | 41 | 14.9% |
| $10,000 to $14,999 | 16 | 5.8% |
| $15,000 to $24,999 | 12 | 4.3% |
| $25,000 to $34,999 | 37 | 13.4% |
| $35,000 to $49,999 | 32 | 11.6% |
| $50,000 to $74,999 | 68 | 24.6% |
| $75,000 to $99,999 | 26 | 9.4% |
| $100,000 to $149,999 | 36 | 13.0% |
| $150,000 to $199,999 | 5 | 1.8% |
| $200,000+ | 3 | 1.1% |
Household Income by Householder Age in Kingston
The median household income in Kingston is $50,000, with the highest median household income of $107,917 found in the 25 to 44 years age bracket for the primary householder. A total of 41 households (14.9%) fall into this category. Meanwhile, the 15 to 24 years age bracket for the primary householder has the lowest median household income of $0, with 34 households (12.3%) in this group.
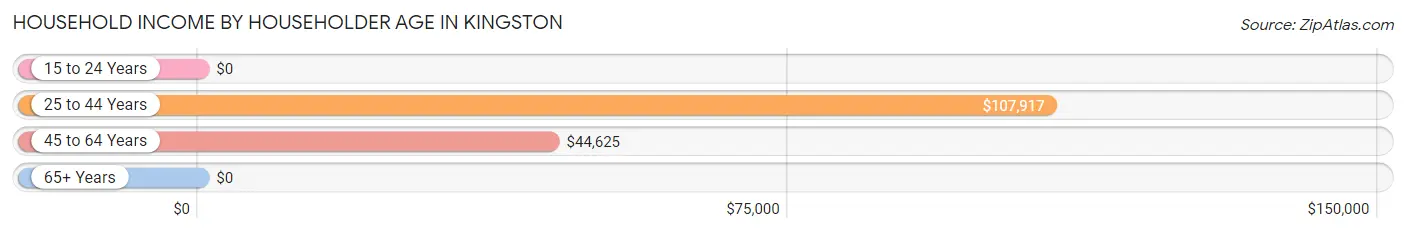
| Income Bracket | # Households | Median Income |
| 15 to 24 Years | 34 (12.3%) | $0 |
| 25 to 44 Years | 41 (14.9%) | $107,917 |
| 45 to 64 Years | 159 (57.6%) | $44,625 |
| 65+ Years | 42 (15.2%) | $0 |
| Total | 276 (100.0%) | $50,000 |
Poverty in Kingston
Income Below Poverty by Sex and Age in Kingston
With 15.6% poverty level for males and 30.5% for females among the residents of Kingston, 65 to 74 year old males and 15 year old females are the most vulnerable to poverty, with 3 males (33.3%) and 16 females (88.9%) in their respective age groups living below the poverty level.
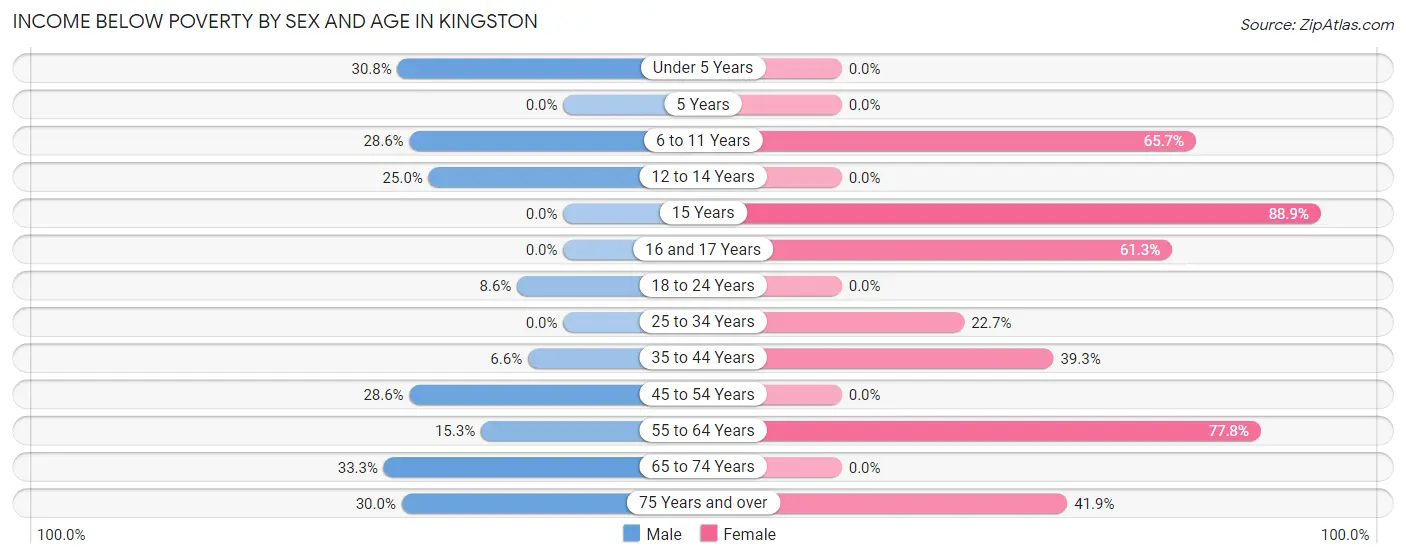
| Age Bracket | Male | Female |
| Under 5 Years | 4 (30.8%) | 0 (0.0%) |
| 5 Years | 0 (0.0%) | 0 (0.0%) |
| 6 to 11 Years | 6 (28.6%) | 23 (65.7%) |
| 12 to 14 Years | 2 (25.0%) | 0 (0.0%) |
| 15 Years | 0 (0.0%) | 16 (88.9%) |
| 16 and 17 Years | 0 (0.0%) | 19 (61.3%) |
| 18 to 24 Years | 3 (8.6%) | 0 (0.0%) |
| 25 to 34 Years | 0 (0.0%) | 10 (22.7%) |
| 35 to 44 Years | 4 (6.6%) | 11 (39.3%) |
| 45 to 54 Years | 8 (28.6%) | 0 (0.0%) |
| 55 to 64 Years | 13 (15.3%) | 42 (77.8%) |
| 65 to 74 Years | 3 (33.3%) | 0 (0.0%) |
| 75 Years and over | 6 (30.0%) | 18 (41.9%) |
| Total | 49 (15.6%) | 139 (30.5%) |
Income Above Poverty by Sex and Age in Kingston
According to the poverty statistics in Kingston, males aged 5 years and females aged under 5 years are the age groups that are most secure financially, with 100.0% of males and 100.0% of females in these age groups living above the poverty line.
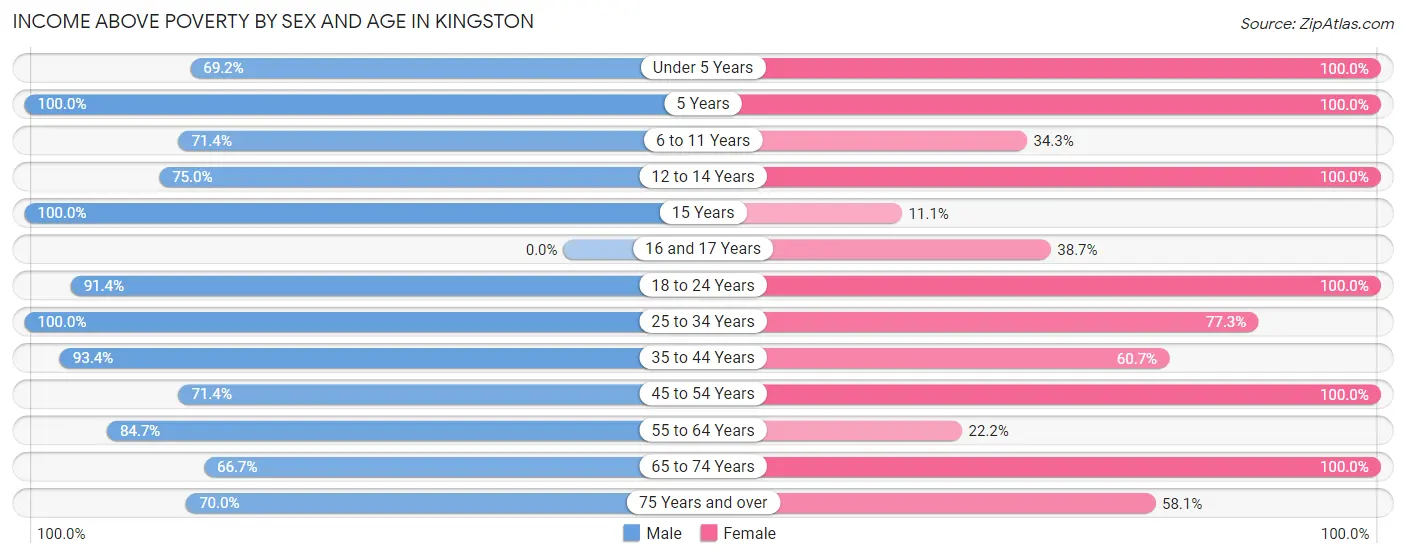
| Age Bracket | Male | Female |
| Under 5 Years | 9 (69.2%) | 18 (100.0%) |
| 5 Years | 3 (100.0%) | 6 (100.0%) |
| 6 to 11 Years | 15 (71.4%) | 12 (34.3%) |
| 12 to 14 Years | 6 (75.0%) | 8 (100.0%) |
| 15 Years | 2 (100.0%) | 2 (11.1%) |
| 16 and 17 Years | 0 (0.0%) | 12 (38.7%) |
| 18 to 24 Years | 32 (91.4%) | 37 (100.0%) |
| 25 to 34 Years | 30 (100.0%) | 34 (77.3%) |
| 35 to 44 Years | 57 (93.4%) | 17 (60.7%) |
| 45 to 54 Years | 20 (71.4%) | 117 (100.0%) |
| 55 to 64 Years | 72 (84.7%) | 12 (22.2%) |
| 65 to 74 Years | 6 (66.7%) | 17 (100.0%) |
| 75 Years and over | 14 (70.0%) | 25 (58.1%) |
| Total | 266 (84.4%) | 317 (69.5%) |
Income Below Poverty Among Married-Couple Families in Kingston
The poverty statistics for married-couple families in Kingston show that 7.7% or 8 of the total 104 families live below the poverty line. Families with 3 or 4 children have the highest poverty rate of 47.1%, comprising of 8 families. On the other hand, families with no children have the lowest poverty rate of 0.0%, which includes 0 families.
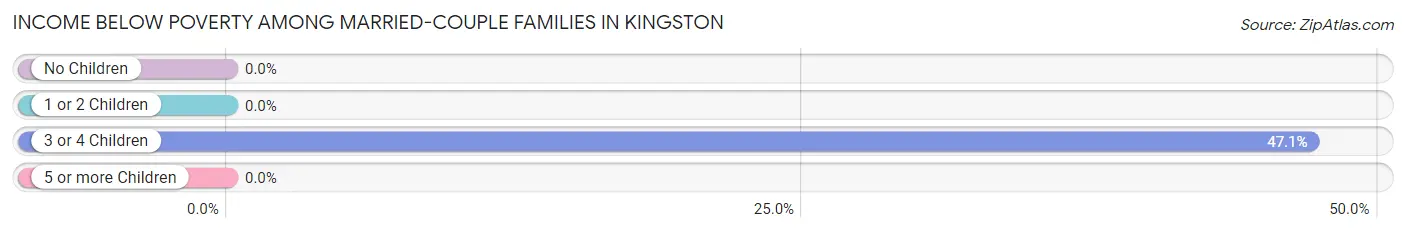
| Children | Above Poverty | Below Poverty |
| No Children | 66 (100.0%) | 0 (0.0%) |
| 1 or 2 Children | 19 (100.0%) | 0 (0.0%) |
| 3 or 4 Children | 9 (52.9%) | 8 (47.1%) |
| 5 or more Children | 2 (100.0%) | 0 (0.0%) |
| Total | 96 (92.3%) | 8 (7.7%) |
Income Below Poverty Among Single-Parent Households in Kingston
According to the poverty data in Kingston, 29.6% or 8 single-father households and 53.6% or 15 single-mother households are living below the poverty line. Among single-father households, those with no children have the highest poverty rate, with 8 households (33.3%) experiencing poverty. Likewise, among single-mother households, those with 3 or 4 children have the highest poverty rate, with 3 households (100.0%) falling below the poverty line.
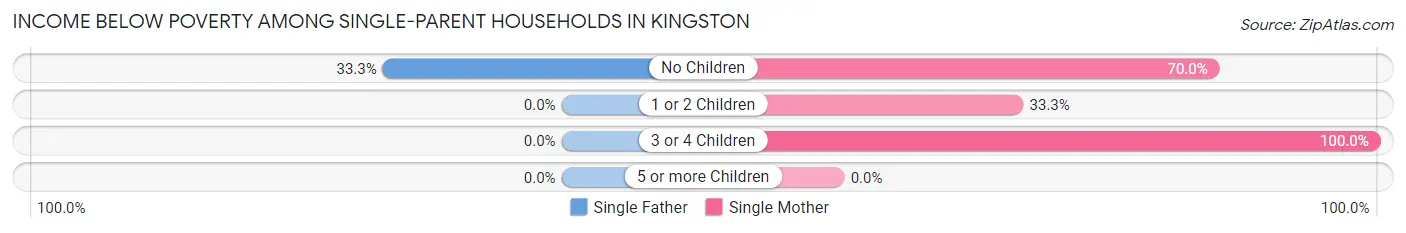
| Children | Single Father | Single Mother |
| No Children | 8 (33.3%) | 7 (70.0%) |
| 1 or 2 Children | 0 (0.0%) | 5 (33.3%) |
| 3 or 4 Children | 0 (0.0%) | 3 (100.0%) |
| 5 or more Children | 0 (0.0%) | 0 (0.0%) |
| Total | 8 (29.6%) | 15 (53.6%) |
Income Below Poverty Among Married-Couple vs Single-Parent Households in Kingston
The poverty data for Kingston shows that 8 of the married-couple family households (7.7%) and 23 of the single-parent households (41.8%) are living below the poverty level. Within the married-couple family households, those with 3 or 4 children have the highest poverty rate, with 8 households (47.1%) falling below the poverty line. Among the single-parent households, those with 3 or 4 children have the highest poverty rate, with 3 household (100.0%) living below poverty.
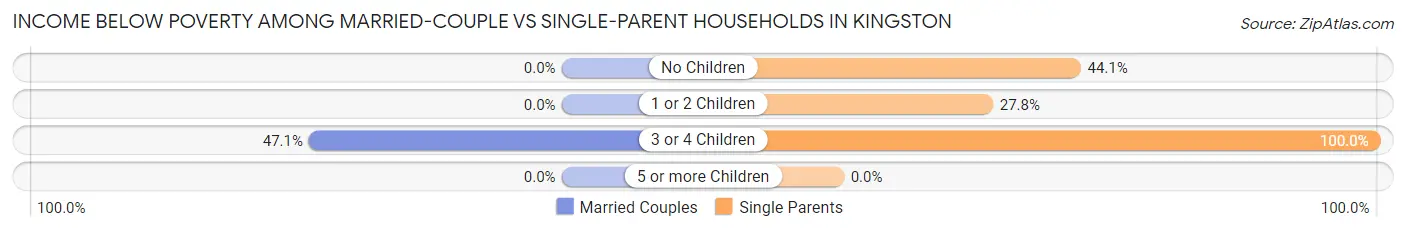
| Children | Married-Couple Families | Single-Parent Households |
| No Children | 0 (0.0%) | 15 (44.1%) |
| 1 or 2 Children | 0 (0.0%) | 5 (27.8%) |
| 3 or 4 Children | 8 (47.1%) | 3 (100.0%) |
| 5 or more Children | 0 (0.0%) | 0 (0.0%) |
| Total | 8 (7.7%) | 23 (41.8%) |
Race in Kingston
The most populous races in Kingston are White / Caucasian (454 | 58.7%), Black / African American (222 | 28.7%), and Two or more Races (79 | 10.2%).
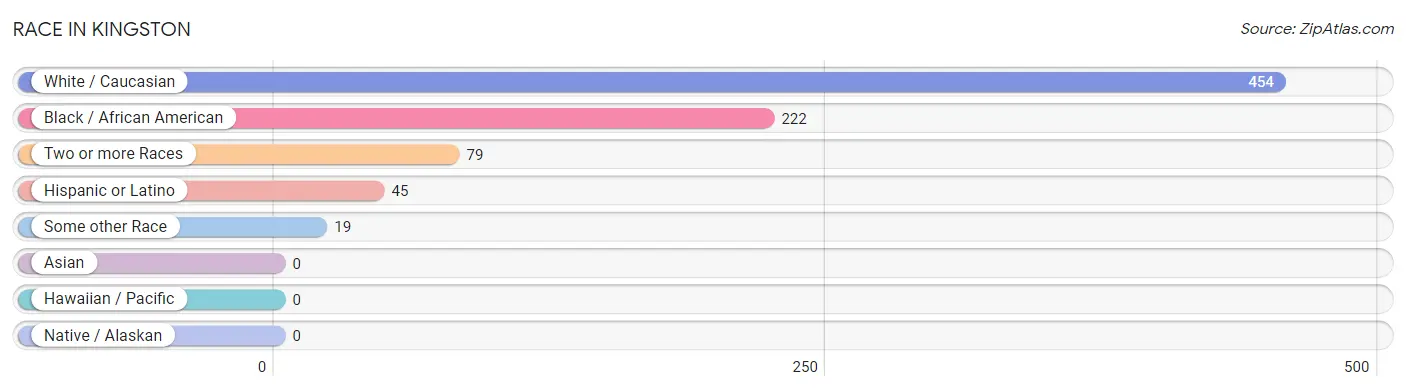
| Race | # Population | % Population |
| Asian | 0 | 0.0% |
| Black / African American | 222 | 28.7% |
| Hawaiian / Pacific | 0 | 0.0% |
| Hispanic or Latino | 45 | 5.8% |
| Native / Alaskan | 0 | 0.0% |
| White / Caucasian | 454 | 58.7% |
| Two or more Races | 79 | 10.2% |
| Some other Race | 19 | 2.5% |
| Total | 774 | 100.0% |
Ancestry in Kingston
The most populous ancestries reported in Kingston are Irish (141 | 18.2%), American (127 | 16.4%), German (123 | 15.9%), Blackfeet (37 | 4.8%), and Puerto Rican (30 | 3.9%), together accounting for 59.2% of all Kingston residents.
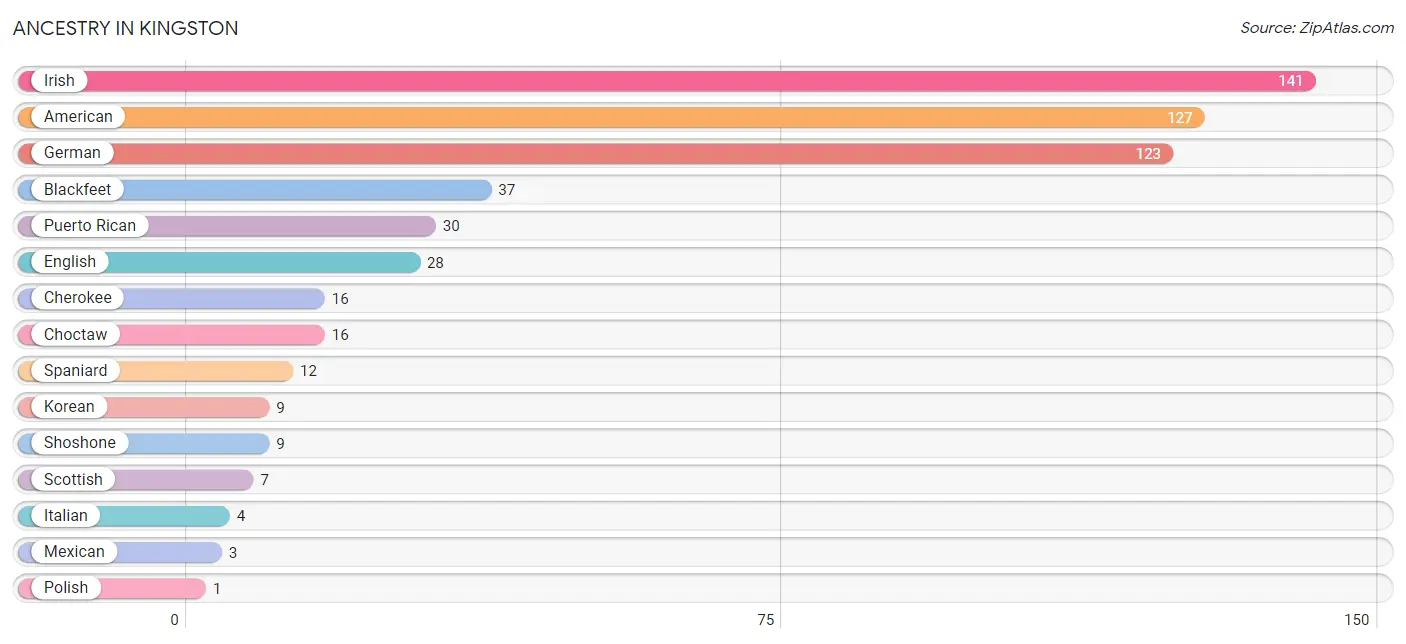
| Ancestry | # Population | % Population |
| American | 127 | 16.4% |
| Blackfeet | 37 | 4.8% |
| Cherokee | 16 | 2.1% |
| Choctaw | 16 | 2.1% |
| English | 28 | 3.6% |
| German | 123 | 15.9% |
| Irish | 141 | 18.2% |
| Italian | 4 | 0.5% |
| Korean | 9 | 1.2% |
| Mexican | 3 | 0.4% |
| Polish | 1 | 0.1% |
| Puerto Rican | 30 | 3.9% |
| Scottish | 7 | 0.9% |
| Shoshone | 9 | 1.2% |
| Spaniard | 12 | 1.5% | View All 15 Rows |
Immigrants in Kingston

| Immigration Origin | # Population | % Population | View All 0 Rows |
Sex and Age in Kingston
Sex and Age in Kingston
The most populous age groups in Kingston are 55 to 59 Years (63 | 19.8%) for men and 45 to 49 Years (92 | 20.2%) for women.
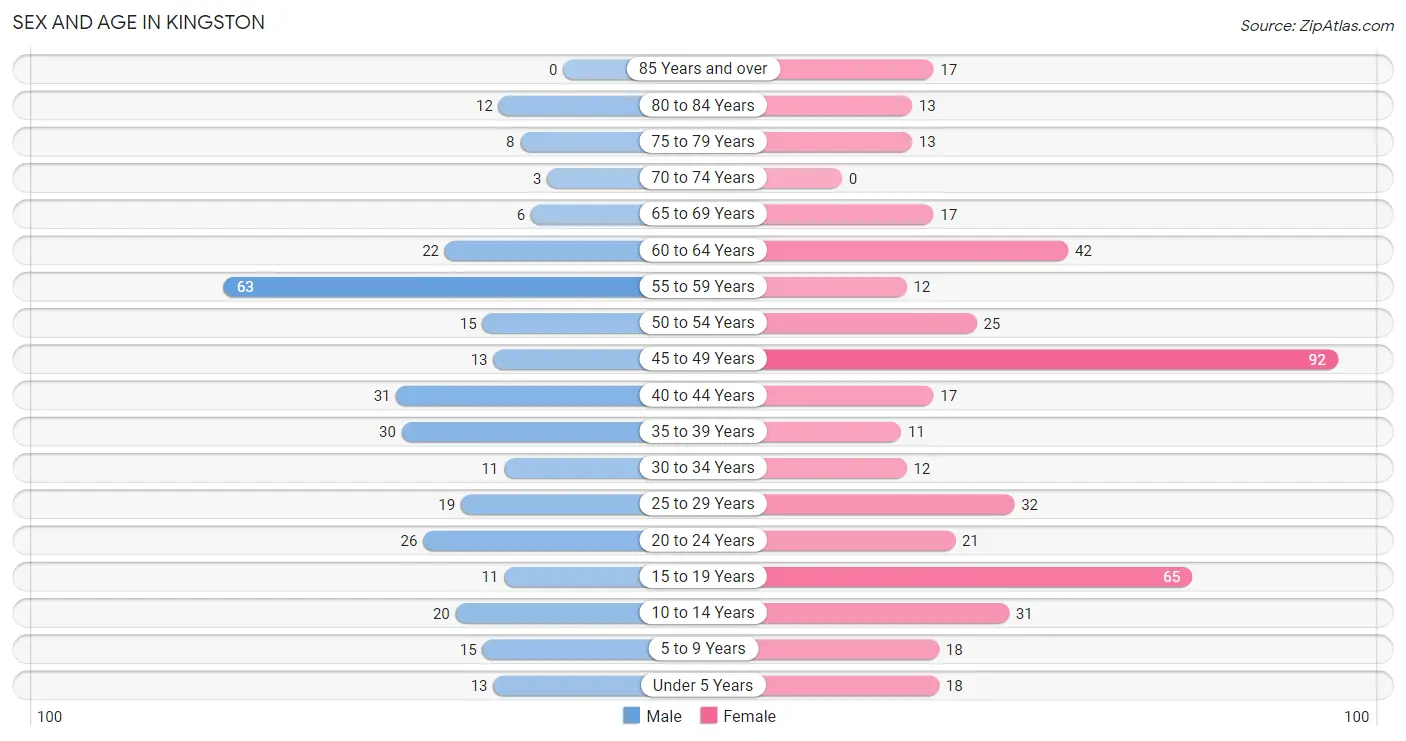
| Age Bracket | Male | Female |
| Under 5 Years | 13 (4.1%) | 18 (4.0%) |
| 5 to 9 Years | 15 (4.7%) | 18 (4.0%) |
| 10 to 14 Years | 20 (6.3%) | 31 (6.8%) |
| 15 to 19 Years | 11 (3.5%) | 65 (14.2%) |
| 20 to 24 Years | 26 (8.2%) | 21 (4.6%) |
| 25 to 29 Years | 19 (6.0%) | 32 (7.0%) |
| 30 to 34 Years | 11 (3.5%) | 12 (2.6%) |
| 35 to 39 Years | 30 (9.4%) | 11 (2.4%) |
| 40 to 44 Years | 31 (9.8%) | 17 (3.7%) |
| 45 to 49 Years | 13 (4.1%) | 92 (20.2%) |
| 50 to 54 Years | 15 (4.7%) | 25 (5.5%) |
| 55 to 59 Years | 63 (19.8%) | 12 (2.6%) |
| 60 to 64 Years | 22 (6.9%) | 42 (9.2%) |
| 65 to 69 Years | 6 (1.9%) | 17 (3.7%) |
| 70 to 74 Years | 3 (0.9%) | 0 (0.0%) |
| 75 to 79 Years | 8 (2.5%) | 13 (2.9%) |
| 80 to 84 Years | 12 (3.8%) | 13 (2.9%) |
| 85 Years and over | 0 (0.0%) | 17 (3.7%) |
| Total | 318 (100.0%) | 456 (100.0%) |
Families and Households in Kingston
Median Family Size in Kingston
The median family size in Kingston is 3.86 persons per family, with single male/father families (27 | 17.0%) accounting for the largest median family size of 5.44 persons per family. On the other hand, single female/mother families (28 | 17.6%) represent the smallest median family size with 3.29 persons per family.
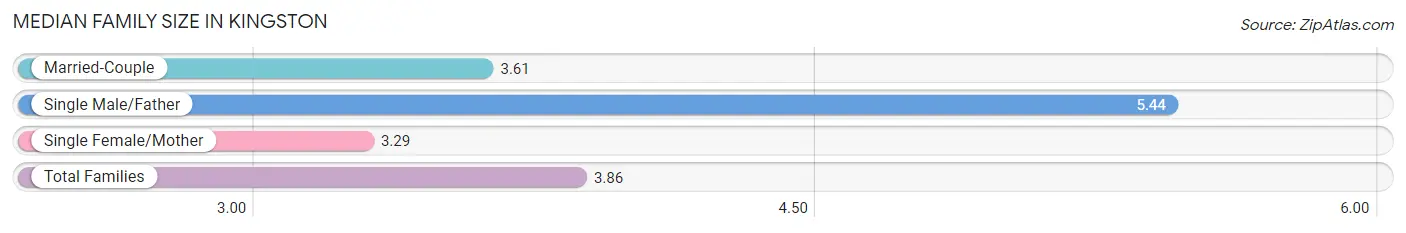
| Family Type | # Families | Family Size |
| Married-Couple | 104 (65.4%) | 3.61 |
| Single Male/Father | 27 (17.0%) | 5.44 |
| Single Female/Mother | 28 (17.6%) | 3.29 |
| Total Families | 159 (100.0%) | 3.86 |
Median Household Size in Kingston
The median household size in Kingston is 2.80 persons per household, with single male/father households (27 | 9.8%) accounting for the largest median household size of 5.44 persons per household. non-family households (117 | 42.4%) represent the smallest median household size with 1.22 persons per household.
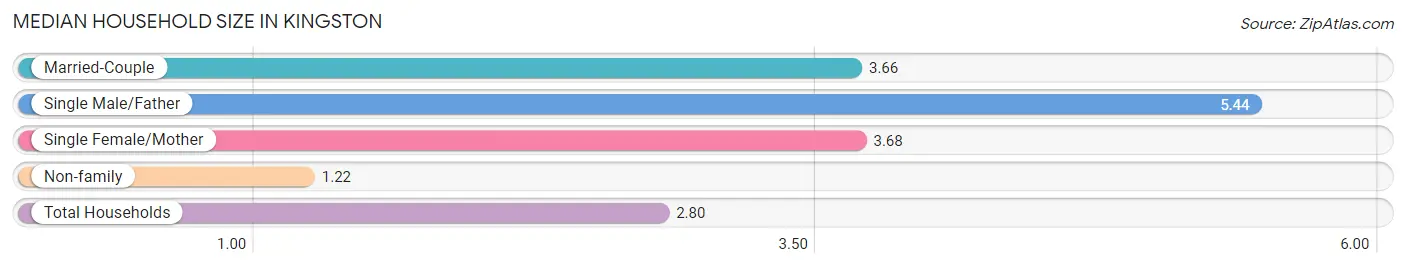
| Household Type | # Households | Household Size |
| Married-Couple | 104 (37.7%) | 3.66 |
| Single Male/Father | 27 (9.8%) | 5.44 |
| Single Female/Mother | 28 (10.1%) | 3.68 |
| Non-family | 117 (42.4%) | 1.22 |
| Total Households | 276 (100.0%) | 2.80 |
Household Size by Marriage Status in Kingston
Out of a total of 276 households in Kingston, 159 (57.6%) are family households, while 117 (42.4%) are nonfamily households. The most numerous type of family households are 3-person households, comprising 62, and the most common type of nonfamily households are 1-person households, comprising 102.
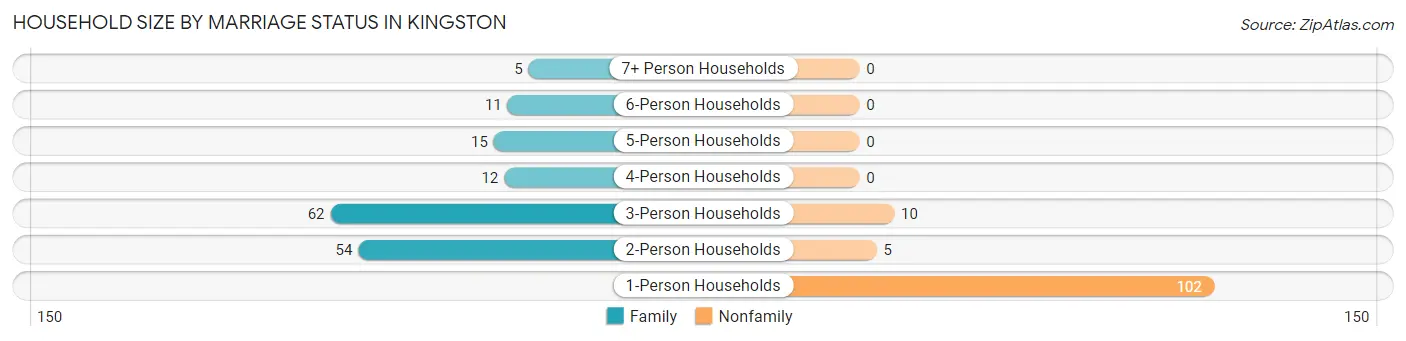
| Household Size | Family Households | Nonfamily Households |
| 1-Person Households | - | 102 (37.0%) |
| 2-Person Households | 54 (19.6%) | 5 (1.8%) |
| 3-Person Households | 62 (22.5%) | 10 (3.6%) |
| 4-Person Households | 12 (4.3%) | 0 (0.0%) |
| 5-Person Households | 15 (5.4%) | 0 (0.0%) |
| 6-Person Households | 11 (4.0%) | 0 (0.0%) |
| 7+ Person Households | 5 (1.8%) | 0 (0.0%) |
| Total | 159 (57.6%) | 117 (42.4%) |
Female Fertility in Kingston
Fertility by Age in Kingston
Average fertility rate in Kingston is 12.0 births per 1,000 women. Women in the age bracket of 35 to 50 years have the highest fertility rate with 25.0 births per 1,000 women. Women in the age bracket of 35 to 50 years acount for 100.0% of all women with births.
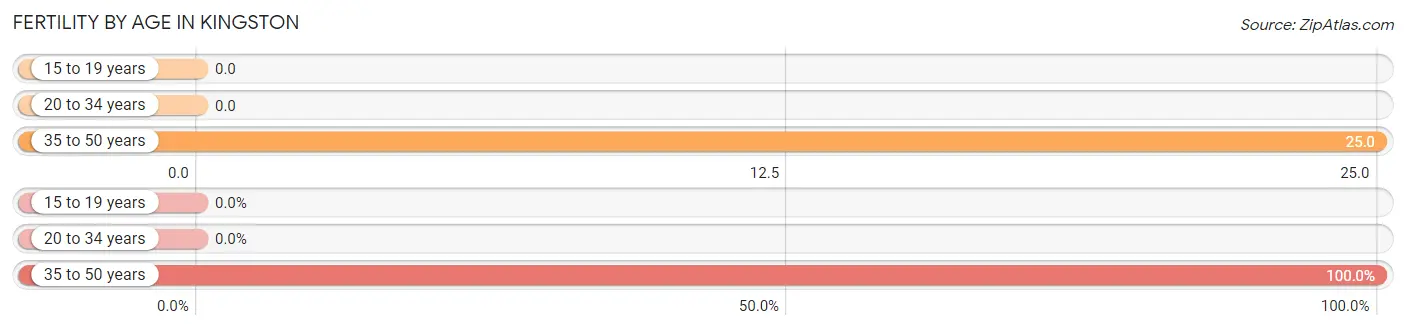
| Age Bracket | Women with Births | Births / 1,000 Women |
| 15 to 19 years | 0 (0.0%) | 0.0 |
| 20 to 34 years | 0 (0.0%) | 0.0 |
| 35 to 50 years | 3 (100.0%) | 25.0 |
| Total | 3 (100.0%) | 12.0 |
Fertility by Age by Marriage Status in Kingston
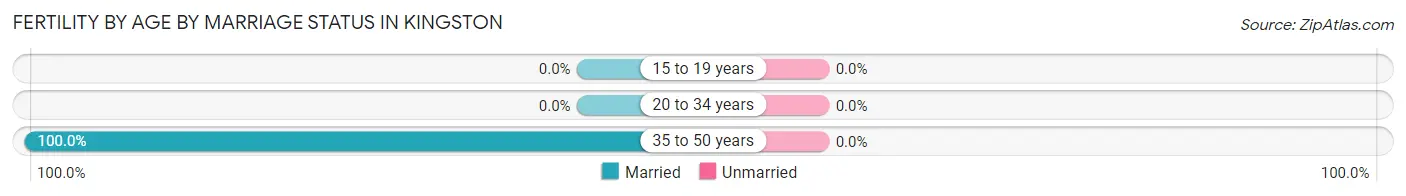
| Age Bracket | Married | Unmarried |
| 15 to 19 years | 0 (0.0%) | 0 (0.0%) |
| 20 to 34 years | 0 (0.0%) | 0 (0.0%) |
| 35 to 50 years | 3 (100.0%) | 0 (0.0%) |
| Total | 3 (100.0%) | 0 (0.0%) |
Fertility by Education in Kingston
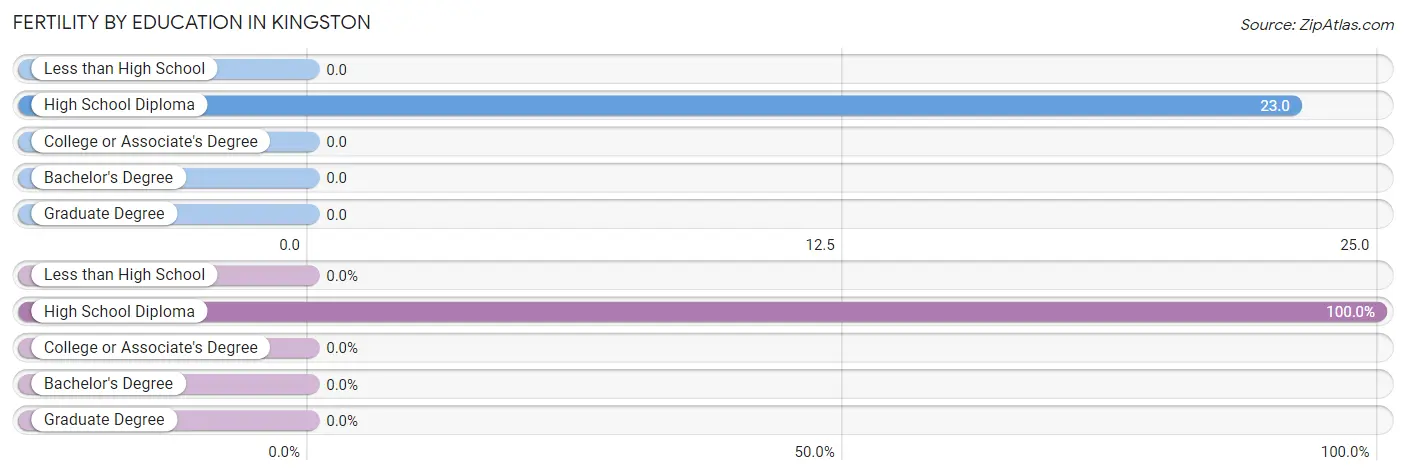
| Educational Attainment | Women with Births | Births / 1,000 Women |
| Less than High School | 0 (0.0%) | 0.0 |
| High School Diploma | 3 (100.0%) | 23.0 |
| College or Associate's Degree | 0 (0.0%) | 0.0 |
| Bachelor's Degree | 0 (0.0%) | 0.0 |
| Graduate Degree | 0 (0.0%) | 0.0 |
| Total | 3 (100.0%) | 12.0 |
Fertility by Education by Marriage Status in Kingston
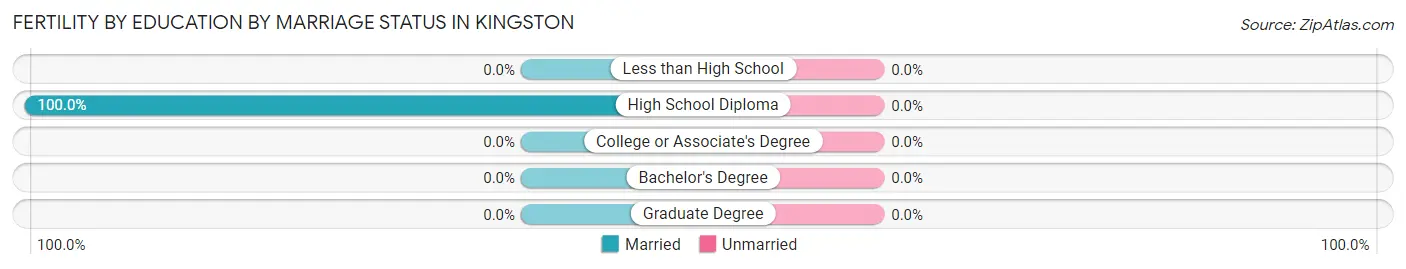
| Educational Attainment | Married | Unmarried |
| Less than High School | 0 (0.0%) | 0 (0.0%) |
| High School Diploma | 3 (100.0%) | 0 (0.0%) |
| College or Associate's Degree | 0 (0.0%) | 0 (0.0%) |
| Bachelor's Degree | 0 (0.0%) | 0 (0.0%) |
| Graduate Degree | 0 (0.0%) | 0 (0.0%) |
| Total | 3 (100.0%) | 0 (0.0%) |
Employment Characteristics in Kingston
Employment by Class of Employer in Kingston
Among the 352 employed individuals in Kingston, private company employees (327 | 92.9%), state government employees (6 | 1.7%), and local government employees (4 | 1.1%) make up the most common classes of employment.
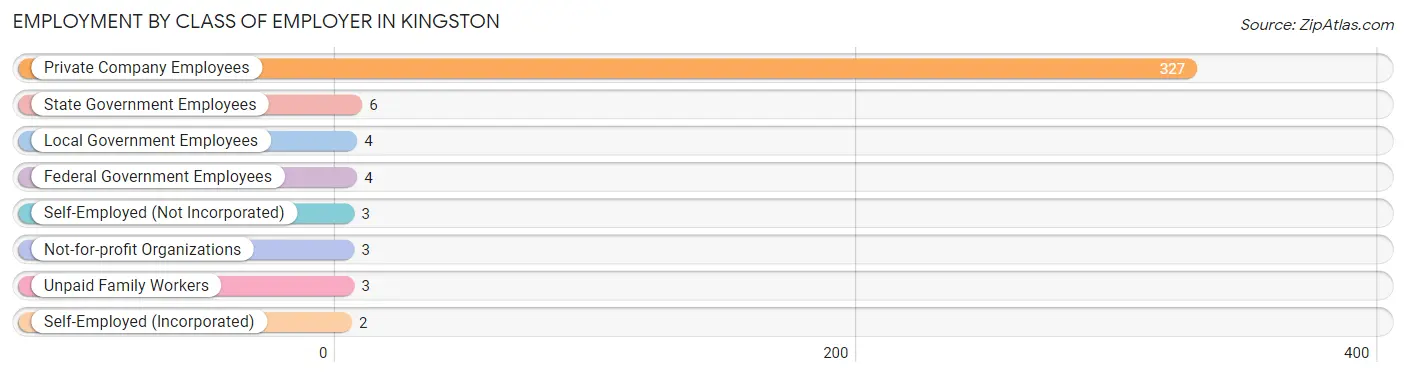
| Employer Class | # Employees | % Employees |
| Private Company Employees | 327 | 92.9% |
| Self-Employed (Incorporated) | 2 | 0.6% |
| Self-Employed (Not Incorporated) | 3 | 0.9% |
| Not-for-profit Organizations | 3 | 0.9% |
| Local Government Employees | 4 | 1.1% |
| State Government Employees | 6 | 1.7% |
| Federal Government Employees | 4 | 1.1% |
| Unpaid Family Workers | 3 | 0.9% |
| Total | 352 | 100.0% |
Employment Status by Age in Kingston
According to the labor force statistics for Kingston, out of the total population over 16 years of age (639), 60.9% or 389 individuals are in the labor force, with 9.0% or 35 of them unemployed. The age group with the highest labor force participation rate is 45 to 54 years, with 82.1% or 119 individuals in the labor force. Within the labor force, the 20 to 24 years age range has the highest percentage of unemployed individuals, with 56.8% or 21 of them being unemployed.
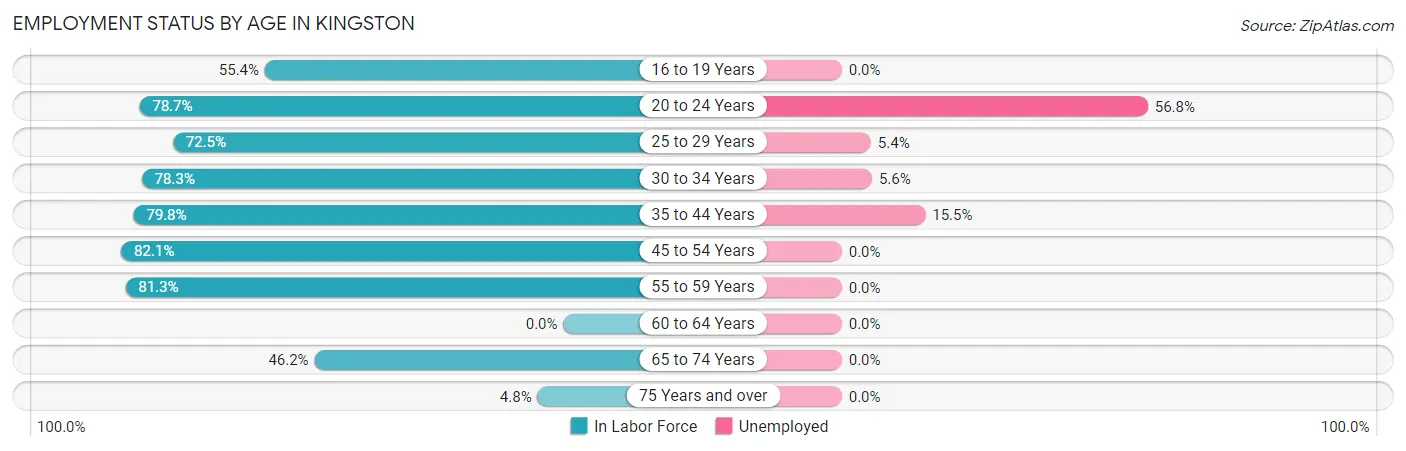
| Age Bracket | In Labor Force | Unemployed |
| 16 to 19 Years | 31 (55.4%) | 0 (0.0%) |
| 20 to 24 Years | 37 (78.7%) | 21 (56.8%) |
| 25 to 29 Years | 37 (72.5%) | 2 (5.4%) |
| 30 to 34 Years | 18 (78.3%) | 1 (5.6%) |
| 35 to 44 Years | 71 (79.8%) | 11 (15.5%) |
| 45 to 54 Years | 119 (82.1%) | 0 (0.0%) |
| 55 to 59 Years | 61 (81.3%) | 0 (0.0%) |
| 60 to 64 Years | 0 (0.0%) | 0 (0.0%) |
| 65 to 74 Years | 12 (46.2%) | 0 (0.0%) |
| 75 Years and over | 3 (4.8%) | 0 (0.0%) |
| Total | 389 (60.9%) | 35 (9.0%) |
Employment Status by Educational Attainment in Kingston
According to labor force statistics for Kingston, 68.5% of individuals (306) out of the total population between 25 and 64 years of age (447) are in the labor force, with 4.6% or 14 of them being unemployed. The group with the highest labor force participation rate are those with the educational attainment of high school diploma, with 80.9% or 207 individuals in the labor force. Within the labor force, individuals with high school diploma education have the highest percentage of unemployment, with 6.3% or 13 of them being unemployed.
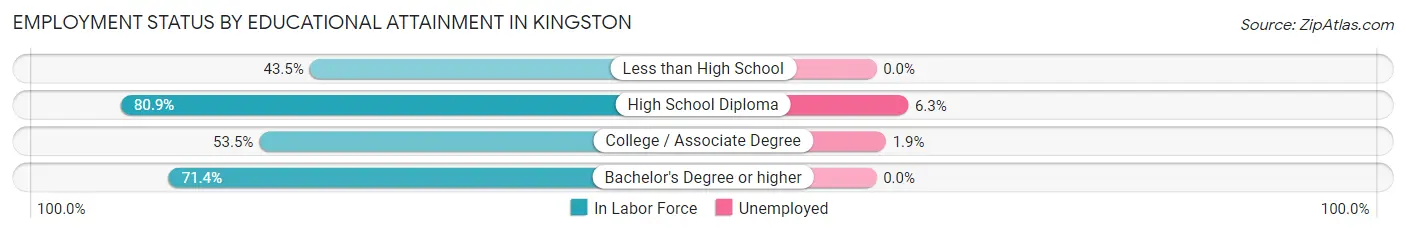
| Educational Attainment | In Labor Force | Unemployed |
| Less than High School | 30 (43.5%) | 0 (0.0%) |
| High School Diploma | 207 (80.9%) | 16 (6.3%) |
| College / Associate Degree | 54 (53.5%) | 2 (1.9%) |
| Bachelor's Degree or higher | 15 (71.4%) | 0 (0.0%) |
| Total | 306 (68.5%) | 21 (4.6%) |
Employment Occupations by Sex in Kingston
Management, Business, Science and Arts Occupations
The most common Management, Business, Science and Arts occupations in Kingston are Management (17 | 4.8%), Community & Social Service (17 | 4.8%), Education Instruction & Library (17 | 4.8%), Computers, Engineering & Science (8 | 2.3%), and Computers & Mathematics (6 | 1.7%).
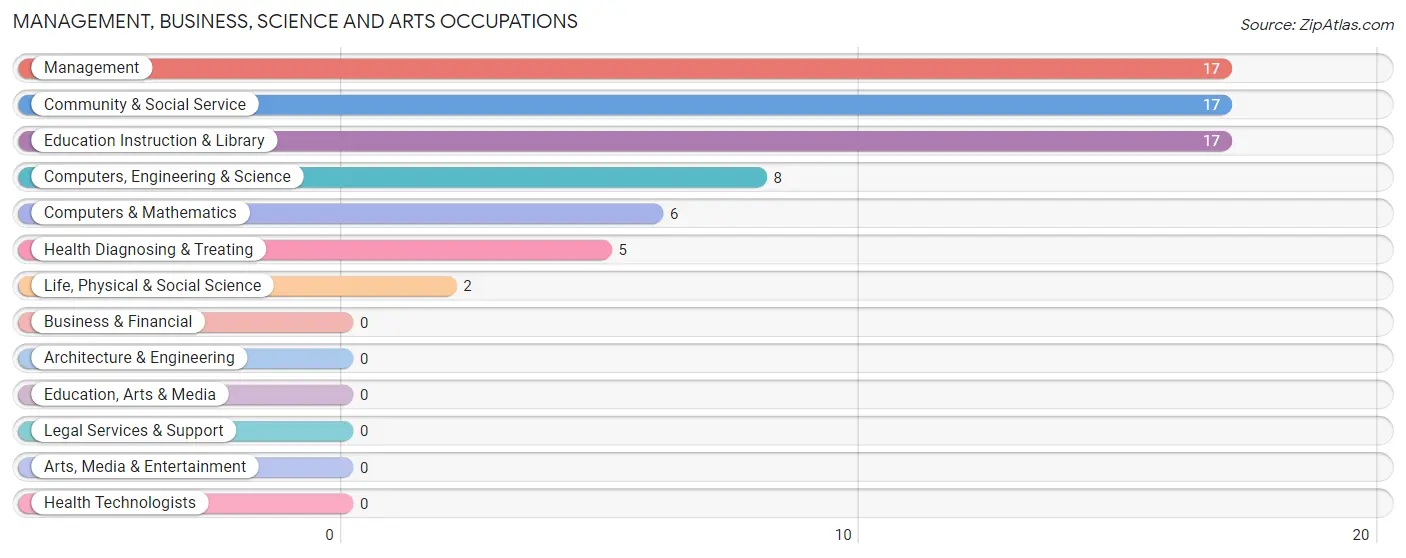
Management, Business, Science and Arts Occupations by Sex
Within the Management, Business, Science and Arts occupations in Kingston, the most male-oriented occupations are Computers, Engineering & Science (100.0%), Computers & Mathematics (100.0%), and Life, Physical & Social Science (100.0%), while the most female-oriented occupations are Management (100.0%), Health Diagnosing & Treating (100.0%), and Community & Social Service (82.4%).
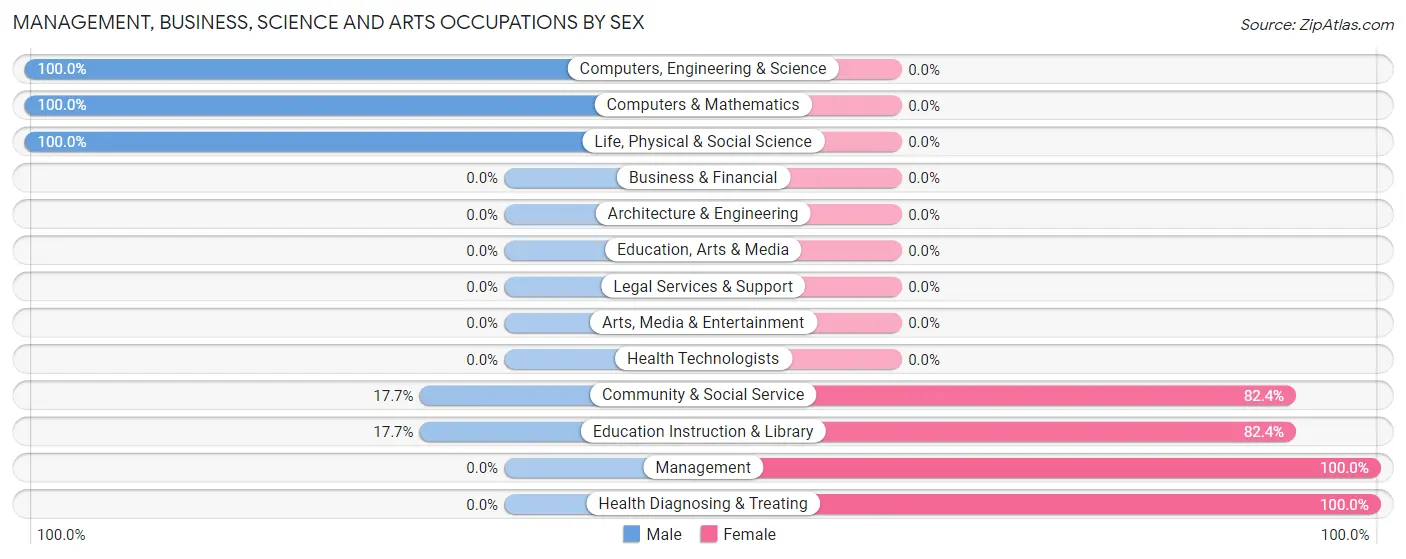
| Occupation | Male | Female |
| Management | 0 (0.0%) | 17 (100.0%) |
| Business & Financial | 0 (0.0%) | 0 (0.0%) |
| Computers, Engineering & Science | 8 (100.0%) | 0 (0.0%) |
| Computers & Mathematics | 6 (100.0%) | 0 (0.0%) |
| Architecture & Engineering | 0 (0.0%) | 0 (0.0%) |
| Life, Physical & Social Science | 2 (100.0%) | 0 (0.0%) |
| Community & Social Service | 3 (17.6%) | 14 (82.4%) |
| Education, Arts & Media | 0 (0.0%) | 0 (0.0%) |
| Legal Services & Support | 0 (0.0%) | 0 (0.0%) |
| Education Instruction & Library | 3 (17.6%) | 14 (82.4%) |
| Arts, Media & Entertainment | 0 (0.0%) | 0 (0.0%) |
| Health Diagnosing & Treating | 0 (0.0%) | 5 (100.0%) |
| Health Technologists | 0 (0.0%) | 0 (0.0%) |
| Total (Category) | 11 (23.4%) | 36 (76.6%) |
| Total (Overall) | 145 (41.0%) | 209 (59.0%) |
Services Occupations
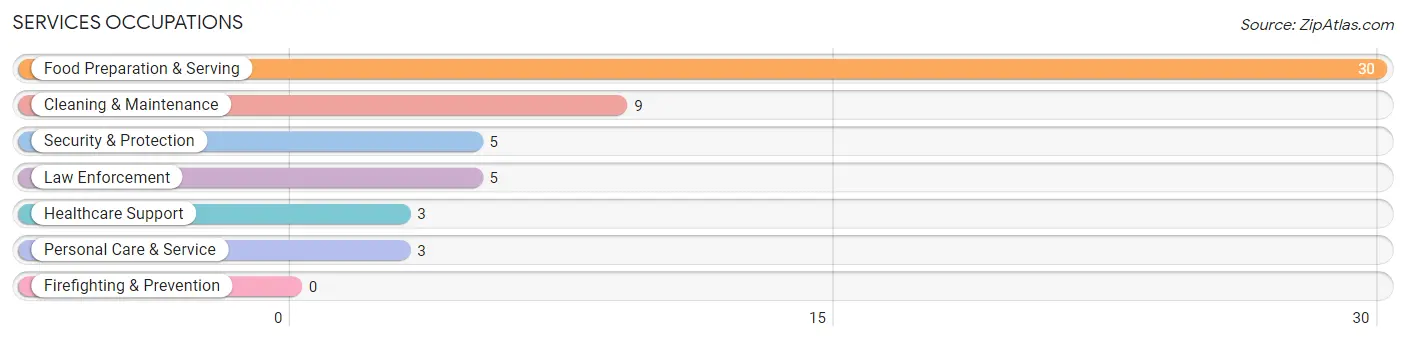
The most common Services occupations in Kingston are Food Preparation & Serving (30 | 8.5%), Cleaning & Maintenance (9 | 2.5%), Security & Protection (5 | 1.4%), Law Enforcement (5 | 1.4%), and Healthcare Support (3 | 0.9%).
Services Occupations by Sex
Within the Services occupations in Kingston, the most male-oriented occupations are Cleaning & Maintenance (100.0%), Security & Protection (40.0%), and Law Enforcement (40.0%), while the most female-oriented occupations are Healthcare Support (100.0%), Personal Care & Service (100.0%), and Food Preparation & Serving (70.0%).
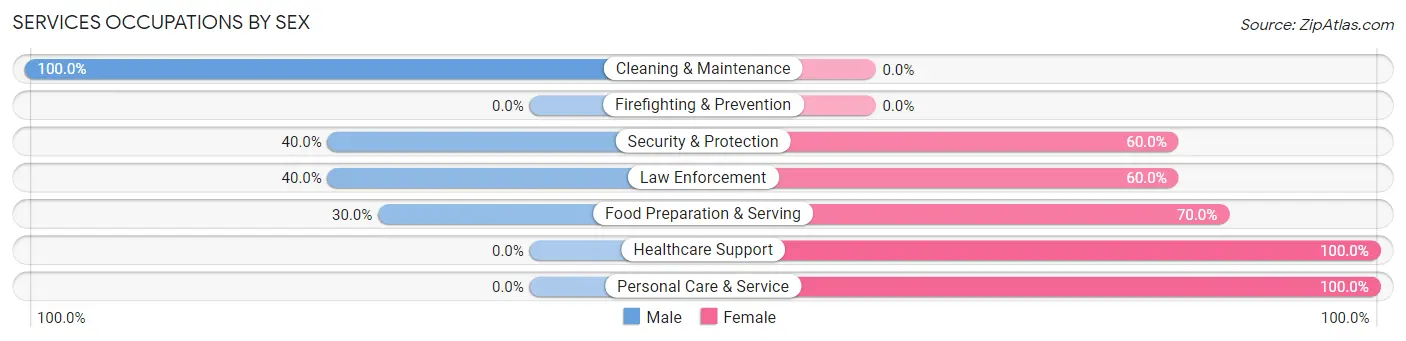
| Occupation | Male | Female |
| Healthcare Support | 0 (0.0%) | 3 (100.0%) |
| Security & Protection | 2 (40.0%) | 3 (60.0%) |
| Firefighting & Prevention | 0 (0.0%) | 0 (0.0%) |
| Law Enforcement | 2 (40.0%) | 3 (60.0%) |
| Food Preparation & Serving | 9 (30.0%) | 21 (70.0%) |
| Cleaning & Maintenance | 9 (100.0%) | 0 (0.0%) |
| Personal Care & Service | 0 (0.0%) | 3 (100.0%) |
| Total (Category) | 20 (40.0%) | 30 (60.0%) |
| Total (Overall) | 145 (41.0%) | 209 (59.0%) |
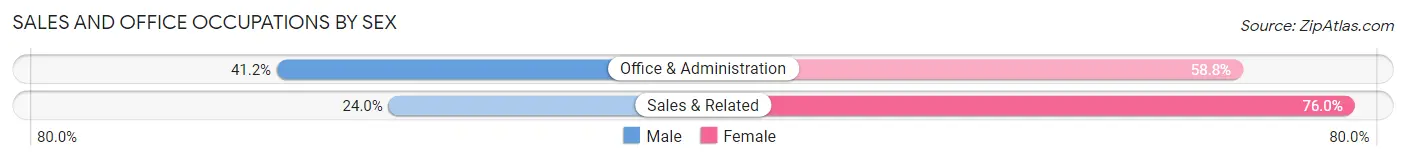
Sales and Office Occupations
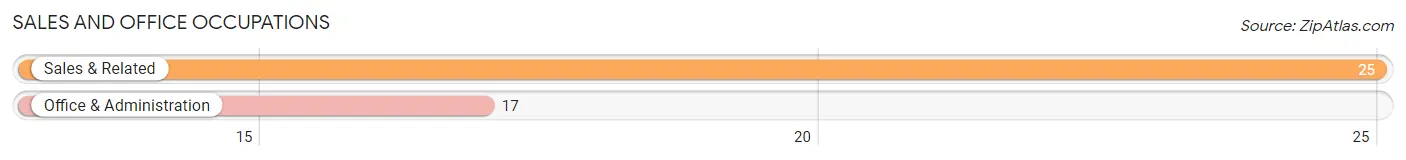
The most common Sales and Office occupations in Kingston are Sales & Related (25 | 7.1%), and Office & Administration (17 | 4.8%).
Sales and Office Occupations by Sex
| Occupation | Male | Female |
| Sales & Related | 6 (24.0%) | 19 (76.0%) |
| Office & Administration | 7 (41.2%) | 10 (58.8%) |
| Total (Category) | 13 (30.9%) | 29 (69.1%) |
| Total (Overall) | 145 (41.0%) | 209 (59.0%) |
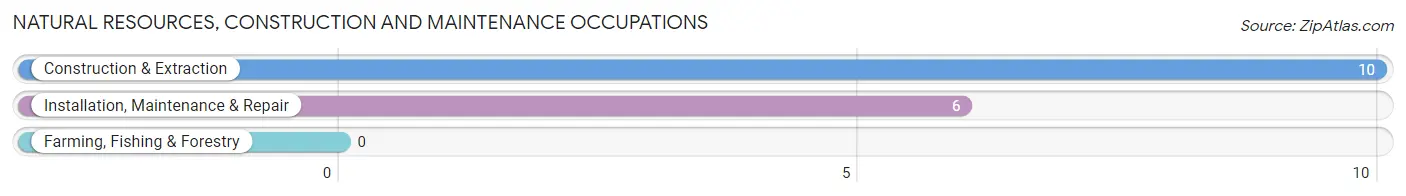
Natural Resources, Construction and Maintenance Occupations
The most common Natural Resources, Construction and Maintenance occupations in Kingston are Construction & Extraction (10 | 2.8%), and Installation, Maintenance & Repair (6 | 1.7%).
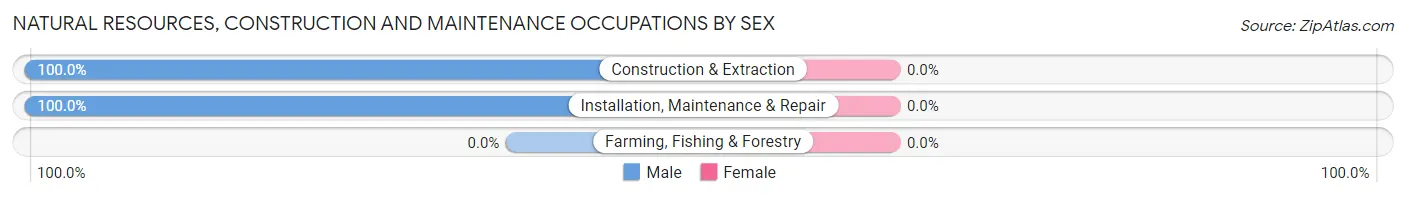
Natural Resources, Construction and Maintenance Occupations by Sex
| Occupation | Male | Female |
| Farming, Fishing & Forestry | 0 (0.0%) | 0 (0.0%) |
| Construction & Extraction | 10 (100.0%) | 0 (0.0%) |
| Installation, Maintenance & Repair | 6 (100.0%) | 0 (0.0%) |
| Total (Category) | 16 (100.0%) | 0 (0.0%) |
| Total (Overall) | 145 (41.0%) | 209 (59.0%) |
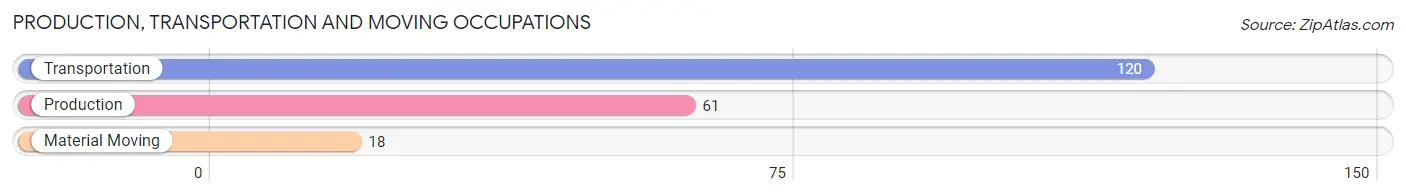
Production, Transportation and Moving Occupations
The most common Production, Transportation and Moving occupations in Kingston are Transportation (120 | 33.9%), Production (61 | 17.2%), and Material Moving (18 | 5.1%).
Production, Transportation and Moving Occupations by Sex
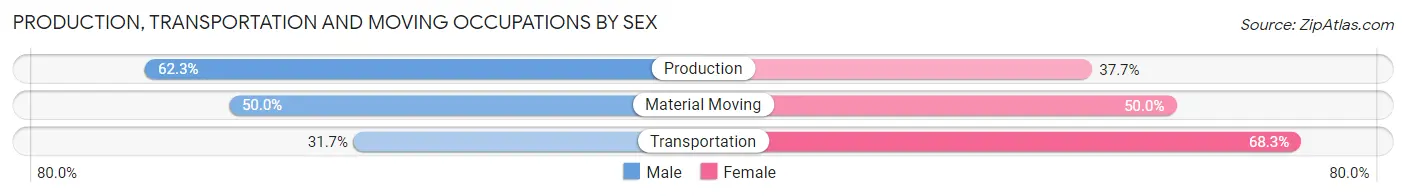
| Occupation | Male | Female |
| Production | 38 (62.3%) | 23 (37.7%) |
| Transportation | 38 (31.7%) | 82 (68.3%) |
| Material Moving | 9 (50.0%) | 9 (50.0%) |
| Total (Category) | 85 (42.7%) | 114 (57.3%) |
| Total (Overall) | 145 (41.0%) | 209 (59.0%) |
Employment Industries by Sex in Kingston
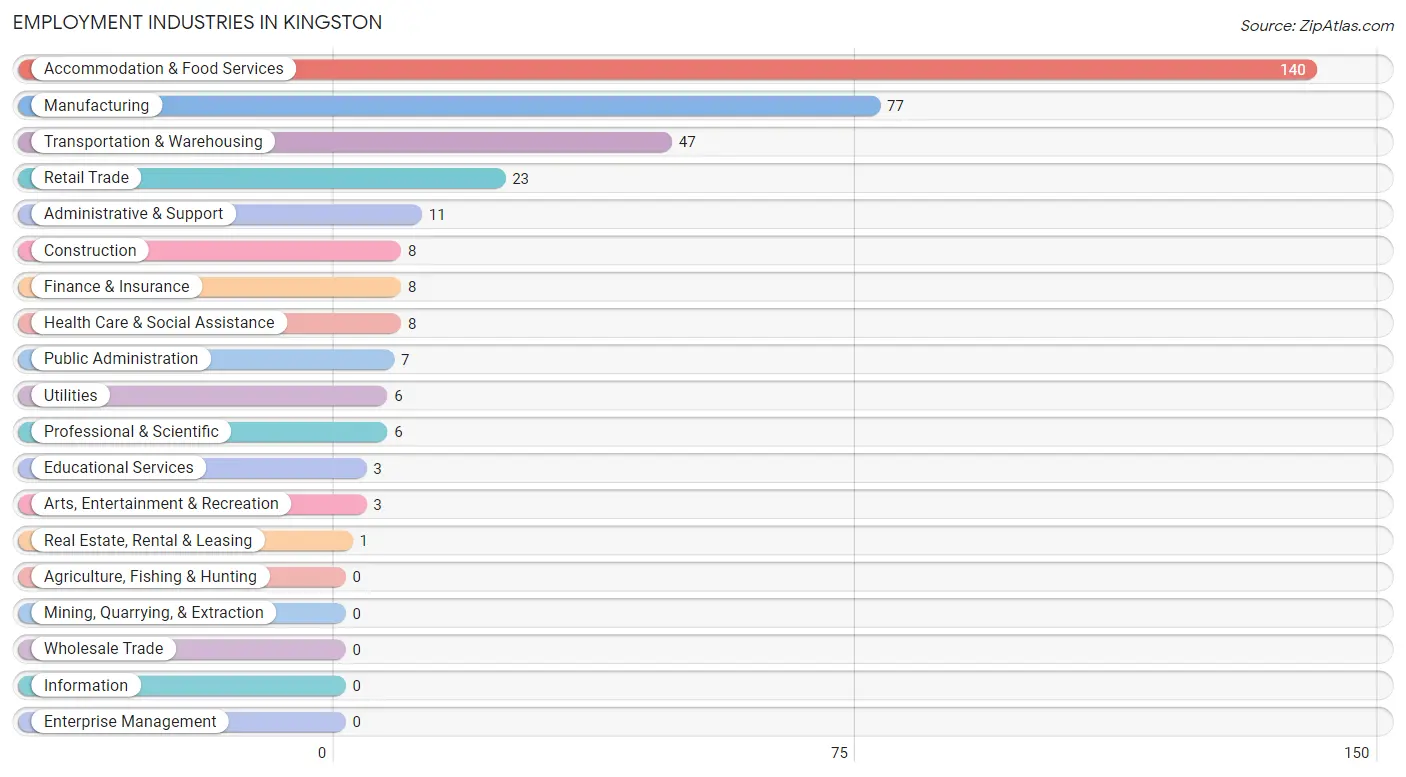
Employment Industries in Kingston
The major employment industries in Kingston include Accommodation & Food Services (140 | 39.6%), Manufacturing (77 | 21.7%), Transportation & Warehousing (47 | 13.3%), Retail Trade (23 | 6.5%), and Administrative & Support (11 | 3.1%).
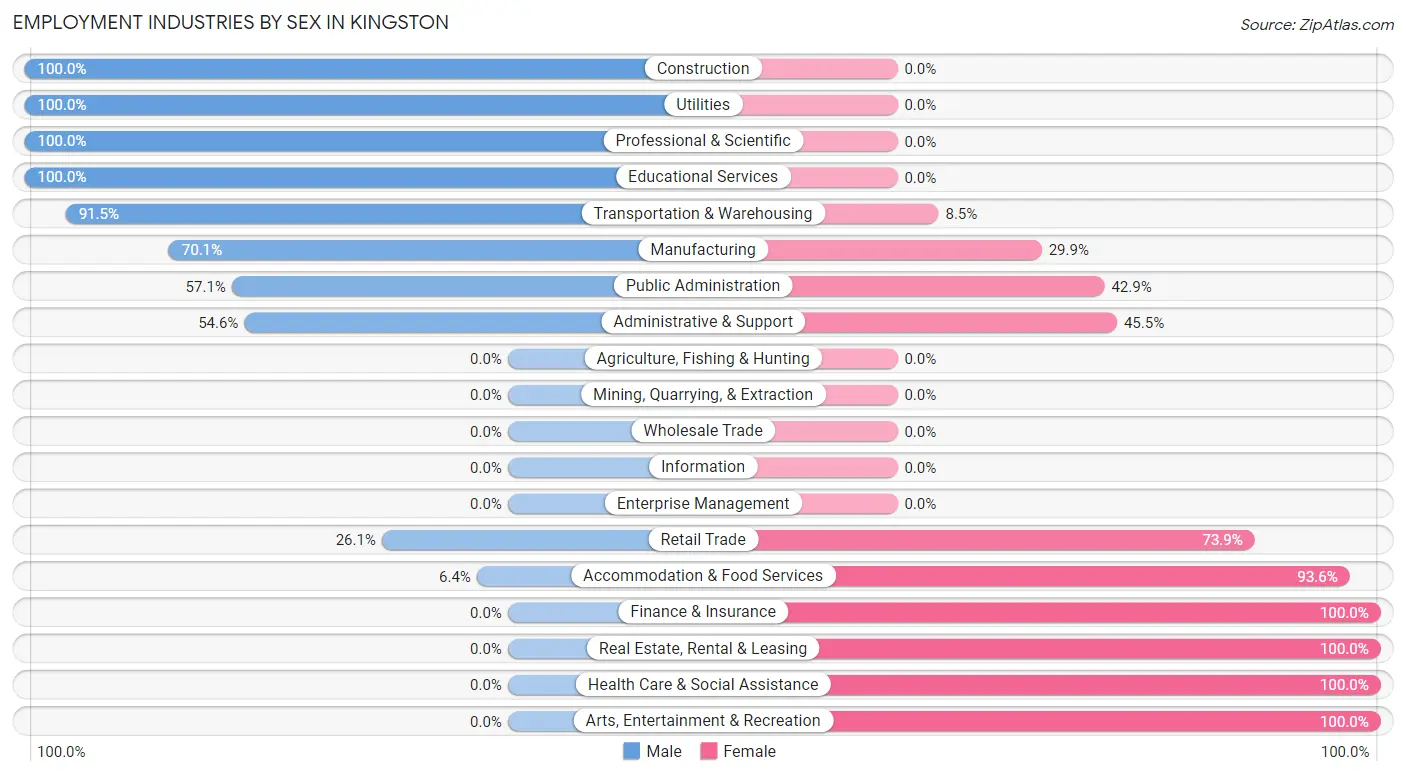
Employment Industries by Sex in Kingston
The Kingston industries that see more men than women are Construction (100.0%), Utilities (100.0%), and Professional & Scientific (100.0%), whereas the industries that tend to have a higher number of women are Finance & Insurance (100.0%), Real Estate, Rental & Leasing (100.0%), and Health Care & Social Assistance (100.0%).
| Industry | Male | Female |
| Agriculture, Fishing & Hunting | 0 (0.0%) | 0 (0.0%) |
| Mining, Quarrying, & Extraction | 0 (0.0%) | 0 (0.0%) |
| Construction | 8 (100.0%) | 0 (0.0%) |
| Manufacturing | 54 (70.1%) | 23 (29.9%) |
| Wholesale Trade | 0 (0.0%) | 0 (0.0%) |
| Retail Trade | 6 (26.1%) | 17 (73.9%) |
| Transportation & Warehousing | 43 (91.5%) | 4 (8.5%) |
| Utilities | 6 (100.0%) | 0 (0.0%) |
| Information | 0 (0.0%) | 0 (0.0%) |
| Finance & Insurance | 0 (0.0%) | 8 (100.0%) |
| Real Estate, Rental & Leasing | 0 (0.0%) | 1 (100.0%) |
| Professional & Scientific | 6 (100.0%) | 0 (0.0%) |
| Enterprise Management | 0 (0.0%) | 0 (0.0%) |
| Administrative & Support | 6 (54.5%) | 5 (45.5%) |
| Educational Services | 3 (100.0%) | 0 (0.0%) |
| Health Care & Social Assistance | 0 (0.0%) | 8 (100.0%) |
| Arts, Entertainment & Recreation | 0 (0.0%) | 3 (100.0%) |
| Accommodation & Food Services | 9 (6.4%) | 131 (93.6%) |
| Public Administration | 4 (57.1%) | 3 (42.9%) |
| Total | 145 (41.0%) | 209 (59.0%) |
Education in Kingston
School Enrollment in Kingston
The most common levels of schooling among the 141 students in Kingston are high school (62 | 44.0%), middle school (36 | 25.5%), and elementary school (26 | 18.4%).

| School Level | # Students | % Students |
| Nursery / Preschool | 0 | 0.0% |
| Kindergarten | 8 | 5.7% |
| Elementary School | 26 | 18.4% |
| Middle School | 36 | 25.5% |
| High School | 62 | 44.0% |
| College / Undergraduate | 6 | 4.3% |
| Graduate / Professional | 3 | 2.1% |
| Total | 141 | 100.0% |
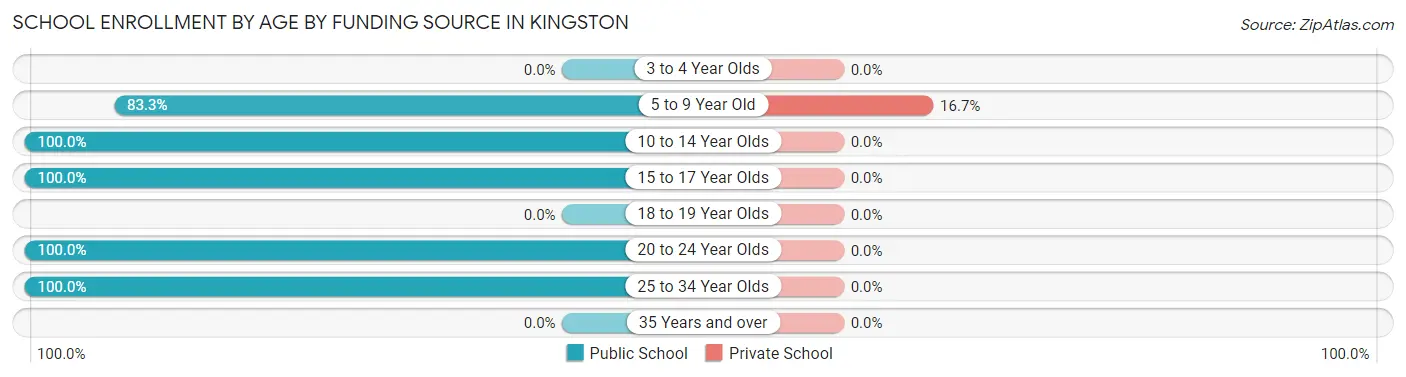
School Enrollment by Age by Funding Source in Kingston
Out of a total of 141 students who are enrolled in schools in Kingston, 5 (3.5%) attend a private institution, while the remaining 136 (96.5%) are enrolled in public schools. The age group of 5 to 9 year old has the highest likelihood of being enrolled in private schools, with 5 (16.7% in the age bracket) enrolled. Conversely, the age group of 10 to 14 year olds has the lowest likelihood of being enrolled in a private school, with 51 (100.0% in the age bracket) attending a public institution.
| Age Bracket | Public School | Private School |
| 3 to 4 Year Olds | 0 (0.0%) | 0 (0.0%) |
| 5 to 9 Year Old | 25 (83.3%) | 5 (16.7%) |
| 10 to 14 Year Olds | 51 (100.0%) | 0 (0.0%) |
| 15 to 17 Year Olds | 51 (100.0%) | 0 (0.0%) |
| 18 to 19 Year Olds | 0 (0.0%) | 0 (0.0%) |
| 20 to 24 Year Olds | 6 (100.0%) | 0 (0.0%) |
| 25 to 34 Year Olds | 3 (100.0%) | 0 (0.0%) |
| 35 Years and over | 0 (0.0%) | 0 (0.0%) |
| Total | 136 (96.5%) | 5 (3.5%) |
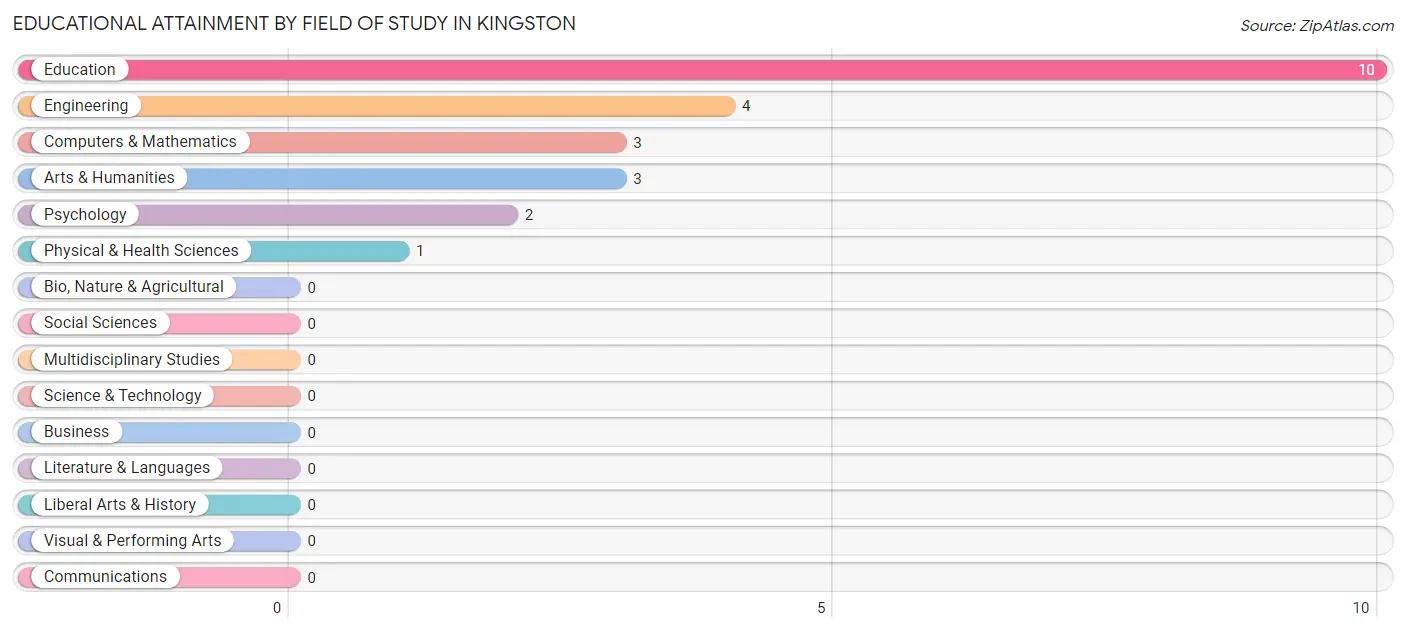
Educational Attainment by Field of Study in Kingston
Education (10 | 43.5%), engineering (4 | 17.4%), computers & mathematics (3 | 13.0%), arts & humanities (3 | 13.0%), and psychology (2 | 8.7%) are the most common fields of study among 23 individuals in Kingston who have obtained a bachelor's degree or higher.
| Field of Study | # Graduates | % Graduates |
| Computers & Mathematics | 3 | 13.0% |
| Bio, Nature & Agricultural | 0 | 0.0% |
| Physical & Health Sciences | 1 | 4.3% |
| Psychology | 2 | 8.7% |
| Social Sciences | 0 | 0.0% |
| Engineering | 4 | 17.4% |
| Multidisciplinary Studies | 0 | 0.0% |
| Science & Technology | 0 | 0.0% |
| Business | 0 | 0.0% |
| Education | 10 | 43.5% |
| Literature & Languages | 0 | 0.0% |
| Liberal Arts & History | 0 | 0.0% |
| Visual & Performing Arts | 0 | 0.0% |
| Communications | 0 | 0.0% |
| Arts & Humanities | 3 | 13.0% |
| Total | 23 | 100.0% |
Transportation & Commute in Kingston
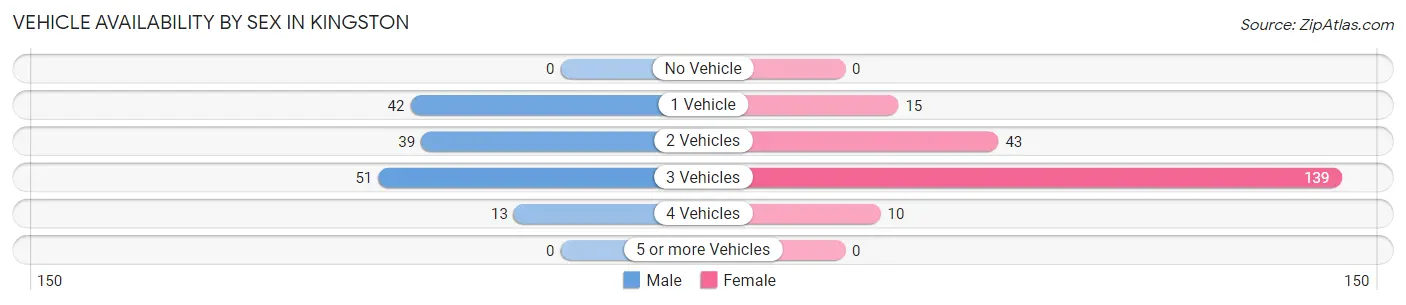
Vehicle Availability by Sex in Kingston
The most prevalent vehicle ownership categories in Kingston are males with 3 vehicles (51, accounting for 35.2%) and females with 3 vehicles (139, making up 24.6%).
| Vehicles Available | Male | Female |
| No Vehicle | 0 (0.0%) | 0 (0.0%) |
| 1 Vehicle | 42 (29.0%) | 15 (7.2%) |
| 2 Vehicles | 39 (26.9%) | 43 (20.8%) |
| 3 Vehicles | 51 (35.2%) | 139 (67.1%) |
| 4 Vehicles | 13 (9.0%) | 10 (4.8%) |
| 5 or more Vehicles | 0 (0.0%) | 0 (0.0%) |
| Total | 145 (100.0%) | 207 (100.0%) |
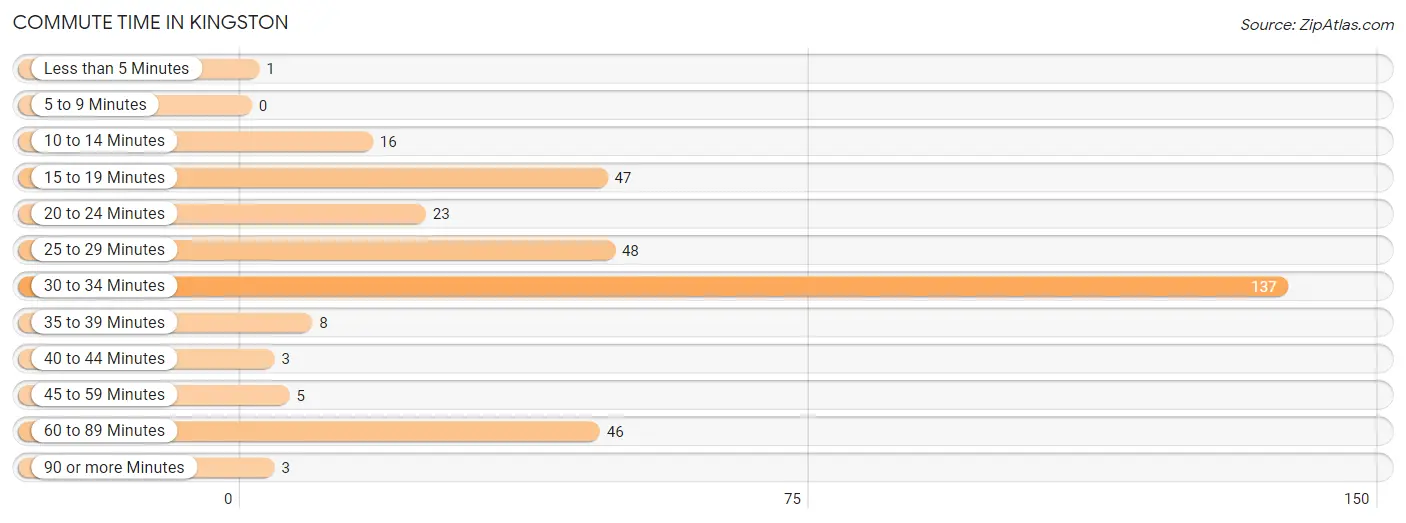
Commute Time in Kingston
The most frequently occuring commute durations in Kingston are 30 to 34 minutes (137 commuters, 40.6%), 25 to 29 minutes (48 commuters, 14.2%), and 15 to 19 minutes (47 commuters, 14.0%).
| Commute Time | # Commuters | % Commuters |
| Less than 5 Minutes | 1 | 0.3% |
| 5 to 9 Minutes | 0 | 0.0% |
| 10 to 14 Minutes | 16 | 4.8% |
| 15 to 19 Minutes | 47 | 14.0% |
| 20 to 24 Minutes | 23 | 6.8% |
| 25 to 29 Minutes | 48 | 14.2% |
| 30 to 34 Minutes | 137 | 40.6% |
| 35 to 39 Minutes | 8 | 2.4% |
| 40 to 44 Minutes | 3 | 0.9% |
| 45 to 59 Minutes | 5 | 1.5% |
| 60 to 89 Minutes | 46 | 13.7% |
| 90 or more Minutes | 3 | 0.9% |
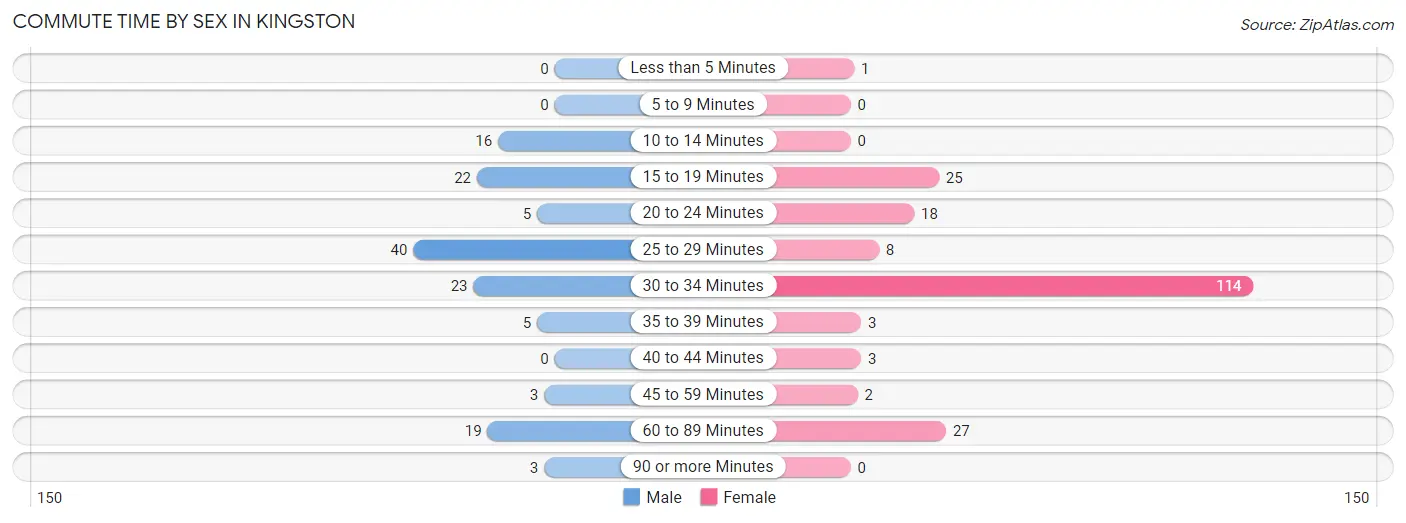
Commute Time by Sex in Kingston
The most common commute times in Kingston are 25 to 29 minutes (40 commuters, 29.4%) for males and 30 to 34 minutes (114 commuters, 56.7%) for females.
| Commute Time | Male | Female |
| Less than 5 Minutes | 0 (0.0%) | 1 (0.5%) |
| 5 to 9 Minutes | 0 (0.0%) | 0 (0.0%) |
| 10 to 14 Minutes | 16 (11.8%) | 0 (0.0%) |
| 15 to 19 Minutes | 22 (16.2%) | 25 (12.4%) |
| 20 to 24 Minutes | 5 (3.7%) | 18 (9.0%) |
| 25 to 29 Minutes | 40 (29.4%) | 8 (4.0%) |
| 30 to 34 Minutes | 23 (16.9%) | 114 (56.7%) |
| 35 to 39 Minutes | 5 (3.7%) | 3 (1.5%) |
| 40 to 44 Minutes | 0 (0.0%) | 3 (1.5%) |
| 45 to 59 Minutes | 3 (2.2%) | 2 (1.0%) |
| 60 to 89 Minutes | 19 (14.0%) | 27 (13.4%) |
| 90 or more Minutes | 3 (2.2%) | 0 (0.0%) |
Time of Departure to Work by Sex in Kingston
The most frequent times of departure to work in Kingston are 7:00 AM to 7:29 AM (55, 40.4%) for males and 12:00 PM to 3:59 PM (113, 56.2%) for females.
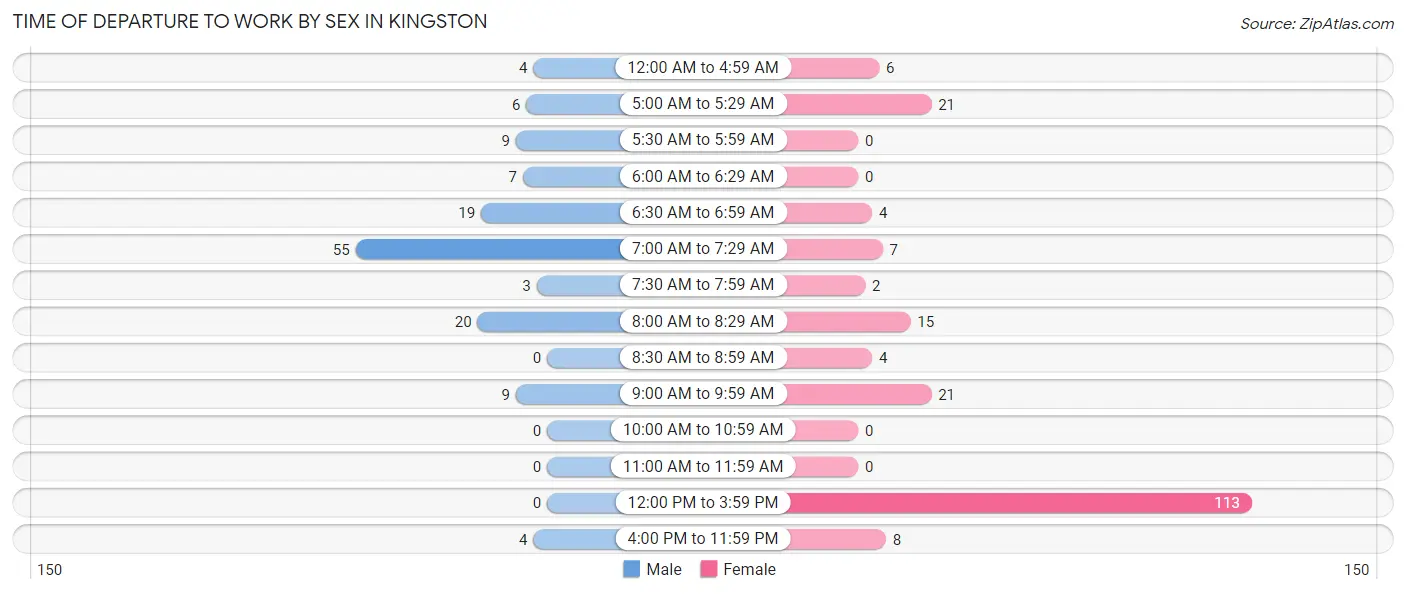
| Time of Departure | Male | Female |
| 12:00 AM to 4:59 AM | 4 (2.9%) | 6 (3.0%) |
| 5:00 AM to 5:29 AM | 6 (4.4%) | 21 (10.4%) |
| 5:30 AM to 5:59 AM | 9 (6.6%) | 0 (0.0%) |
| 6:00 AM to 6:29 AM | 7 (5.1%) | 0 (0.0%) |
| 6:30 AM to 6:59 AM | 19 (14.0%) | 4 (2.0%) |
| 7:00 AM to 7:29 AM | 55 (40.4%) | 7 (3.5%) |
| 7:30 AM to 7:59 AM | 3 (2.2%) | 2 (1.0%) |
| 8:00 AM to 8:29 AM | 20 (14.7%) | 15 (7.5%) |
| 8:30 AM to 8:59 AM | 0 (0.0%) | 4 (2.0%) |
| 9:00 AM to 9:59 AM | 9 (6.6%) | 21 (10.4%) |
| 10:00 AM to 10:59 AM | 0 (0.0%) | 0 (0.0%) |
| 11:00 AM to 11:59 AM | 0 (0.0%) | 0 (0.0%) |
| 12:00 PM to 3:59 PM | 0 (0.0%) | 113 (56.2%) |
| 4:00 PM to 11:59 PM | 4 (2.9%) | 8 (4.0%) |
| Total | 136 (100.0%) | 201 (100.0%) |
Housing Occupancy in Kingston
Occupancy by Ownership in Kingston
Of the total 276 dwellings in Kingston, owner-occupied units account for 201 (72.8%), while renter-occupied units make up 75 (27.2%).
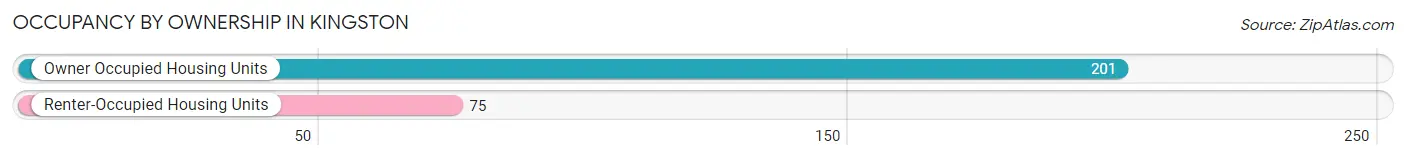
| Occupancy | # Housing Units | % Housing Units |
| Owner Occupied Housing Units | 201 | 72.8% |
| Renter-Occupied Housing Units | 75 | 27.2% |
| Total Occupied Housing Units | 276 | 100.0% |
Occupancy by Household Size in Kingston
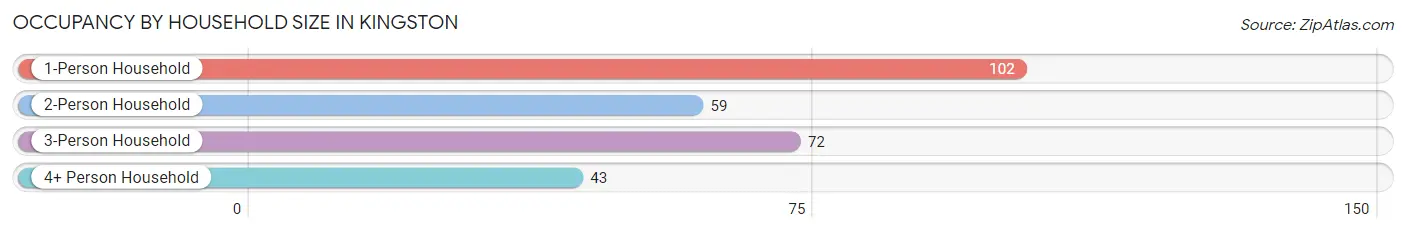
| Household Size | # Housing Units | % Housing Units |
| 1-Person Household | 102 | 37.0% |
| 2-Person Household | 59 | 21.4% |
| 3-Person Household | 72 | 26.1% |
| 4+ Person Household | 43 | 15.6% |
| Total Housing Units | 276 | 100.0% |
Occupancy by Ownership by Household Size in Kingston
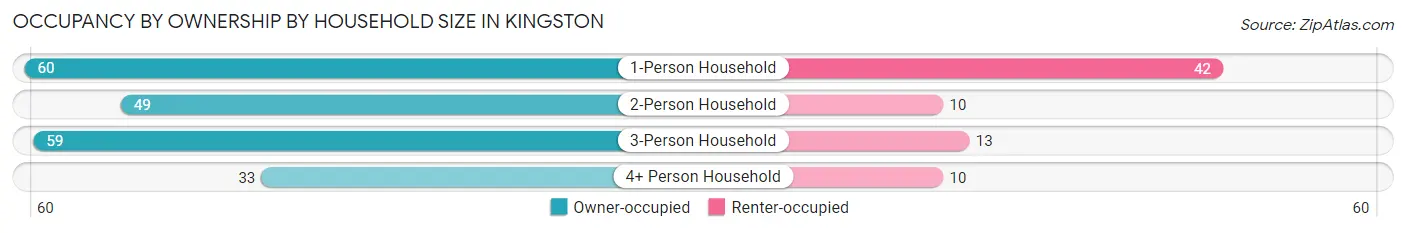
| Household Size | Owner-occupied | Renter-occupied |
| 1-Person Household | 60 (58.8%) | 42 (41.2%) |
| 2-Person Household | 49 (83.1%) | 10 (17.0%) |
| 3-Person Household | 59 (81.9%) | 13 (18.1%) |
| 4+ Person Household | 33 (76.7%) | 10 (23.3%) |
| Total Housing Units | 201 (72.8%) | 75 (27.2%) |
Occupancy by Educational Attainment in Kingston
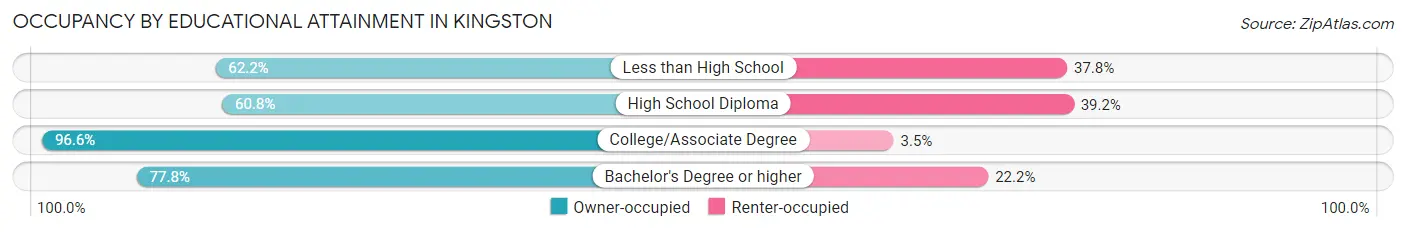
| Household Size | Owner-occupied | Renter-occupied |
| Less than High School | 23 (62.2%) | 14 (37.8%) |
| High School Diploma | 87 (60.8%) | 56 (39.2%) |
| College/Associate Degree | 84 (96.6%) | 3 (3.5%) |
| Bachelor's Degree or higher | 7 (77.8%) | 2 (22.2%) |
Occupancy by Age of Householder in Kingston
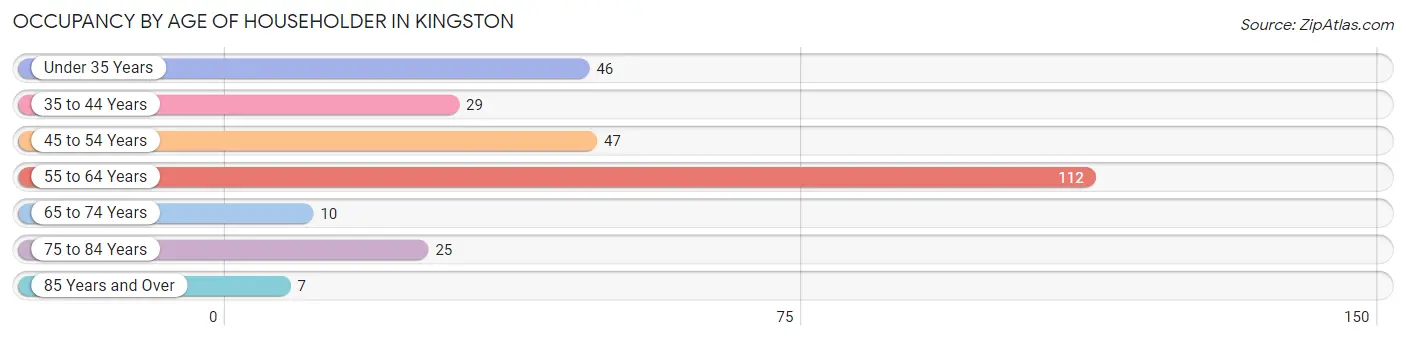
| Age Bracket | # Households | % Households |
| Under 35 Years | 46 | 16.7% |
| 35 to 44 Years | 29 | 10.5% |
| 45 to 54 Years | 47 | 17.0% |
| 55 to 64 Years | 112 | 40.6% |
| 65 to 74 Years | 10 | 3.6% |
| 75 to 84 Years | 25 | 9.1% |
| 85 Years and Over | 7 | 2.5% |
| Total | 276 | 100.0% |
Housing Finances in Kingston
Median Income by Occupancy in Kingston
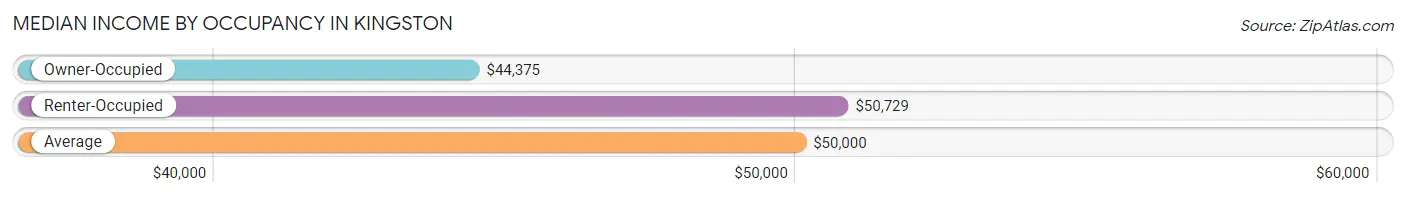
| Occupancy Type | # Households | Median Income |
| Owner-Occupied | 201 (72.8%) | $44,375 |
| Renter-Occupied | 75 (27.2%) | $50,729 |
| Average | 276 (100.0%) | $50,000 |
Occupancy by Householder Income Bracket in Kingston
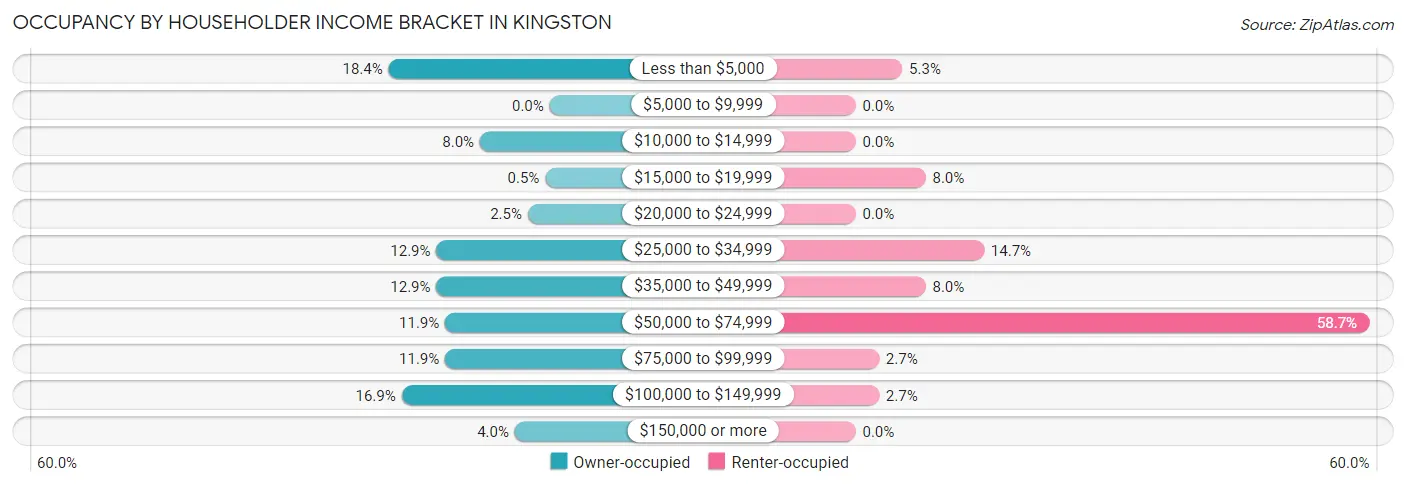
| Income Bracket | Owner-occupied | Renter-occupied |
| Less than $5,000 | 37 (18.4%) | 4 (5.3%) |
| $5,000 to $9,999 | 0 (0.0%) | 0 (0.0%) |
| $10,000 to $14,999 | 16 (8.0%) | 0 (0.0%) |
| $15,000 to $19,999 | 1 (0.5%) | 6 (8.0%) |
| $20,000 to $24,999 | 5 (2.5%) | 0 (0.0%) |
| $25,000 to $34,999 | 26 (12.9%) | 11 (14.7%) |
| $35,000 to $49,999 | 26 (12.9%) | 6 (8.0%) |
| $50,000 to $74,999 | 24 (11.9%) | 44 (58.7%) |
| $75,000 to $99,999 | 24 (11.9%) | 2 (2.7%) |
| $100,000 to $149,999 | 34 (16.9%) | 2 (2.7%) |
| $150,000 or more | 8 (4.0%) | 0 (0.0%) |
| Total | 201 (100.0%) | 75 (100.0%) |
Monthly Housing Cost Tiers in Kingston
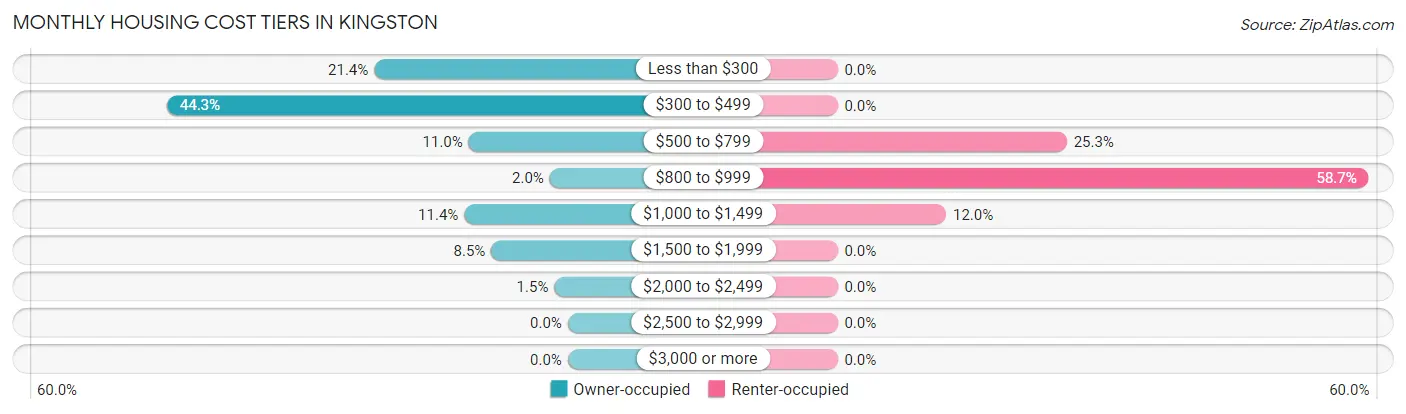
| Monthly Cost | Owner-occupied | Renter-occupied |
| Less than $300 | 43 (21.4%) | 0 (0.0%) |
| $300 to $499 | 89 (44.3%) | 0 (0.0%) |
| $500 to $799 | 22 (11.0%) | 19 (25.3%) |
| $800 to $999 | 4 (2.0%) | 44 (58.7%) |
| $1,000 to $1,499 | 23 (11.4%) | 9 (12.0%) |
| $1,500 to $1,999 | 17 (8.5%) | 0 (0.0%) |
| $2,000 to $2,499 | 3 (1.5%) | 0 (0.0%) |
| $2,500 to $2,999 | 0 (0.0%) | 0 (0.0%) |
| $3,000 or more | 0 (0.0%) | 0 (0.0%) |
| Total | 201 (100.0%) | 75 (100.0%) |
Physical Housing Characteristics in Kingston
Housing Structures in Kingston
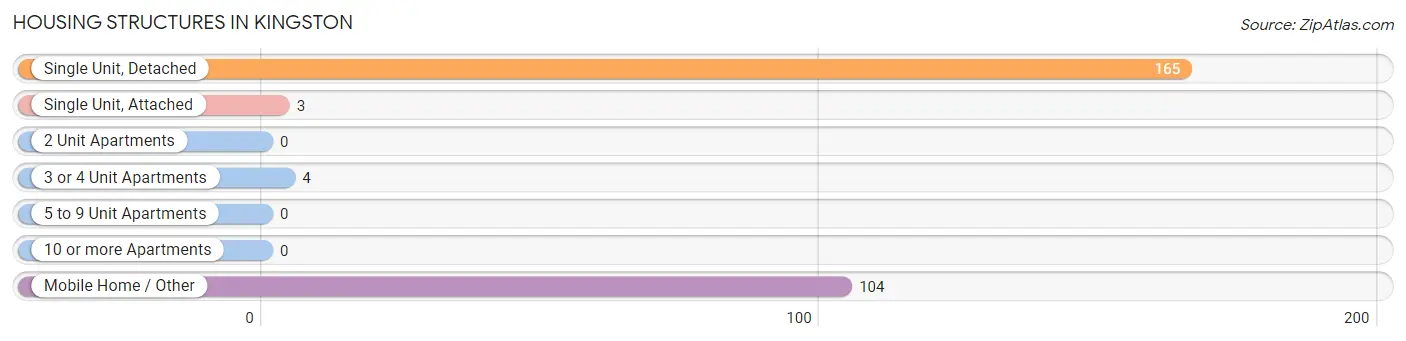
| Structure Type | # Housing Units | % Housing Units |
| Single Unit, Detached | 165 | 59.8% |
| Single Unit, Attached | 3 | 1.1% |
| 2 Unit Apartments | 0 | 0.0% |
| 3 or 4 Unit Apartments | 4 | 1.5% |
| 5 to 9 Unit Apartments | 0 | 0.0% |
| 10 or more Apartments | 0 | 0.0% |
| Mobile Home / Other | 104 | 37.7% |
| Total | 276 | 100.0% |
Housing Structures by Occupancy in Kingston
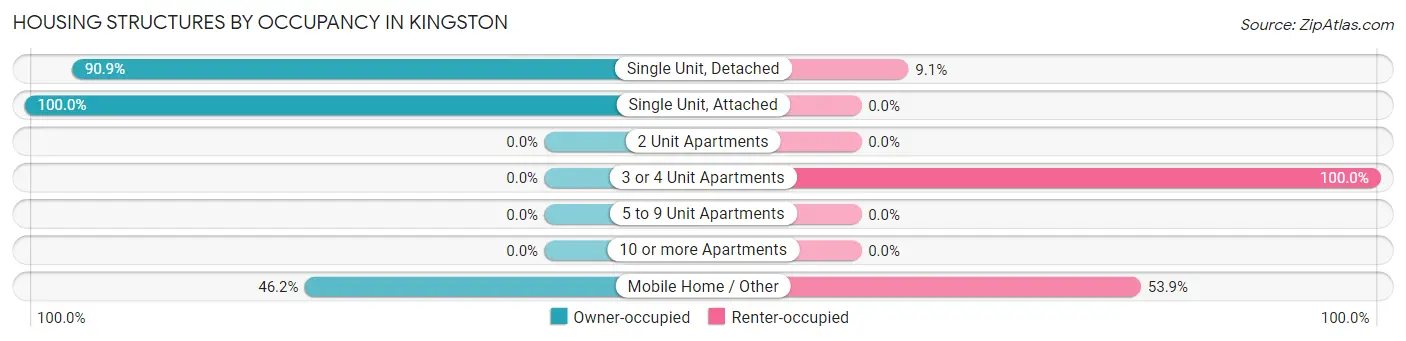
| Structure Type | Owner-occupied | Renter-occupied |
| Single Unit, Detached | 150 (90.9%) | 15 (9.1%) |
| Single Unit, Attached | 3 (100.0%) | 0 (0.0%) |
| 2 Unit Apartments | 0 (0.0%) | 0 (0.0%) |
| 3 or 4 Unit Apartments | 0 (0.0%) | 4 (100.0%) |
| 5 to 9 Unit Apartments | 0 (0.0%) | 0 (0.0%) |
| 10 or more Apartments | 0 (0.0%) | 0 (0.0%) |
| Mobile Home / Other | 48 (46.2%) | 56 (53.8%) |
| Total | 201 (72.8%) | 75 (27.2%) |
Housing Structures by Number of Rooms in Kingston
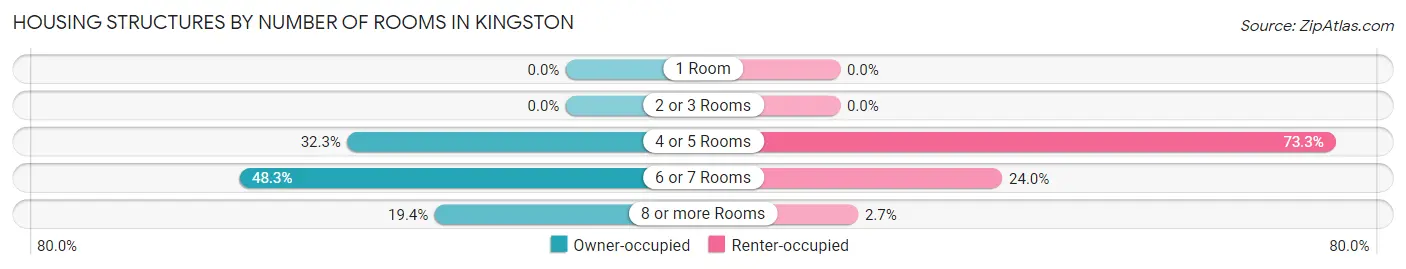
| Number of Rooms | Owner-occupied | Renter-occupied |
| 1 Room | 0 (0.0%) | 0 (0.0%) |
| 2 or 3 Rooms | 0 (0.0%) | 0 (0.0%) |
| 4 or 5 Rooms | 65 (32.3%) | 55 (73.3%) |
| 6 or 7 Rooms | 97 (48.3%) | 18 (24.0%) |
| 8 or more Rooms | 39 (19.4%) | 2 (2.7%) |
| Total | 201 (100.0%) | 75 (100.0%) |
Housing Structure by Heating Type in Kingston
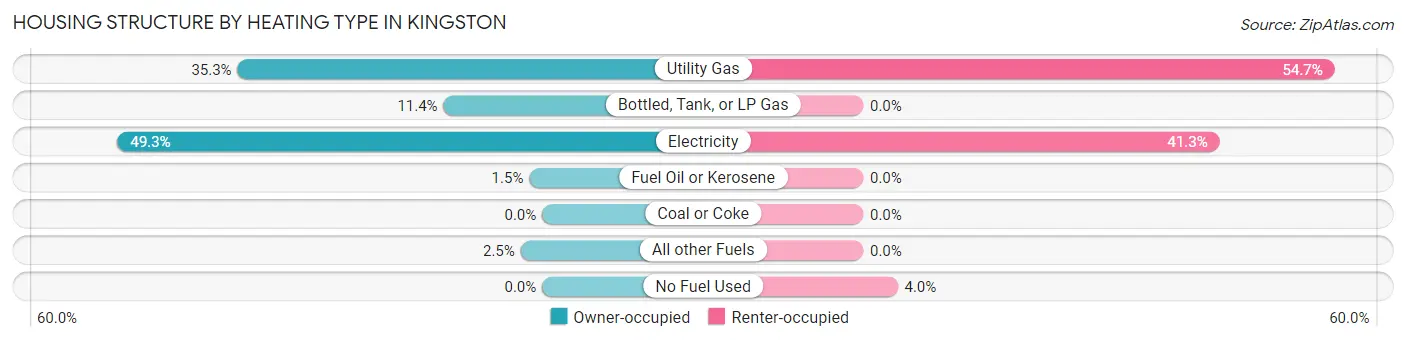
| Heating Type | Owner-occupied | Renter-occupied |
| Utility Gas | 71 (35.3%) | 41 (54.7%) |
| Bottled, Tank, or LP Gas | 23 (11.4%) | 0 (0.0%) |
| Electricity | 99 (49.2%) | 31 (41.3%) |
| Fuel Oil or Kerosene | 3 (1.5%) | 0 (0.0%) |
| Coal or Coke | 0 (0.0%) | 0 (0.0%) |
| All other Fuels | 5 (2.5%) | 0 (0.0%) |
| No Fuel Used | 0 (0.0%) | 3 (4.0%) |
| Total | 201 (100.0%) | 75 (100.0%) |
Household Vehicle Usage in Kingston
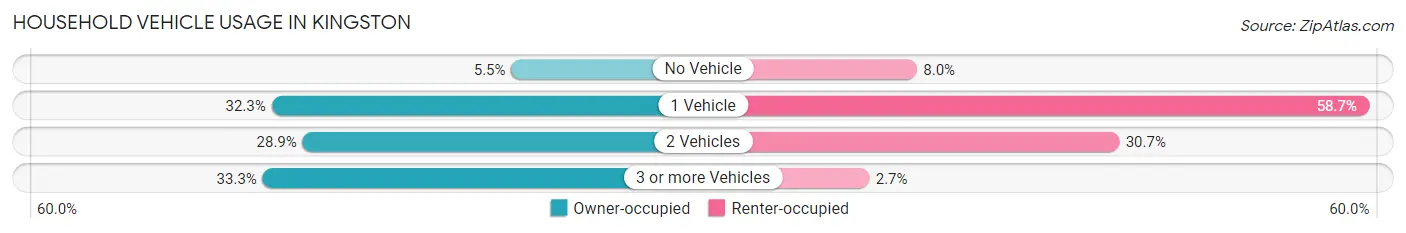
| Vehicles per Household | Owner-occupied | Renter-occupied |
| No Vehicle | 11 (5.5%) | 6 (8.0%) |
| 1 Vehicle | 65 (32.3%) | 44 (58.7%) |
| 2 Vehicles | 58 (28.9%) | 23 (30.7%) |
| 3 or more Vehicles | 67 (33.3%) | 2 (2.7%) |
| Total | 201 (100.0%) | 75 (100.0%) |
Real Estate & Mortgages in Kingston
Real Estate and Mortgage Overview in Kingston
| Characteristic | Without Mortgage | With Mortgage |
| Housing Units | 138 | 63 |
| Median Property Value | $63,600 | $217,500 |
| Median Household Income | $28,333 | $3 |
| Monthly Housing Costs | $402 | $0 |
| Real Estate Taxes | $720 | $0 |
Property Value by Mortgage Status in Kingston
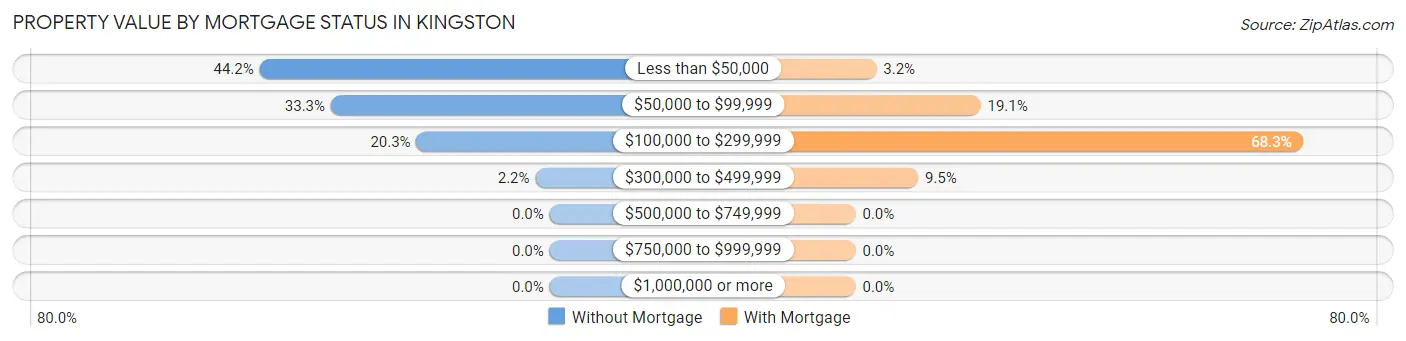
| Property Value | Without Mortgage | With Mortgage |
| Less than $50,000 | 61 (44.2%) | 2 (3.2%) |
| $50,000 to $99,999 | 46 (33.3%) | 12 (19.1%) |
| $100,000 to $299,999 | 28 (20.3%) | 43 (68.2%) |
| $300,000 to $499,999 | 3 (2.2%) | 6 (9.5%) |
| $500,000 to $749,999 | 0 (0.0%) | 0 (0.0%) |
| $750,000 to $999,999 | 0 (0.0%) | 0 (0.0%) |
| $1,000,000 or more | 0 (0.0%) | 0 (0.0%) |
| Total | 138 (100.0%) | 63 (100.0%) |
Household Income by Mortgage Status in Kingston
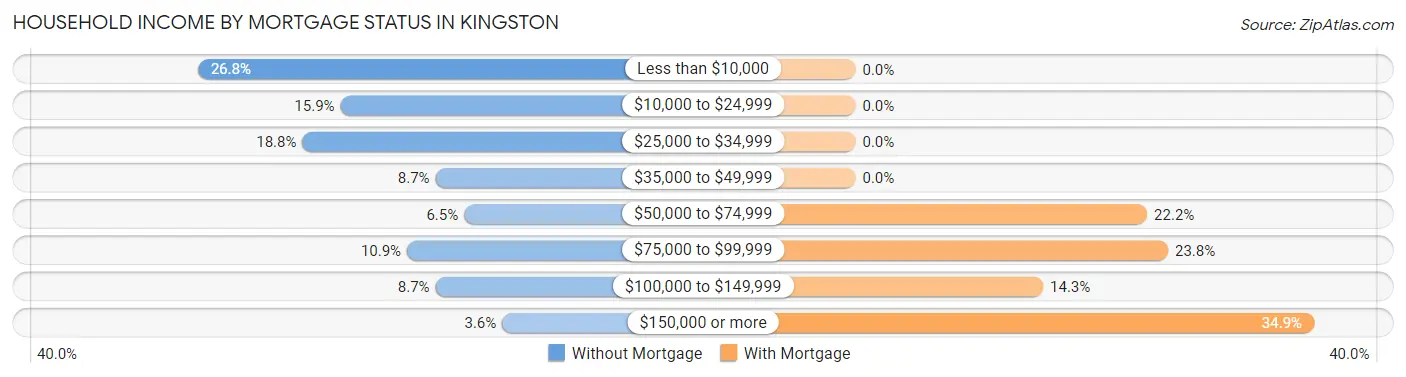
| Household Income | Without Mortgage | With Mortgage |
| Less than $10,000 | 37 (26.8%) | 0 (0.0%) |
| $10,000 to $24,999 | 22 (15.9%) | 0 (0.0%) |
| $25,000 to $34,999 | 26 (18.8%) | 0 (0.0%) |
| $35,000 to $49,999 | 12 (8.7%) | 0 (0.0%) |
| $50,000 to $74,999 | 9 (6.5%) | 14 (22.2%) |
| $75,000 to $99,999 | 15 (10.9%) | 15 (23.8%) |
| $100,000 to $149,999 | 12 (8.7%) | 9 (14.3%) |
| $150,000 or more | 5 (3.6%) | 22 (34.9%) |
| Total | 138 (100.0%) | 63 (100.0%) |
Property Value to Household Income Ratio in Kingston
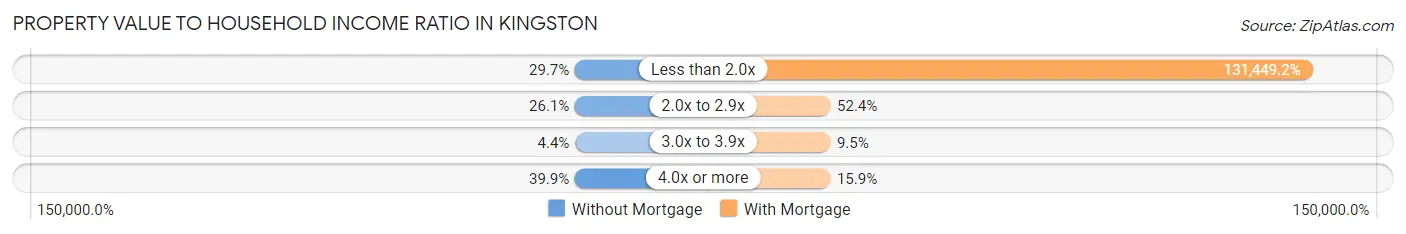
| Value-to-Income Ratio | Without Mortgage | With Mortgage |
| Less than 2.0x | 41 (29.7%) | 82,813 (131,449.2%) |
| 2.0x to 2.9x | 36 (26.1%) | 33 (52.4%) |
| 3.0x to 3.9x | 6 (4.3%) | 6 (9.5%) |
| 4.0x or more | 55 (39.9%) | 10 (15.9%) |
| Total | 138 (100.0%) | 63 (100.0%) |
Real Estate Taxes by Mortgage Status in Kingston
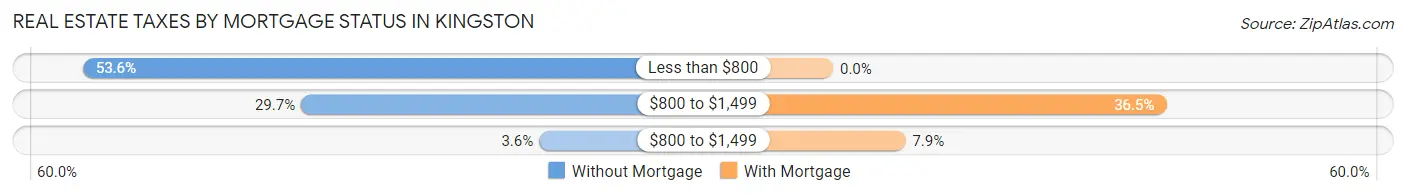
| Property Taxes | Without Mortgage | With Mortgage |
| Less than $800 | 74 (53.6%) | 0 (0.0%) |
| $800 to $1,499 | 41 (29.7%) | 23 (36.5%) |
| $800 to $1,499 | 5 (3.6%) | 5 (7.9%) |
| Total | 138 (100.0%) | 63 (100.0%) |
Health & Disability in Kingston
Health Insurance Coverage by Age in Kingston
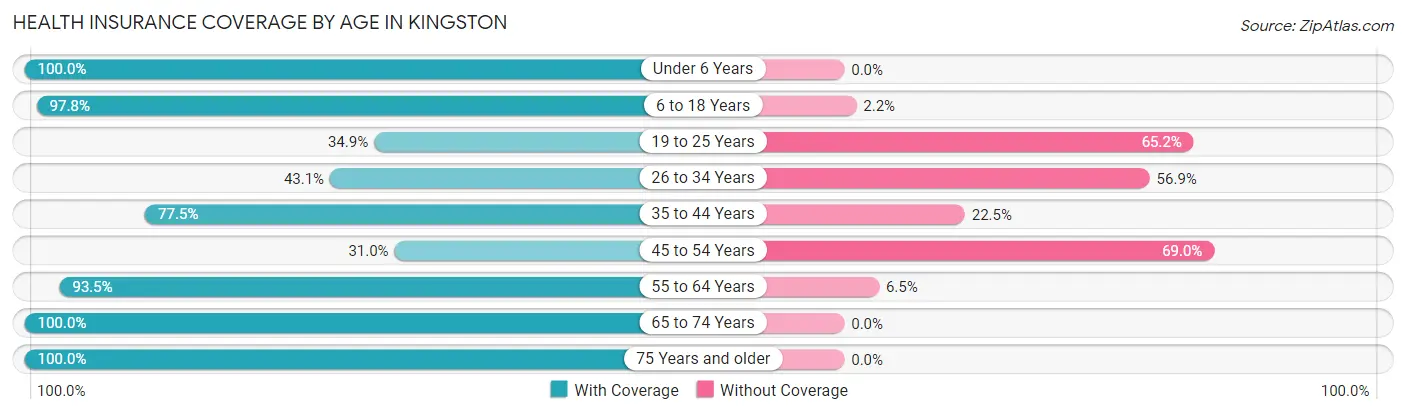
| Age Bracket | With Coverage | Without Coverage |
| Under 6 Years | 40 (100.0%) | 0 (0.0%) |
| 6 to 18 Years | 131 (97.8%) | 3 (2.2%) |
| 19 to 25 Years | 23 (34.8%) | 43 (65.1%) |
| 26 to 34 Years | 31 (43.1%) | 41 (56.9%) |
| 35 to 44 Years | 69 (77.5%) | 20 (22.5%) |
| 45 to 54 Years | 45 (31.0%) | 100 (69.0%) |
| 55 to 64 Years | 130 (93.5%) | 9 (6.5%) |
| 65 to 74 Years | 26 (100.0%) | 0 (0.0%) |
| 75 Years and older | 63 (100.0%) | 0 (0.0%) |
| Total | 558 (72.1%) | 216 (27.9%) |
Health Insurance Coverage by Citizenship Status in Kingston
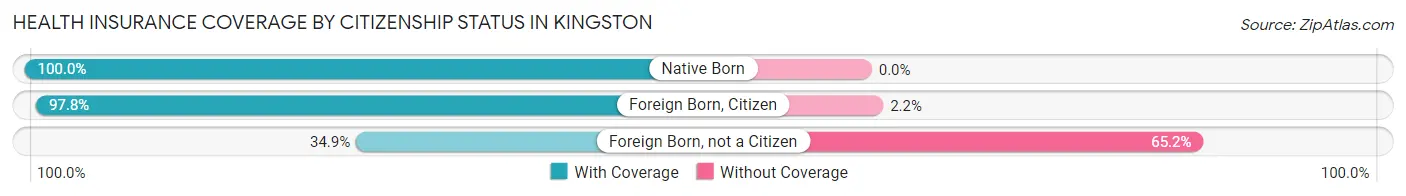
| Citizenship Status | With Coverage | Without Coverage |
| Native Born | 40 (100.0%) | 0 (0.0%) |
| Foreign Born, Citizen | 131 (97.8%) | 3 (2.2%) |
| Foreign Born, not a Citizen | 23 (34.8%) | 43 (65.1%) |
Health Insurance Coverage by Household Income in Kingston
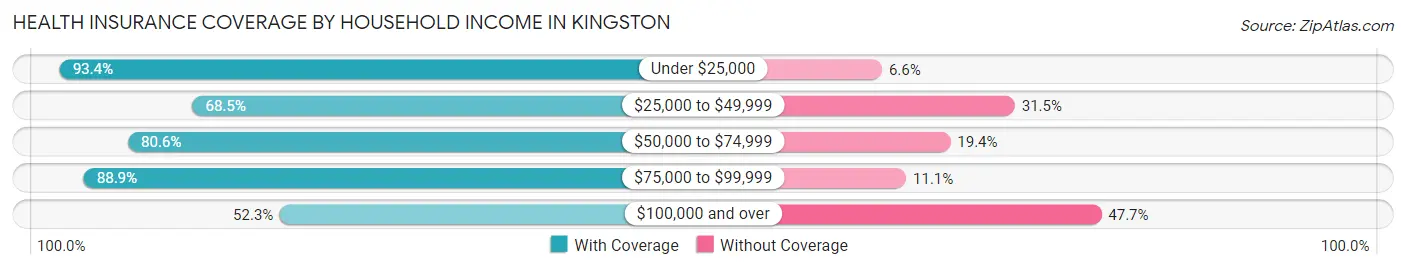
| Household Income | With Coverage | Without Coverage |
| Under $25,000 | 85 (93.4%) | 6 (6.6%) |
| $25,000 to $49,999 | 148 (68.5%) | 68 (31.5%) |
| $50,000 to $74,999 | 108 (80.6%) | 26 (19.4%) |
| $75,000 to $99,999 | 104 (88.9%) | 13 (11.1%) |
| $100,000 and over | 113 (52.3%) | 103 (47.7%) |
Public vs Private Health Insurance Coverage by Age in Kingston
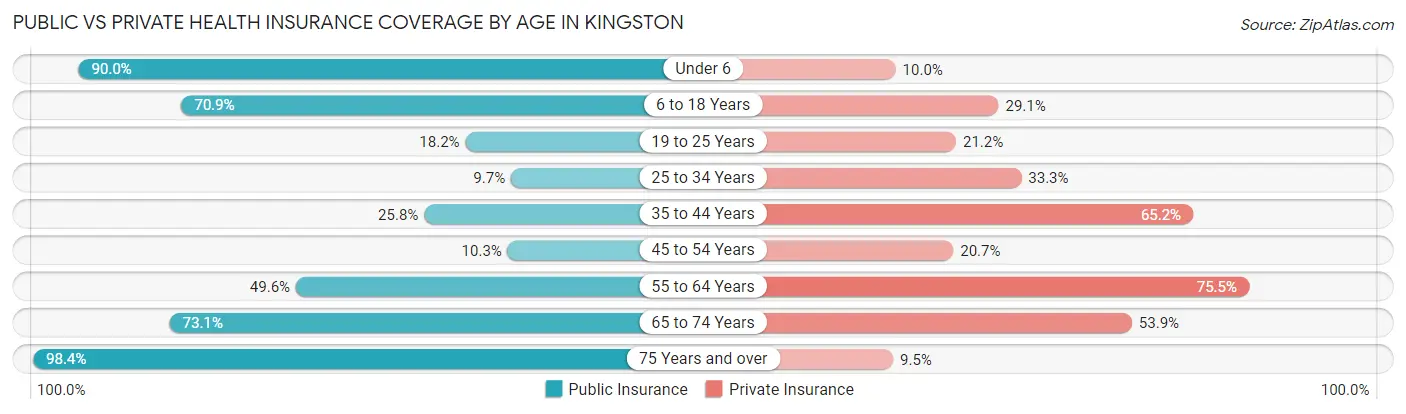
| Age Bracket | Public Insurance | Private Insurance |
| Under 6 | 36 (90.0%) | 4 (10.0%) |
| 6 to 18 Years | 95 (70.9%) | 39 (29.1%) |
| 19 to 25 Years | 12 (18.2%) | 14 (21.2%) |
| 25 to 34 Years | 7 (9.7%) | 24 (33.3%) |
| 35 to 44 Years | 23 (25.8%) | 58 (65.2%) |
| 45 to 54 Years | 15 (10.3%) | 30 (20.7%) |
| 55 to 64 Years | 69 (49.6%) | 105 (75.5%) |
| 65 to 74 Years | 19 (73.1%) | 14 (53.8%) |
| 75 Years and over | 62 (98.4%) | 6 (9.5%) |
| Total | 338 (43.7%) | 294 (38.0%) |
Disability Status by Sex by Age in Kingston
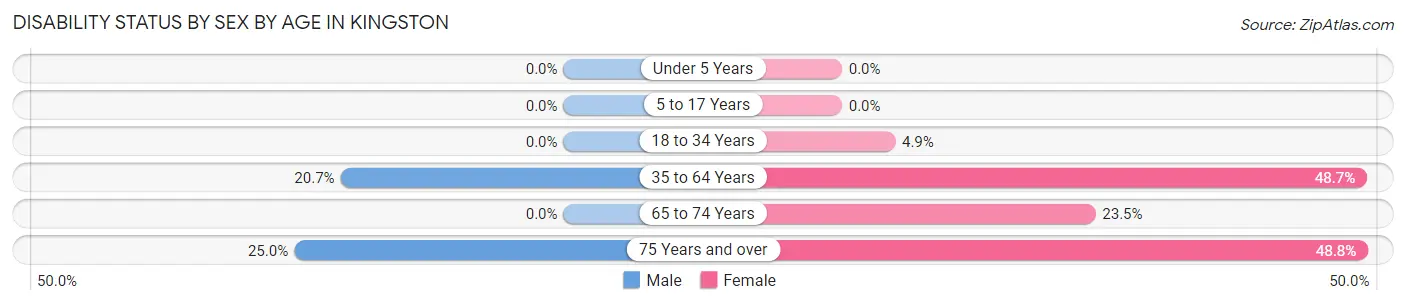
| Age Bracket | Male | Female |
| Under 5 Years | 0 (0.0%) | 0 (0.0%) |
| 5 to 17 Years | 0 (0.0%) | 0 (0.0%) |
| 18 to 34 Years | 0 (0.0%) | 4 (4.9%) |
| 35 to 64 Years | 36 (20.7%) | 97 (48.7%) |
| 65 to 74 Years | 0 (0.0%) | 4 (23.5%) |
| 75 Years and over | 5 (25.0%) | 21 (48.8%) |
Disability Class by Sex by Age in Kingston
Disability Class: Hearing Difficulty
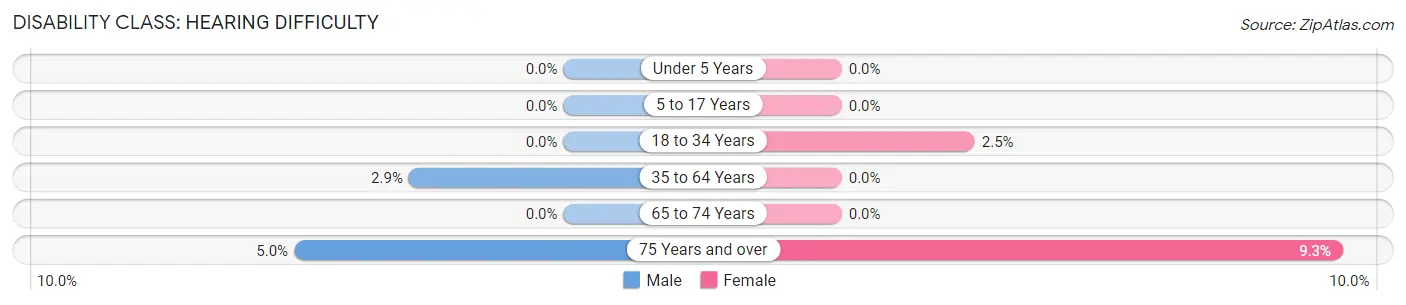
| Age Bracket | Male | Female |
| Under 5 Years | 0 (0.0%) | 0 (0.0%) |
| 5 to 17 Years | 0 (0.0%) | 0 (0.0%) |
| 18 to 34 Years | 0 (0.0%) | 2 (2.5%) |
| 35 to 64 Years | 5 (2.9%) | 0 (0.0%) |
| 65 to 74 Years | 0 (0.0%) | 0 (0.0%) |
| 75 Years and over | 1 (5.0%) | 4 (9.3%) |
Disability Class: Vision Difficulty
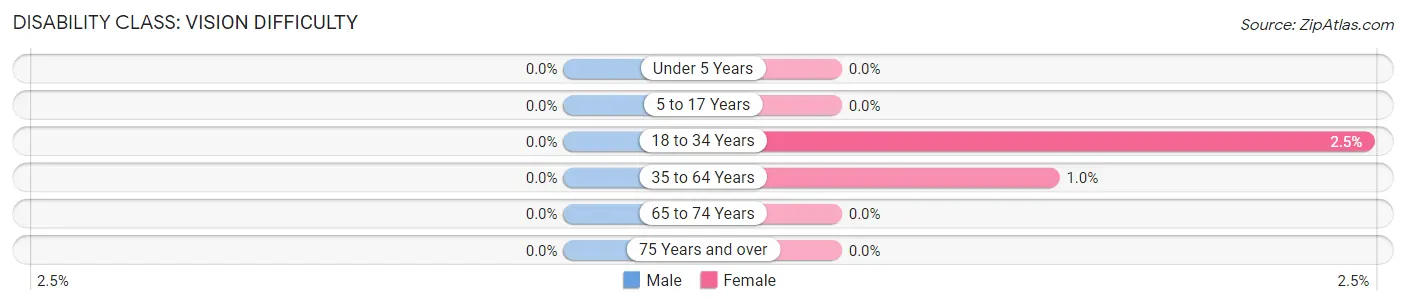
| Age Bracket | Male | Female |
| Under 5 Years | 0 (0.0%) | 0 (0.0%) |
| 5 to 17 Years | 0 (0.0%) | 0 (0.0%) |
| 18 to 34 Years | 0 (0.0%) | 2 (2.5%) |
| 35 to 64 Years | 0 (0.0%) | 2 (1.0%) |
| 65 to 74 Years | 0 (0.0%) | 0 (0.0%) |
| 75 Years and over | 0 (0.0%) | 0 (0.0%) |
Disability Class: Cognitive Difficulty
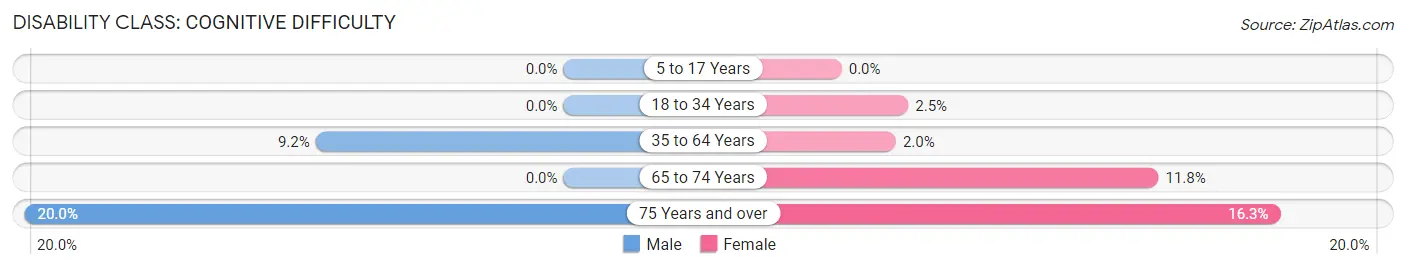
| Age Bracket | Male | Female |
| 5 to 17 Years | 0 (0.0%) | 0 (0.0%) |
| 18 to 34 Years | 0 (0.0%) | 2 (2.5%) |
| 35 to 64 Years | 16 (9.2%) | 4 (2.0%) |
| 65 to 74 Years | 0 (0.0%) | 2 (11.8%) |
| 75 Years and over | 4 (20.0%) | 7 (16.3%) |
Disability Class: Ambulatory Difficulty
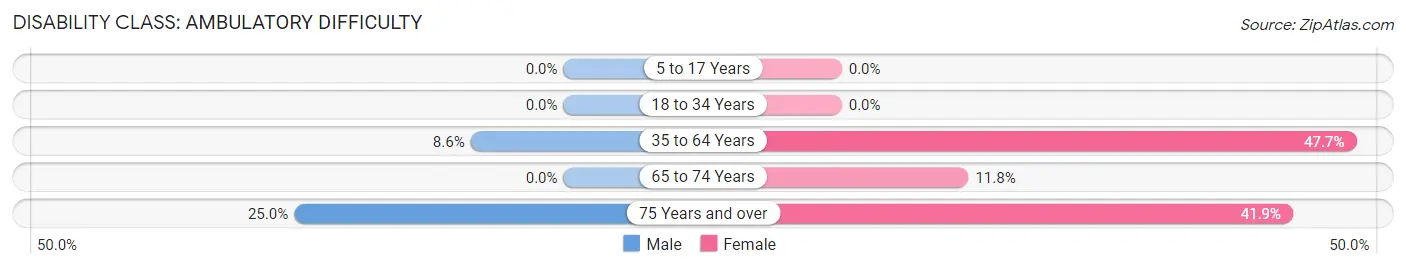
| Age Bracket | Male | Female |
| 5 to 17 Years | 0 (0.0%) | 0 (0.0%) |
| 18 to 34 Years | 0 (0.0%) | 0 (0.0%) |
| 35 to 64 Years | 15 (8.6%) | 95 (47.7%) |
| 65 to 74 Years | 0 (0.0%) | 2 (11.8%) |
| 75 Years and over | 5 (25.0%) | 18 (41.9%) |
Disability Class: Self-Care Difficulty
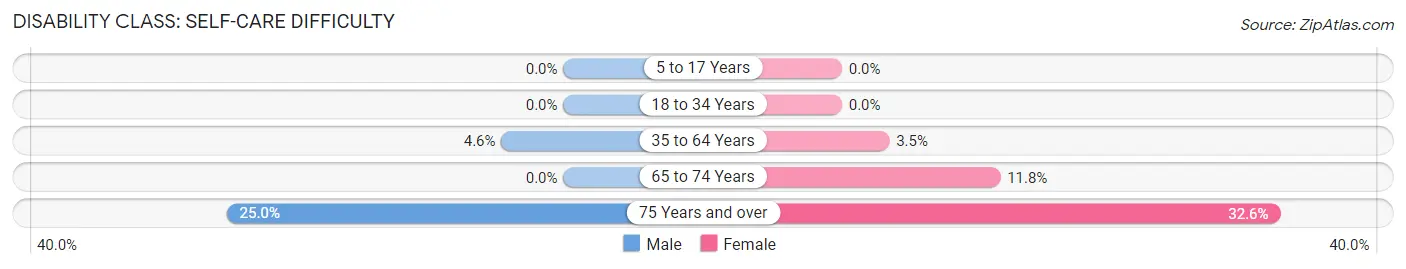
| Age Bracket | Male | Female |
| 5 to 17 Years | 0 (0.0%) | 0 (0.0%) |
| 18 to 34 Years | 0 (0.0%) | 0 (0.0%) |
| 35 to 64 Years | 8 (4.6%) | 7 (3.5%) |
| 65 to 74 Years | 0 (0.0%) | 2 (11.8%) |
| 75 Years and over | 5 (25.0%) | 14 (32.6%) |
Technology Access in Kingston
Computing Device Access in Kingston
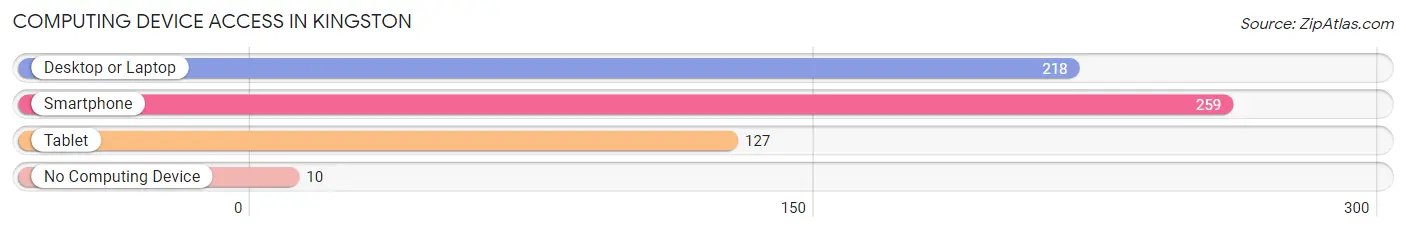
| Device Type | # Households | % Households |
| Desktop or Laptop | 218 | 79.0% |
| Smartphone | 259 | 93.8% |
| Tablet | 127 | 46.0% |
| No Computing Device | 10 | 3.6% |
| Total | 276 | 100.0% |
Internet Access in Kingston
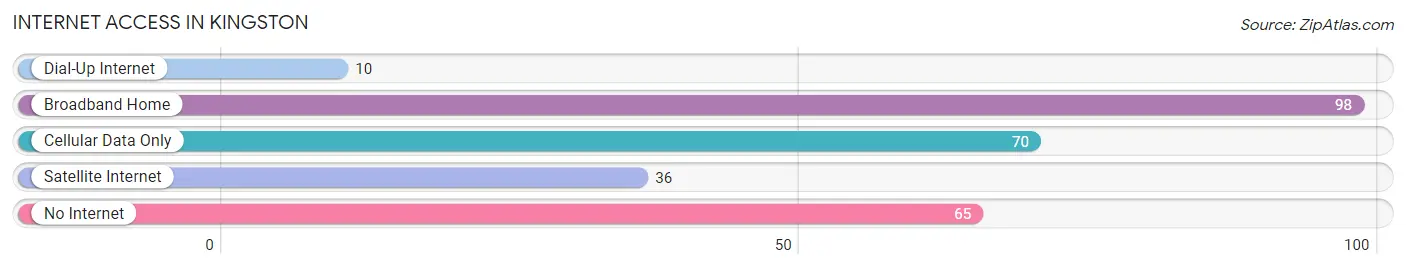
| Internet Type | # Households | % Households |
| Dial-Up Internet | 10 | 3.6% |
| Broadband Home | 98 | 35.5% |
| Cellular Data Only | 70 | 25.4% |
| Satellite Internet | 36 | 13.0% |
| No Internet | 65 | 23.5% |
| Total | 276 | 100.0% |
Kingston Summary
Kingston is a small city located in the state of Georgia, United States. It is situated in the southwestern part of the state, in Bartow County. The city has a population of approximately 2,000 people, according to the 2010 census.
History
The area that is now Kingston was first settled in the early 1800s by settlers from North Carolina. The town was originally known as Crossroads, due to its location at the intersection of two major roads. In 1832, the town was renamed Kingston after the nearby Kingston Plantation. The town was incorporated in 1887.
Geography
Kingston is located in the foothills of the Appalachian Mountains, in the southwestern part of Georgia. The city is situated at an elevation of 890 feet above sea level. The city is located at the intersection of two major roads, US Highway 411 and Georgia State Route 140. The city is surrounded by the cities of Cartersville, Adairsville, and White.
Economy
The economy of Kingston is largely based on agriculture and manufacturing. The city is home to several large farms, which produce a variety of crops, including corn, soybeans, and cotton. The city is also home to several manufacturing companies, which produce a variety of products, including furniture, textiles, and automotive parts.
Demographics
According to the 2010 census, the population of Kingston was 2,000. The racial makeup of the city was 79.2% White, 16.2% African American, 0.7% Native American, 0.7% Asian, and 3.2% from other races. The median household income was $37,500, and the median family income was $45,000.
Conclusion
Kingston is a small city located in the state of Georgia, United States. It is situated in the southwestern part of the state, in Bartow County. The city has a population of approximately 2,000 people, according to the 2010 census. The economy of Kingston is largely based on agriculture and manufacturing, and the city is home to several large farms and manufacturing companies. The racial makeup of the city was 79.2% White, 16.2% African American, 0.7% Native American, 0.7% Asian, and 3.2% from other races. The median household income was $37,500, and the median family income was $45,000.
Common Questions
What is Per Capita Income in Kingston?
Per Capita income in Kingston is $20,525.
What is the Median Family Income in Kingston?
Median Family Income in Kingston is $48,750.
What is the Median Household income in Kingston?
Median Household Income in Kingston is $50,000.
What is Income or Wage Gap in Kingston?
Income or Wage Gap in Kingston is 66.6%.
Women in Kingston earn 33.4 cents for every dollar earned by a man.
What is Inequality or Gini Index in Kingston?
Inequality or Gini Index in Kingston is 0.45.
What is the Total Population of Kingston?
Total Population of Kingston is 774.
What is the Total Male Population of Kingston?
Total Male Population of Kingston is 318.
What is the Total Female Population of Kingston?
Total Female Population of Kingston is 456.
What is the Ratio of Males per 100 Females in Kingston?
There are 69.74 Males per 100 Females in Kingston.
What is the Ratio of Females per 100 Males in Kingston?
There are 143.40 Females per 100 Males in Kingston.
What is the Median Population Age in Kingston?
Median Population Age in Kingston is 43.3 Years.
What is the Average Family Size in Kingston
Average Family Size in Kingston is 3.9 People.
What is the Average Household Size in Kingston
Average Household Size in Kingston is 2.8 People.
How Large is the Labor Force in Kingston?
There are 389 People in the Labor Forcein in Kingston.
What is the Percentage of People in the Labor Force in Kingston?
60.9% of People are in the Labor Force in Kingston.
What is the Unemployment Rate in Kingston?
Unemployment Rate in Kingston is 9.0%.