Nicholson, GA Map & Demographics
Nicholson Map
Nicholson Overview
$21,218
PER CAPITA INCOME
$57,875
AVG FAMILY INCOME
$50,000
AVG HOUSEHOLD INCOME
15.1%
WAGE / INCOME GAP [ % ]
84.9¢/ $1
WAGE / INCOME GAP [ $ ]
0.34
INEQUALITY / GINI INDEX
2,067
TOTAL POPULATION
1,089
MALE POPULATION
978
FEMALE POPULATION
111.35
MALES / 100 FEMALES
89.81
FEMALES / 100 MALES
34.2
MEDIAN AGE
3.4
AVG FAMILY SIZE
2.9
AVG HOUSEHOLD SIZE
1,094
LABOR FORCE [ PEOPLE ]
67.3%
PERCENT IN LABOR FORCE
12.2%
UNEMPLOYMENT RATE
Nicholson Zip Codes
Nicholson Area Codes
Income in Nicholson
Income Overview in Nicholson
Per Capita Income in Nicholson is $21,218, while median incomes of families and households are $57,875 and $50,000 respectively.
| Characteristic | Number | Measure |
| Per Capita Income | 2,067 | $21,218 |
| Median Family Income | 508 | $57,875 |
| Mean Family Income | 508 | $65,343 |
| Median Household Income | 710 | $50,000 |
| Mean Household Income | 710 | $61,083 |
| Income Deficit | 508 | $0 |
| Wage / Income Gap (%) | 2,067 | 15.06% |
| Wage / Income Gap ($) | 2,067 | 84.94¢ per $1 |
| Gini / Inequality Index | 2,067 | 0.34 |
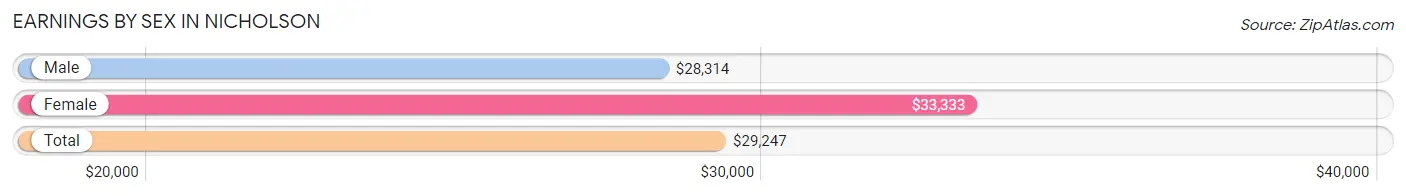
Earnings by Sex in Nicholson
Average Earnings in Nicholson are $29,247, $28,314 for men and $33,333 for women, a difference of 15.1%.
| Sex | Number | Average Earnings |
| Male | 600 (54.7%) | $28,314 |
| Female | 496 (45.3%) | $33,333 |
| Total | 1,096 (100.0%) | $29,247 |
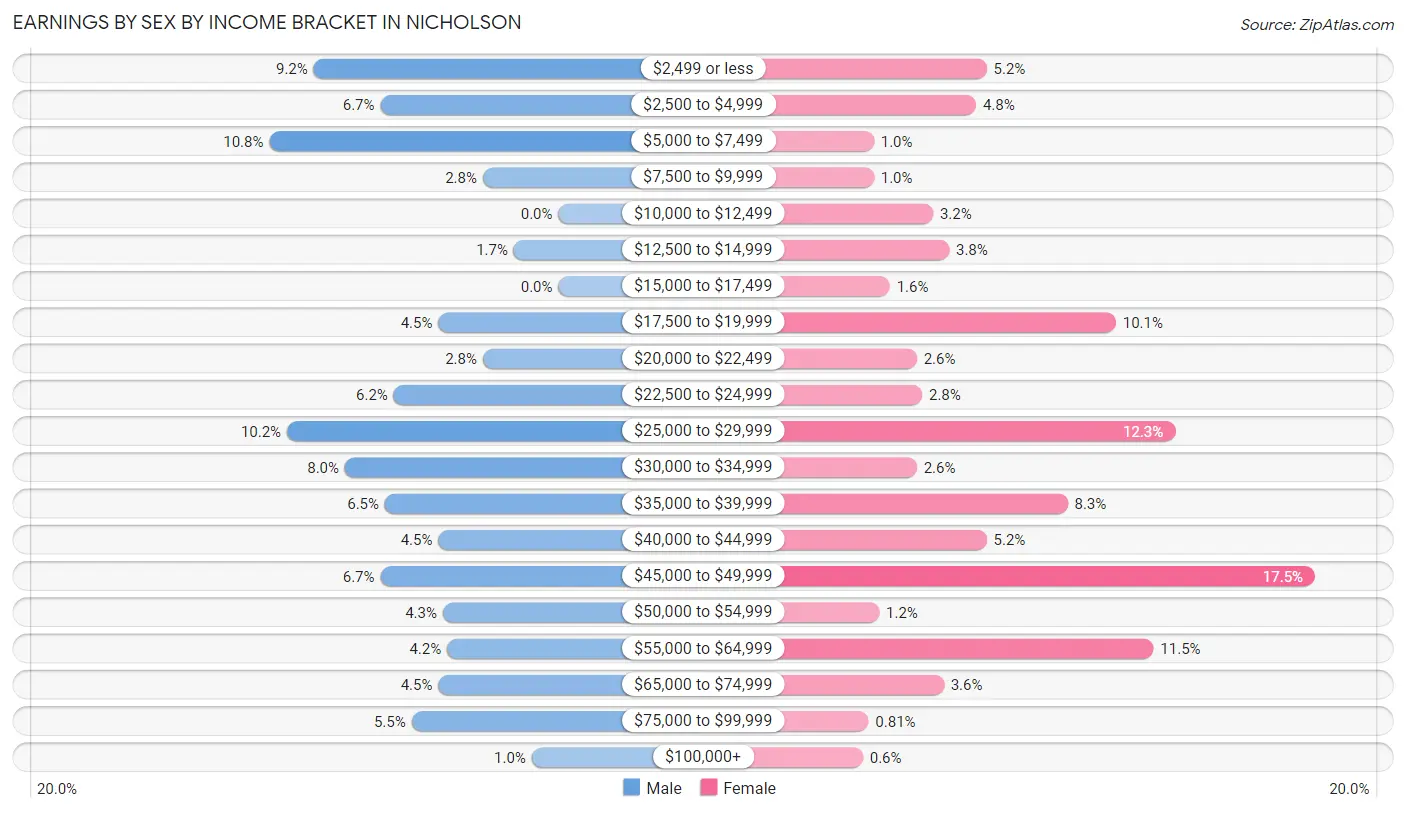
Earnings by Sex by Income Bracket in Nicholson
The most common earnings brackets in Nicholson are $5,000 to $7,499 for men (65 | 10.8%) and $45,000 to $49,999 for women (87 | 17.5%).
| Income | Male | Female |
| $2,499 or less | 55 (9.2%) | 26 (5.2%) |
| $2,500 to $4,999 | 40 (6.7%) | 24 (4.8%) |
| $5,000 to $7,499 | 65 (10.8%) | 5 (1.0%) |
| $7,500 to $9,999 | 17 (2.8%) | 5 (1.0%) |
| $10,000 to $12,499 | 0 (0.0%) | 16 (3.2%) |
| $12,500 to $14,999 | 10 (1.7%) | 19 (3.8%) |
| $15,000 to $17,499 | 0 (0.0%) | 8 (1.6%) |
| $17,500 to $19,999 | 27 (4.5%) | 50 (10.1%) |
| $20,000 to $22,499 | 17 (2.8%) | 13 (2.6%) |
| $22,500 to $24,999 | 37 (6.2%) | 14 (2.8%) |
| $25,000 to $29,999 | 61 (10.2%) | 61 (12.3%) |
| $30,000 to $34,999 | 48 (8.0%) | 13 (2.6%) |
| $35,000 to $39,999 | 39 (6.5%) | 41 (8.3%) |
| $40,000 to $44,999 | 27 (4.5%) | 26 (5.2%) |
| $45,000 to $49,999 | 40 (6.7%) | 87 (17.5%) |
| $50,000 to $54,999 | 26 (4.3%) | 6 (1.2%) |
| $55,000 to $64,999 | 25 (4.2%) | 57 (11.5%) |
| $65,000 to $74,999 | 27 (4.5%) | 18 (3.6%) |
| $75,000 to $99,999 | 33 (5.5%) | 4 (0.8%) |
| $100,000+ | 6 (1.0%) | 3 (0.6%) |
| Total | 600 (100.0%) | 496 (100.0%) |
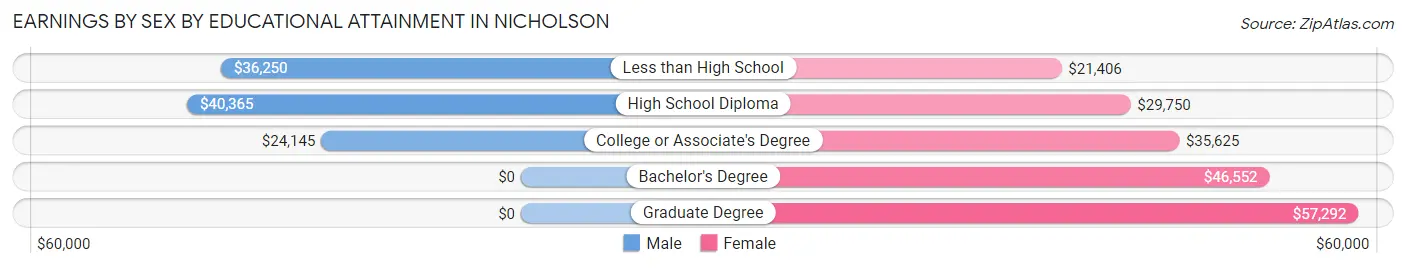
Earnings by Sex by Educational Attainment in Nicholson
Average earnings in Nicholson are $28,692 for men and $37,375 for women, a difference of 23.2%. Men with an educational attainment of high school diploma enjoy the highest average annual earnings of $40,365, while those with college or associate's degree education earn the least with $24,145. Women with an educational attainment of graduate degree earn the most with the average annual earnings of $57,292, while those with less than high school education have the smallest earnings of $21,406.
| Educational Attainment | Male Income | Female Income |
| Less than High School | $36,250 | $21,406 |
| High School Diploma | $40,365 | $29,750 |
| College or Associate's Degree | $24,145 | $35,625 |
| Bachelor's Degree | - | - |
| Graduate Degree | - | - |
| Total | $28,692 | $37,375 |
Family Income in Nicholson
Family Income Brackets in Nicholson
According to the Nicholson family income data, there are 118 families falling into the $35,000 to $49,999 income range, which is the most common income bracket and makes up 23.2% of all families.
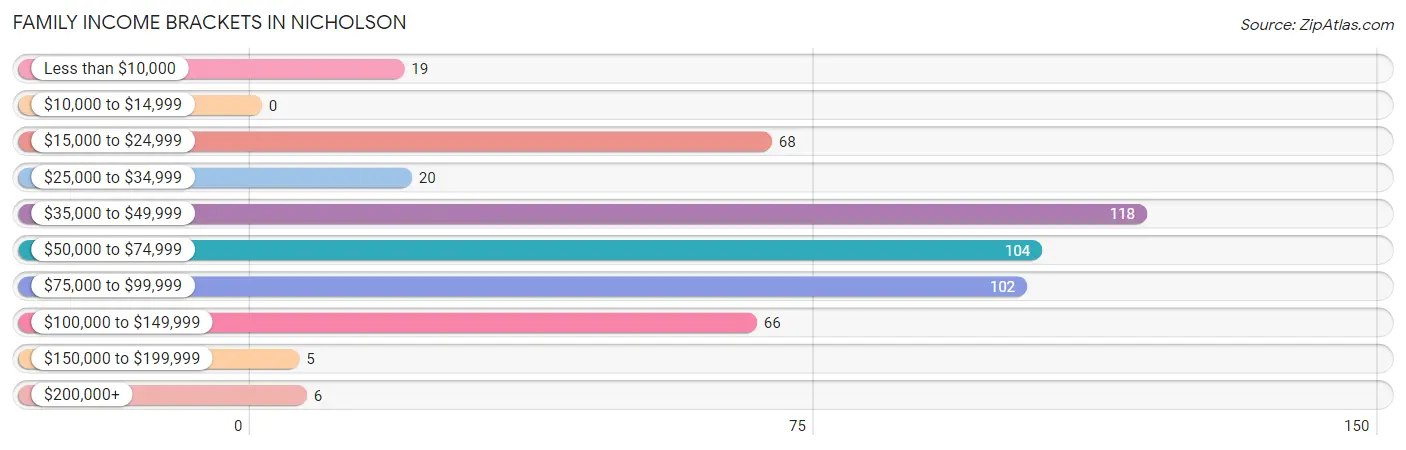
| Income Bracket | # Families | % Families |
| Less than $10,000 | 19 | 3.7% |
| $10,000 to $14,999 | 0 | 0.0% |
| $15,000 to $24,999 | 68 | 13.4% |
| $25,000 to $34,999 | 20 | 3.9% |
| $35,000 to $49,999 | 118 | 23.2% |
| $50,000 to $74,999 | 104 | 20.5% |
| $75,000 to $99,999 | 102 | 20.1% |
| $100,000 to $149,999 | 66 | 13.0% |
| $150,000 to $199,999 | 5 | 1.0% |
| $200,000+ | 6 | 1.2% |
Family Income by Famaliy Size in Nicholson
6-person families (13 | 2.6%) account for the highest median family income in Nicholson with $131,458 per family, while 6-person families (13 | 2.6%) have the highest median income of $21,910 per family member.
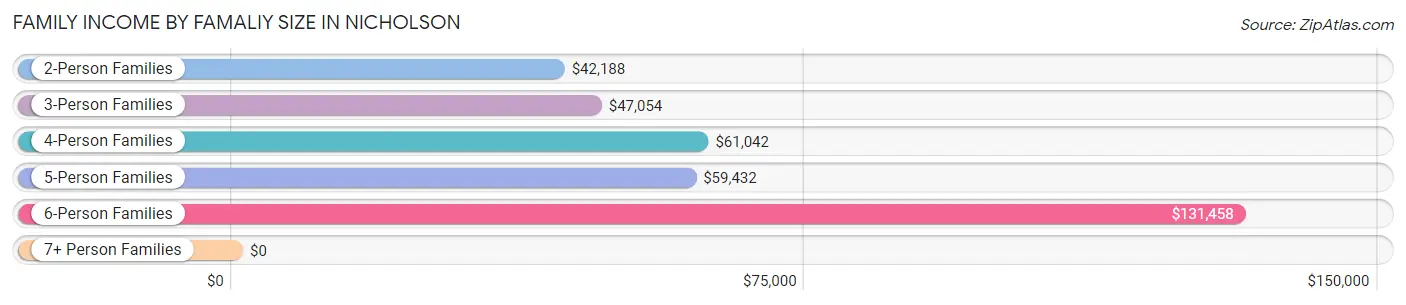
| Income Bracket | # Families | Median Income |
| 2-Person Families | 202 (39.8%) | $42,188 |
| 3-Person Families | 92 (18.1%) | $47,054 |
| 4-Person Families | 126 (24.8%) | $61,042 |
| 5-Person Families | 75 (14.8%) | $59,432 |
| 6-Person Families | 13 (2.6%) | $131,458 |
| 7+ Person Families | 0 (0.0%) | $0 |
| Total | 508 (100.0%) | $57,875 |
Family Income by Number of Earners in Nicholson
The median family income in Nicholson is $57,875, with families comprising 3+ earners (86) having the highest median family income of $86,481, while families with 1 earner (209) have the lowest median family income of $45,531, accounting for 16.9% and 41.1% of families, respectively.
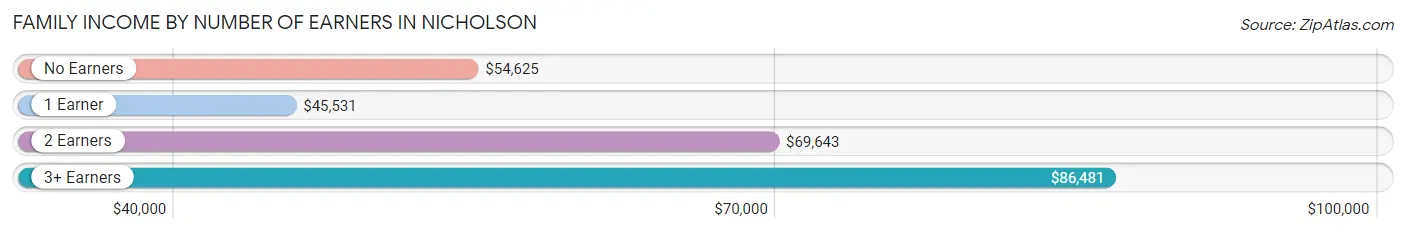
| Number of Earners | # Families | Median Income |
| No Earners | 49 (9.7%) | $54,625 |
| 1 Earner | 209 (41.1%) | $45,531 |
| 2 Earners | 164 (32.3%) | $69,643 |
| 3+ Earners | 86 (16.9%) | $86,481 |
| Total | 508 (100.0%) | $57,875 |
Household Income in Nicholson
Household Income Brackets in Nicholson
With 182 households falling in the category, the $35,000 to $49,999 income range is the most frequent in Nicholson, accounting for 25.6% of all households.
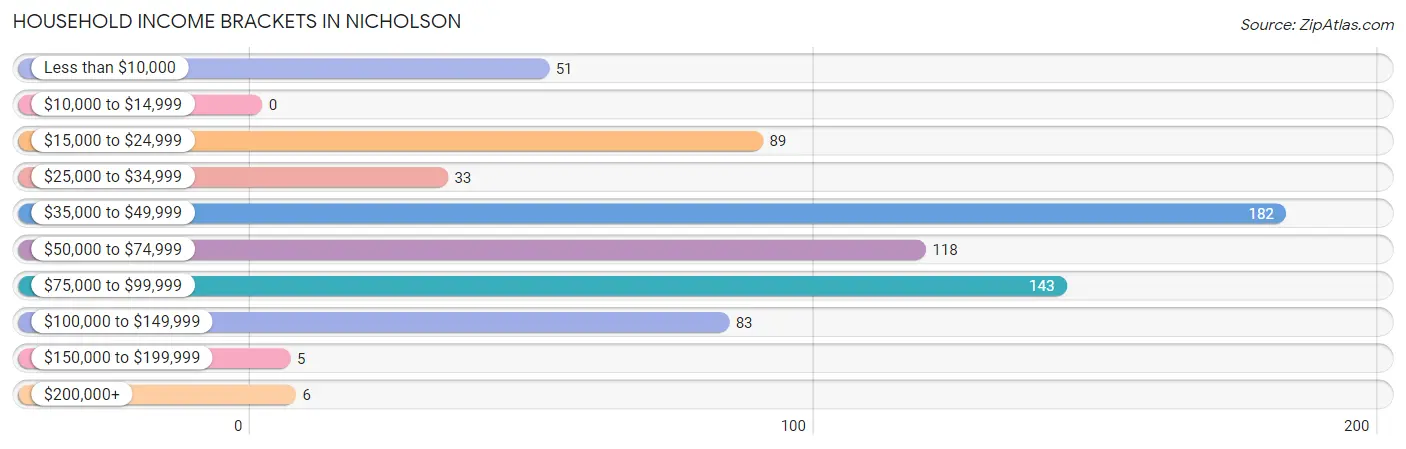
| Income Bracket | # Households | % Households |
| Less than $10,000 | 51 | 7.2% |
| $10,000 to $14,999 | 0 | 0.0% |
| $15,000 to $24,999 | 89 | 12.5% |
| $25,000 to $34,999 | 33 | 4.6% |
| $35,000 to $49,999 | 182 | 25.6% |
| $50,000 to $74,999 | 118 | 16.6% |
| $75,000 to $99,999 | 143 | 20.1% |
| $100,000 to $149,999 | 83 | 11.7% |
| $150,000 to $199,999 | 5 | 0.7% |
| $200,000+ | 6 | 0.8% |
Household Income by Householder Age in Nicholson
The median household income in Nicholson is $50,000, with the highest median household income of $55,938 found in the 45 to 64 years age bracket for the primary householder. A total of 318 households (44.8%) fall into this category. Meanwhile, the 15 to 24 years age bracket for the primary householder has the lowest median household income of $0, with 32 households (4.5%) in this group.
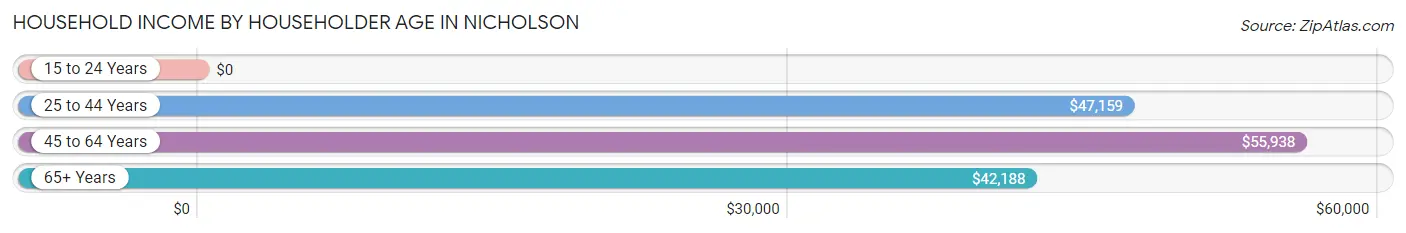
| Income Bracket | # Households | Median Income |
| 15 to 24 Years | 32 (4.5%) | $0 |
| 25 to 44 Years | 297 (41.8%) | $47,159 |
| 45 to 64 Years | 318 (44.8%) | $55,938 |
| 65+ Years | 63 (8.9%) | $42,188 |
| Total | 710 (100.0%) | $50,000 |
Poverty in Nicholson
Income Below Poverty by Sex and Age in Nicholson
With 9.4% poverty level for males and 8.4% for females among the residents of Nicholson, 65 to 74 year old males and 15 year old females are the most vulnerable to poverty, with 25 males (41.0%) and 8 females (27.6%) in their respective age groups living below the poverty level.
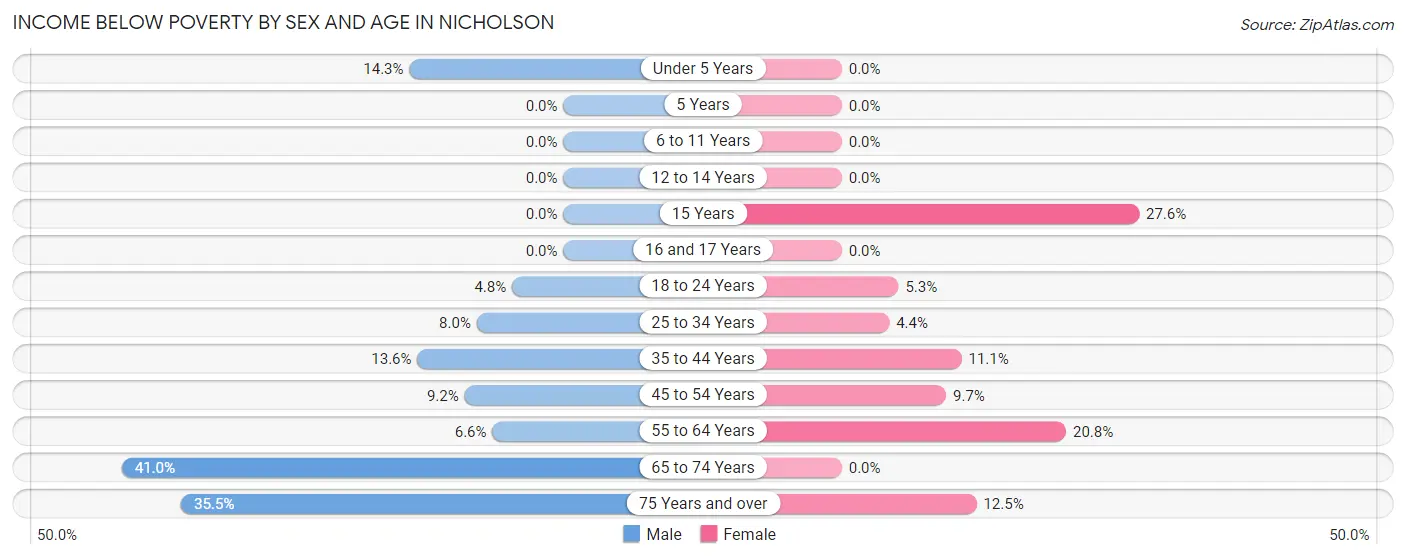
| Age Bracket | Male | Female |
| Under 5 Years | 7 (14.3%) | 0 (0.0%) |
| 5 Years | 0 (0.0%) | 0 (0.0%) |
| 6 to 11 Years | 0 (0.0%) | 0 (0.0%) |
| 12 to 14 Years | 0 (0.0%) | 0 (0.0%) |
| 15 Years | 0 (0.0%) | 8 (27.6%) |
| 16 and 17 Years | 0 (0.0%) | 0 (0.0%) |
| 18 to 24 Years | 4 (4.8%) | 4 (5.3%) |
| 25 to 34 Years | 18 (8.0%) | 8 (4.4%) |
| 35 to 44 Years | 21 (13.6%) | 11 (11.1%) |
| 45 to 54 Years | 10 (9.2%) | 15 (9.7%) |
| 55 to 64 Years | 6 (6.6%) | 31 (20.8%) |
| 65 to 74 Years | 25 (41.0%) | 0 (0.0%) |
| 75 Years and over | 11 (35.5%) | 5 (12.5%) |
| Total | 102 (9.4%) | 82 (8.4%) |
Income Above Poverty by Sex and Age in Nicholson
According to the poverty statistics in Nicholson, males aged 5 years and females aged under 5 years are the age groups that are most secure financially, with 100.0% of males and 100.0% of females in these age groups living above the poverty line.
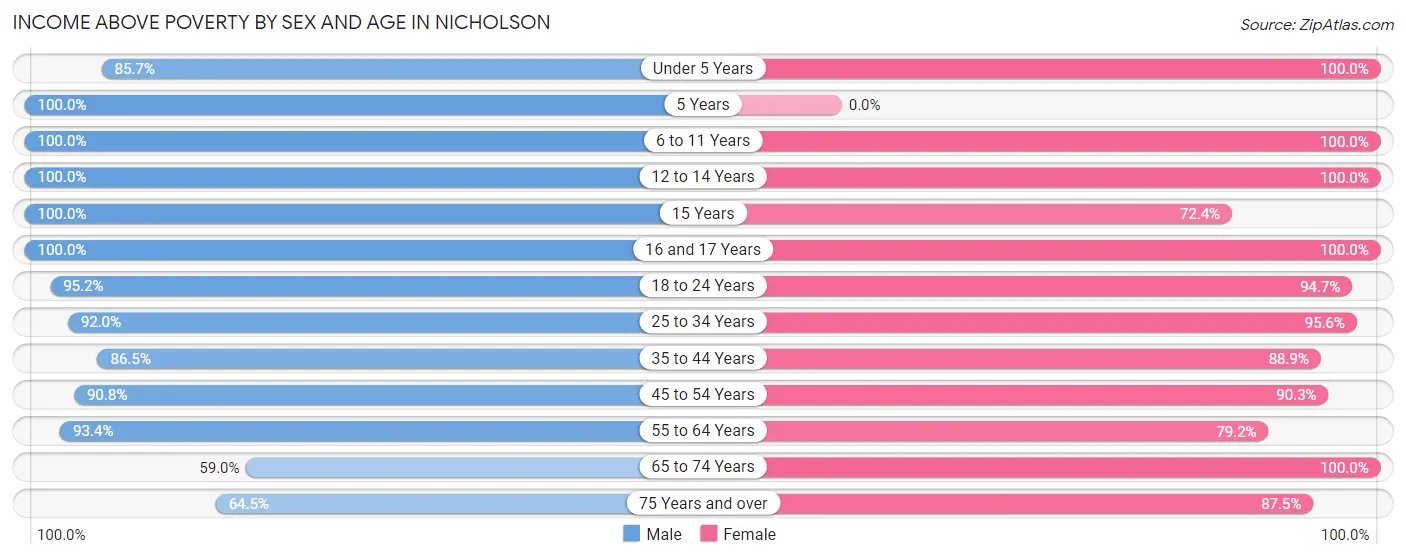
| Age Bracket | Male | Female |
| Under 5 Years | 42 (85.7%) | 18 (100.0%) |
| 5 Years | 31 (100.0%) | 0 (0.0%) |
| 6 to 11 Years | 130 (100.0%) | 76 (100.0%) |
| 12 to 14 Years | 59 (100.0%) | 40 (100.0%) |
| 15 Years | 5 (100.0%) | 21 (72.4%) |
| 16 and 17 Years | 55 (100.0%) | 35 (100.0%) |
| 18 to 24 Years | 80 (95.2%) | 72 (94.7%) |
| 25 to 34 Years | 206 (92.0%) | 174 (95.6%) |
| 35 to 44 Years | 134 (86.5%) | 88 (88.9%) |
| 45 to 54 Years | 99 (90.8%) | 140 (90.3%) |
| 55 to 64 Years | 85 (93.4%) | 118 (79.2%) |
| 65 to 74 Years | 36 (59.0%) | 79 (100.0%) |
| 75 Years and over | 20 (64.5%) | 35 (87.5%) |
| Total | 982 (90.6%) | 896 (91.6%) |
Income Below Poverty Among Married-Couple Families in Nicholson
The poverty statistics for married-couple families in Nicholson show that 5.2% or 16 of the total 306 families live below the poverty line. Families with no children have the highest poverty rate of 10.2%, comprising of 16 families. On the other hand, families with 1 or 2 children have the lowest poverty rate of 0.0%, which includes 0 families.
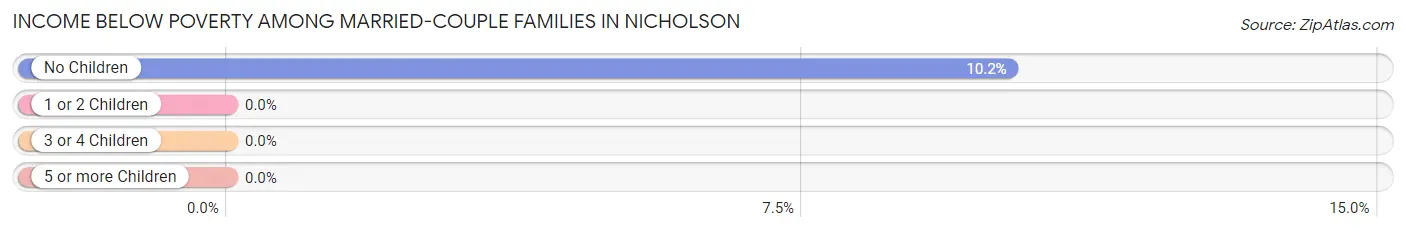
| Children | Above Poverty | Below Poverty |
| No Children | 141 (89.8%) | 16 (10.2%) |
| 1 or 2 Children | 117 (100.0%) | 0 (0.0%) |
| 3 or 4 Children | 32 (100.0%) | 0 (0.0%) |
| 5 or more Children | 0 (0.0%) | 0 (0.0%) |
| Total | 290 (94.8%) | 16 (5.2%) |
Income Below Poverty Among Single-Parent Households in Nicholson
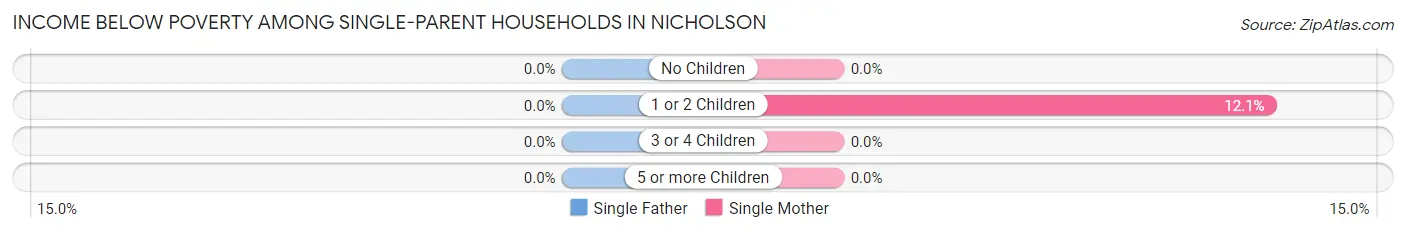
| Children | Single Father | Single Mother |
| No Children | 0 (0.0%) | 0 (0.0%) |
| 1 or 2 Children | 0 (0.0%) | 11 (12.1%) |
| 3 or 4 Children | 0 (0.0%) | 0 (0.0%) |
| 5 or more Children | 0 (0.0%) | 0 (0.0%) |
| Total | 0 (0.0%) | 11 (8.0%) |
Income Below Poverty Among Married-Couple vs Single-Parent Households in Nicholson
The poverty data for Nicholson shows that 16 of the married-couple family households (5.2%) and 11 of the single-parent households (5.4%) are living below the poverty level. Within the married-couple family households, those with no children have the highest poverty rate, with 16 households (10.2%) falling below the poverty line. Among the single-parent households, those with 1 or 2 children have the highest poverty rate, with 11 household (11.5%) living below poverty.
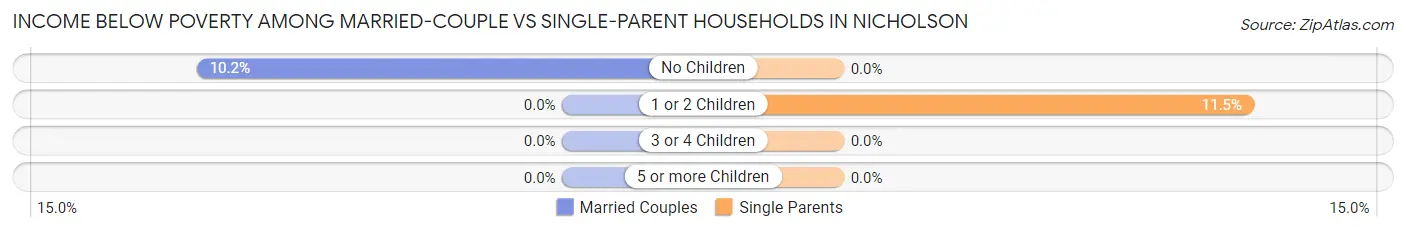
| Children | Married-Couple Families | Single-Parent Households |
| No Children | 16 (10.2%) | 0 (0.0%) |
| 1 or 2 Children | 0 (0.0%) | 11 (11.5%) |
| 3 or 4 Children | 0 (0.0%) | 0 (0.0%) |
| 5 or more Children | 0 (0.0%) | 0 (0.0%) |
| Total | 16 (5.2%) | 11 (5.4%) |
Race in Nicholson
The most populous races in Nicholson are White / Caucasian (1,633 | 79.0%), Hispanic or Latino (421 | 20.4%), and Two or more Races (234 | 11.3%).
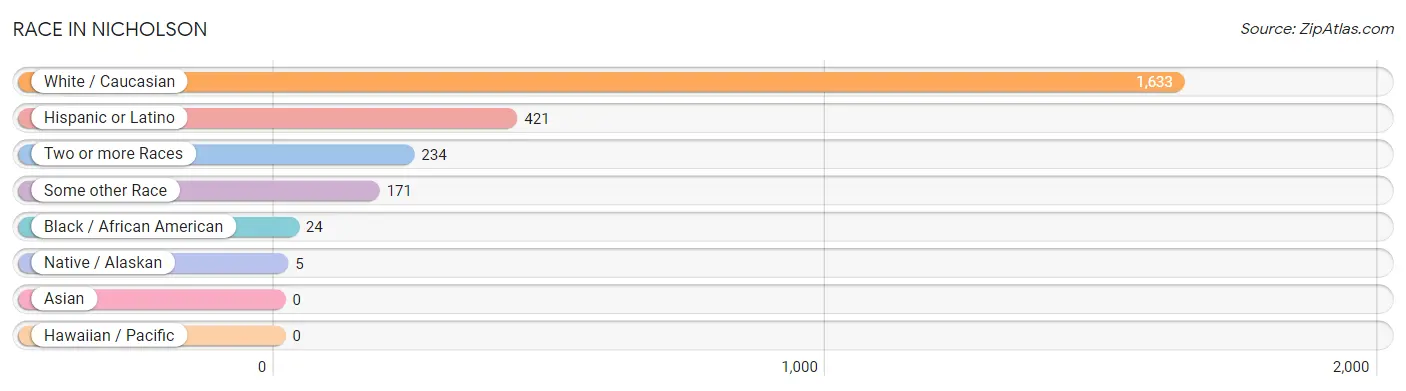
| Race | # Population | % Population |
| Asian | 0 | 0.0% |
| Black / African American | 24 | 1.2% |
| Hawaiian / Pacific | 0 | 0.0% |
| Hispanic or Latino | 421 | 20.4% |
| Native / Alaskan | 5 | 0.2% |
| White / Caucasian | 1,633 | 79.0% |
| Two or more Races | 234 | 11.3% |
| Some other Race | 171 | 8.3% |
| Total | 2,067 | 100.0% |
Ancestry in Nicholson
The most populous ancestries reported in Nicholson are Mexican (408 | 19.7%), English (242 | 11.7%), American (188 | 9.1%), German (175 | 8.5%), and Irish (148 | 7.2%), together accounting for 56.2% of all Nicholson residents.
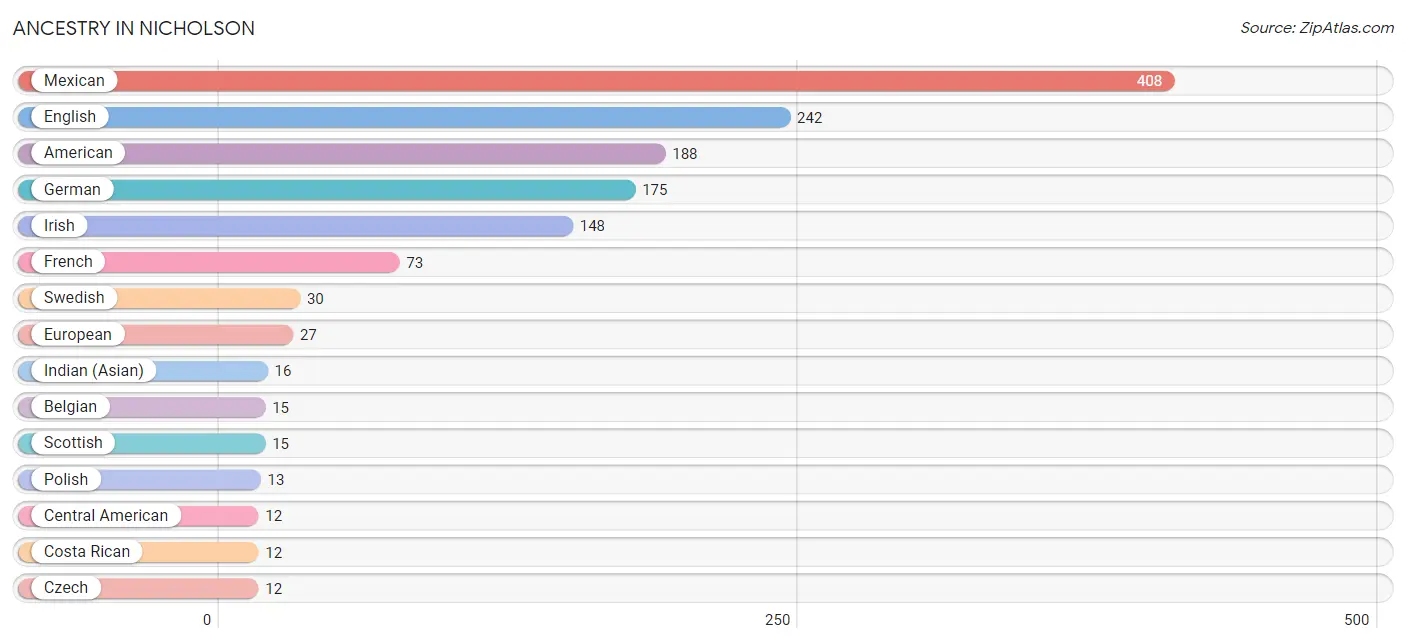
| Ancestry | # Population | % Population |
| American | 188 | 9.1% |
| Belgian | 15 | 0.7% |
| British | 9 | 0.4% |
| Burmese | 6 | 0.3% |
| Central American | 12 | 0.6% |
| Costa Rican | 12 | 0.6% |
| Czech | 12 | 0.6% |
| Dutch | 11 | 0.5% |
| English | 242 | 11.7% |
| European | 27 | 1.3% |
| French | 73 | 3.5% |
| French Canadian | 12 | 0.6% |
| German | 175 | 8.5% |
| Hungarian | 5 | 0.2% |
| Indian (Asian) | 16 | 0.8% |
| Irish | 148 | 7.2% |
| Italian | 10 | 0.5% |
| Mexican | 408 | 19.7% |
| Mexican American Indian | 5 | 0.2% |
| Polish | 13 | 0.6% |
| Puerto Rican | 1 | 0.1% |
| Scandinavian | 3 | 0.2% |
| Scotch-Irish | 9 | 0.4% |
| Scottish | 15 | 0.7% |
| Swedish | 30 | 1.5% | View All 25 Rows |
Immigrants in Nicholson
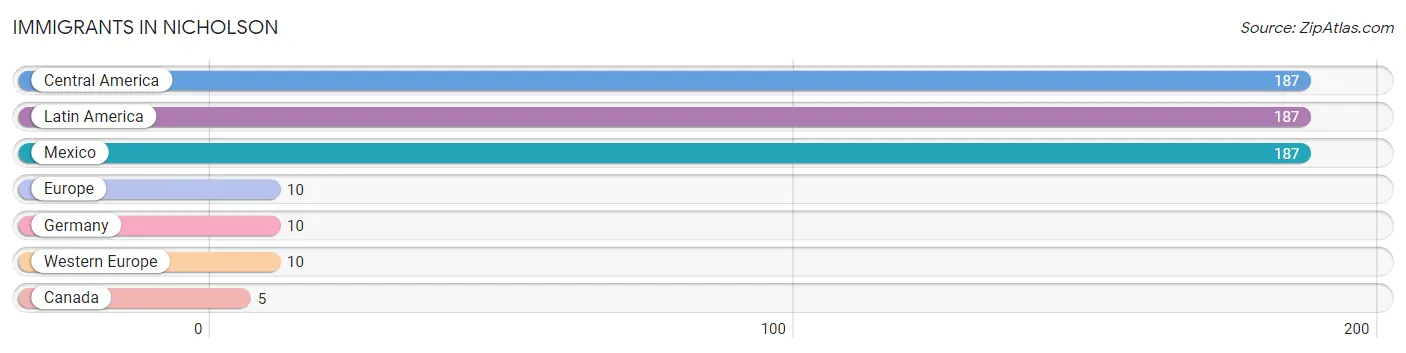
The most numerous immigrant groups reported in Nicholson came from Central America (187 | 9.0%), Latin America (187 | 9.0%), Mexico (187 | 9.0%), Europe (10 | 0.5%), and Germany (10 | 0.5%), together accounting for 28.1% of all Nicholson residents.
| Immigration Origin | # Population | % Population |
| Canada | 5 | 0.2% |
| Central America | 187 | 9.0% |
| Europe | 10 | 0.5% |
| Germany | 10 | 0.5% |
| Latin America | 187 | 9.0% |
| Mexico | 187 | 9.0% |
| Western Europe | 10 | 0.5% | View All 7 Rows |
Sex and Age in Nicholson
Sex and Age in Nicholson
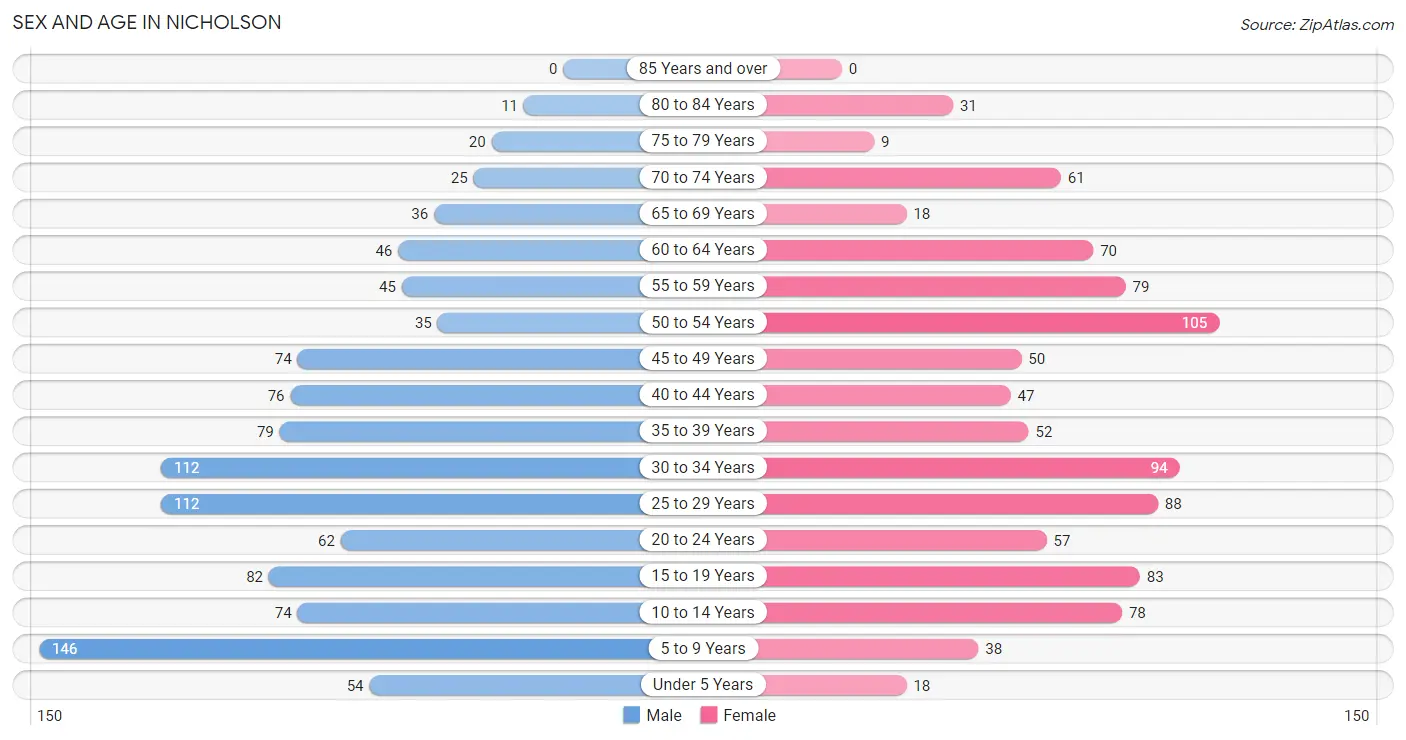
The most populous age groups in Nicholson are 5 to 9 Years (146 | 13.4%) for men and 50 to 54 Years (105 | 10.7%) for women.
| Age Bracket | Male | Female |
| Under 5 Years | 54 (5.0%) | 18 (1.8%) |
| 5 to 9 Years | 146 (13.4%) | 38 (3.9%) |
| 10 to 14 Years | 74 (6.8%) | 78 (8.0%) |
| 15 to 19 Years | 82 (7.5%) | 83 (8.5%) |
| 20 to 24 Years | 62 (5.7%) | 57 (5.8%) |
| 25 to 29 Years | 112 (10.3%) | 88 (9.0%) |
| 30 to 34 Years | 112 (10.3%) | 94 (9.6%) |
| 35 to 39 Years | 79 (7.2%) | 52 (5.3%) |
| 40 to 44 Years | 76 (7.0%) | 47 (4.8%) |
| 45 to 49 Years | 74 (6.8%) | 50 (5.1%) |
| 50 to 54 Years | 35 (3.2%) | 105 (10.7%) |
| 55 to 59 Years | 45 (4.1%) | 79 (8.1%) |
| 60 to 64 Years | 46 (4.2%) | 70 (7.2%) |
| 65 to 69 Years | 36 (3.3%) | 18 (1.8%) |
| 70 to 74 Years | 25 (2.3%) | 61 (6.2%) |
| 75 to 79 Years | 20 (1.8%) | 9 (0.9%) |
| 80 to 84 Years | 11 (1.0%) | 31 (3.2%) |
| 85 Years and over | 0 (0.0%) | 0 (0.0%) |
| Total | 1,089 (100.0%) | 978 (100.0%) |
Families and Households in Nicholson
Median Family Size in Nicholson
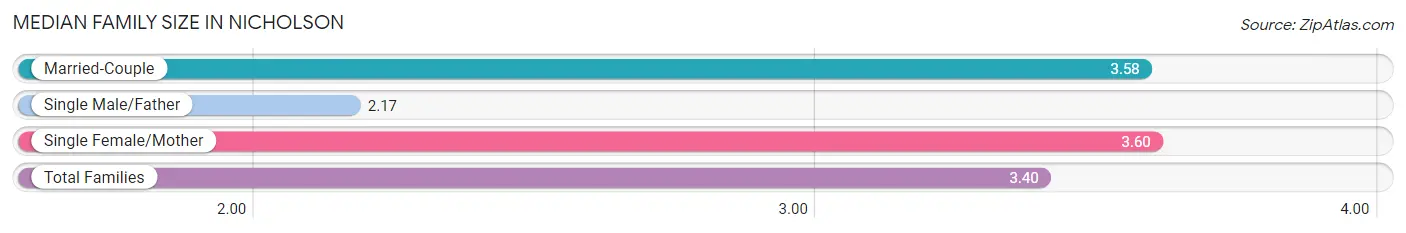
The median family size in Nicholson is 3.40 persons per family, with single female/mother families (137 | 27.0%) accounting for the largest median family size of 3.6 persons per family. On the other hand, single male/father families (65 | 12.8%) represent the smallest median family size with 2.17 persons per family.
| Family Type | # Families | Family Size |
| Married-Couple | 306 (60.2%) | 3.58 |
| Single Male/Father | 65 (12.8%) | 2.17 |
| Single Female/Mother | 137 (27.0%) | 3.60 |
| Total Families | 508 (100.0%) | 3.40 |
Median Household Size in Nicholson
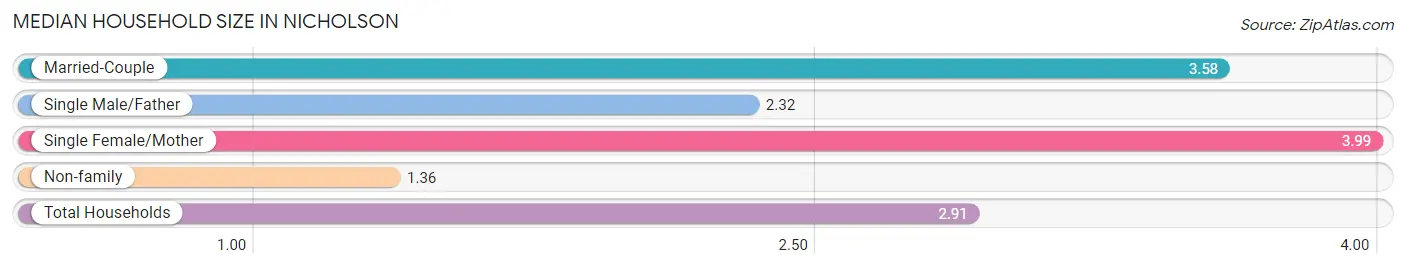
The median household size in Nicholson is 2.91 persons per household, with single female/mother households (137 | 19.3%) accounting for the largest median household size of 3.99 persons per household. non-family households (202 | 28.4%) represent the smallest median household size with 1.36 persons per household.
| Household Type | # Households | Household Size |
| Married-Couple | 306 (43.1%) | 3.58 |
| Single Male/Father | 65 (9.1%) | 2.32 |
| Single Female/Mother | 137 (19.3%) | 3.99 |
| Non-family | 202 (28.4%) | 1.36 |
| Total Households | 710 (100.0%) | 2.91 |
Household Size by Marriage Status in Nicholson
Out of a total of 710 households in Nicholson, 508 (71.6%) are family households, while 202 (28.4%) are nonfamily households. The most numerous type of family households are 2-person households, comprising 201, and the most common type of nonfamily households are 1-person households, comprising 146.
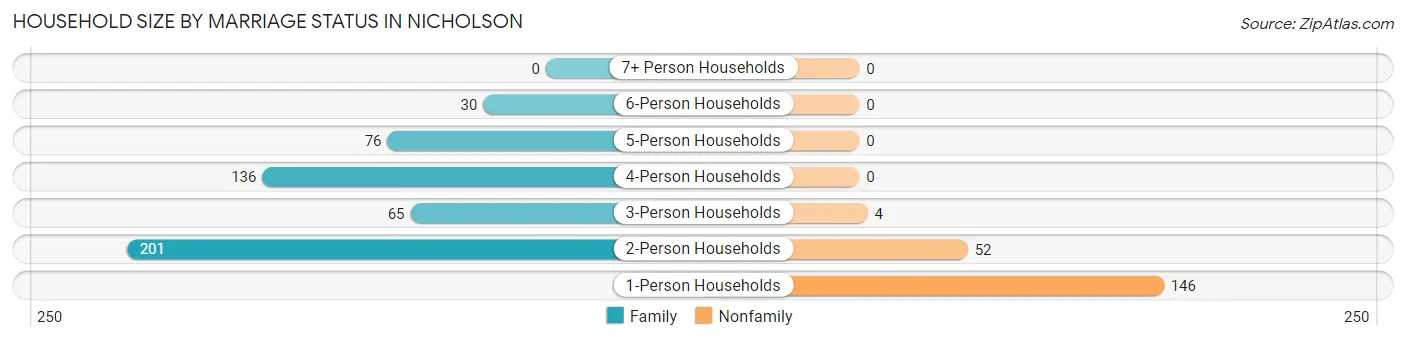
| Household Size | Family Households | Nonfamily Households |
| 1-Person Households | - | 146 (20.6%) |
| 2-Person Households | 201 (28.3%) | 52 (7.3%) |
| 3-Person Households | 65 (9.1%) | 4 (0.6%) |
| 4-Person Households | 136 (19.2%) | 0 (0.0%) |
| 5-Person Households | 76 (10.7%) | 0 (0.0%) |
| 6-Person Households | 30 (4.2%) | 0 (0.0%) |
| 7+ Person Households | 0 (0.0%) | 0 (0.0%) |
| Total | 508 (71.6%) | 202 (28.4%) |
Female Fertility in Nicholson
Fertility by Age in Nicholson
Average fertility rate in Nicholson is 81.0 births per 1,000 women. Women in the age bracket of 15 to 19 years have the highest fertility rate with 120.0 births per 1,000 women. Women in the age bracket of 20 to 34 years acount for 60.0% of all women with births.
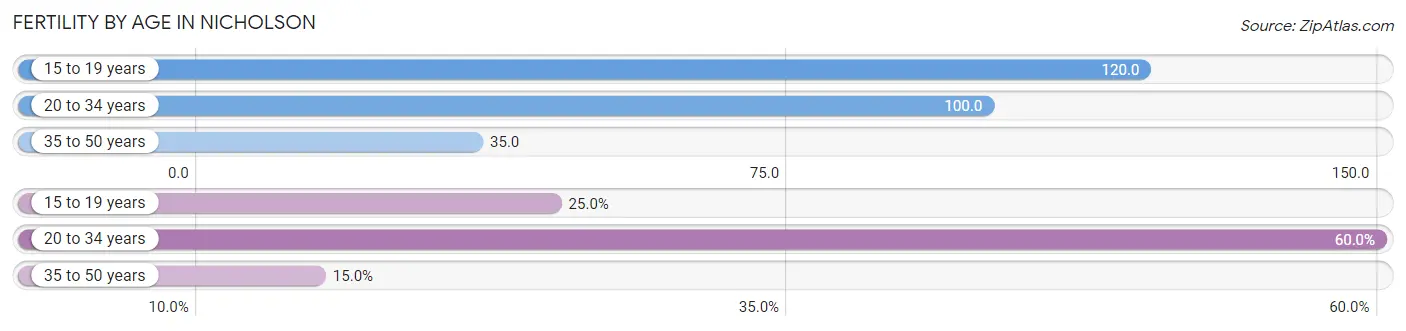
| Age Bracket | Women with Births | Births / 1,000 Women |
| 15 to 19 years | 10 (25.0%) | 120.0 |
| 20 to 34 years | 24 (60.0%) | 100.0 |
| 35 to 50 years | 6 (15.0%) | 35.0 |
| Total | 40 (100.0%) | 81.0 |
Fertility by Age by Marriage Status in Nicholson
72.5% of women with births (40) in Nicholson are married. The highest percentage of unmarried women with births falls into 35 to 50 years age bracket with 100.0% of them unmarried at the time of birth, while the lowest percentage of unmarried women with births belong to 15 to 19 years age bracket with 0.0% of them unmarried.
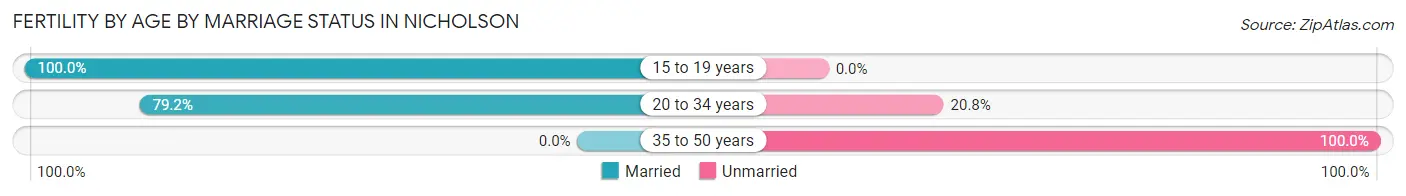
| Age Bracket | Married | Unmarried |
| 15 to 19 years | 10 (100.0%) | 0 (0.0%) |
| 20 to 34 years | 19 (79.2%) | 5 (20.8%) |
| 35 to 50 years | 0 (0.0%) | 6 (100.0%) |
| Total | 29 (72.5%) | 11 (27.5%) |
Fertility by Education in Nicholson
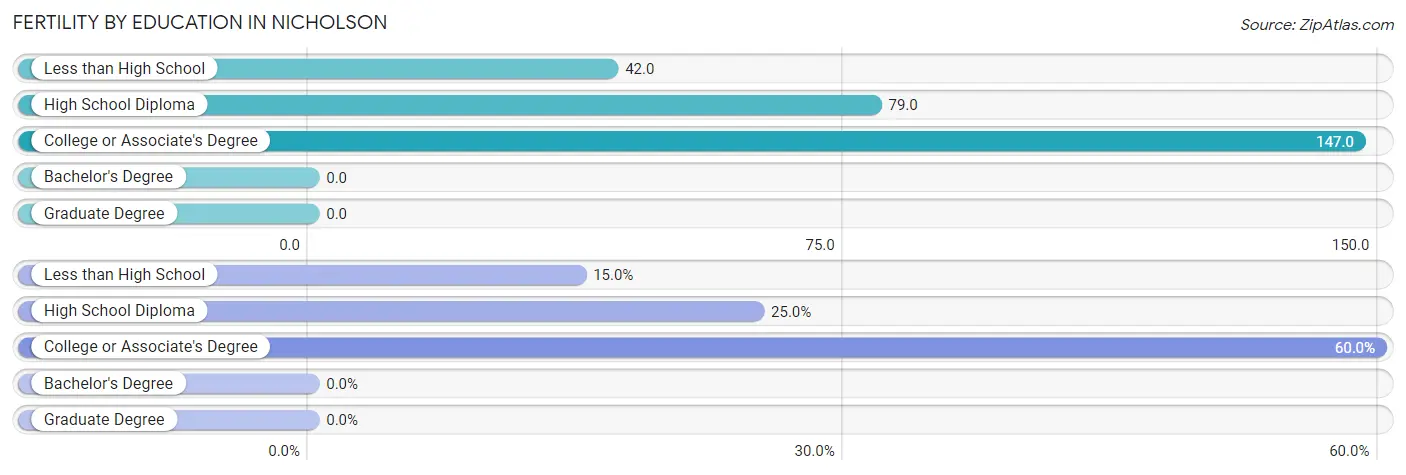
| Educational Attainment | Women with Births | Births / 1,000 Women |
| Less than High School | 6 (15.0%) | 42.0 |
| High School Diploma | 10 (25.0%) | 79.0 |
| College or Associate's Degree | 24 (60.0%) | 147.0 |
| Bachelor's Degree | 0 (0.0%) | 0.0 |
| Graduate Degree | 0 (0.0%) | 0.0 |
| Total | 40 (100.0%) | 81.0 |
Fertility by Education by Marriage Status in Nicholson
27.5% of women with births in Nicholson are unmarried. Women with the educational attainment of high school diploma are most likely to be married with 100.0% of them married at childbirth, while women with the educational attainment of less than high school are least likely to be married with 100.0% of them unmarried at childbirth.
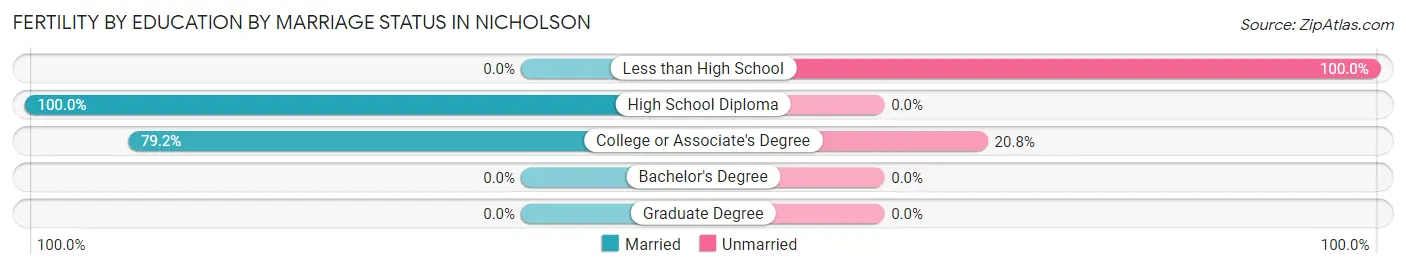
| Educational Attainment | Married | Unmarried |
| Less than High School | 0 (0.0%) | 6 (100.0%) |
| High School Diploma | 10 (100.0%) | 0 (0.0%) |
| College or Associate's Degree | 19 (79.2%) | 5 (20.8%) |
| Bachelor's Degree | 0 (0.0%) | 0 (0.0%) |
| Graduate Degree | 0 (0.0%) | 0 (0.0%) |
| Total | 29 (72.5%) | 11 (27.5%) |
Employment Characteristics in Nicholson
Employment by Class of Employer in Nicholson
Among the 949 employed individuals in Nicholson, private company employees (708 | 74.6%), local government employees (106 | 11.2%), and state government employees (45 | 4.7%) make up the most common classes of employment.
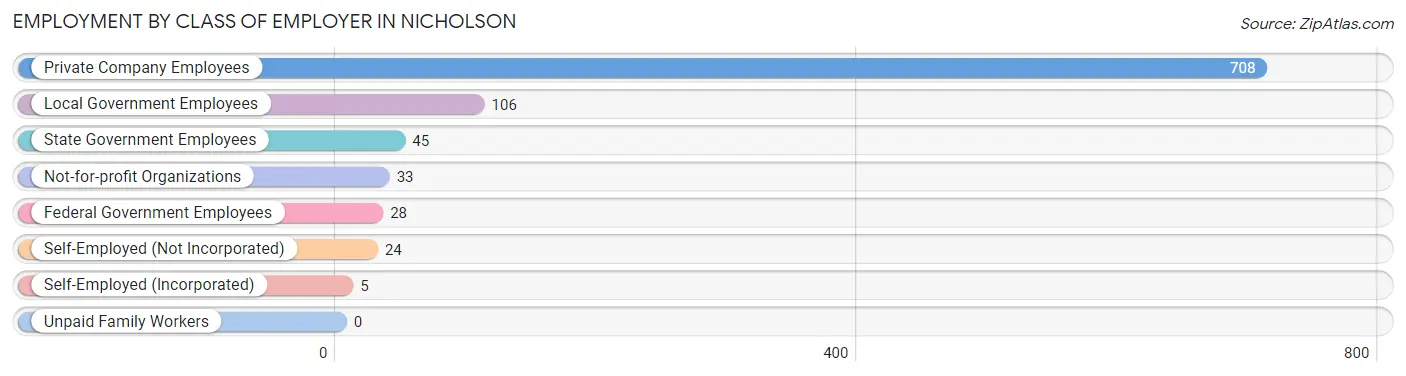
| Employer Class | # Employees | % Employees |
| Private Company Employees | 708 | 74.6% |
| Self-Employed (Incorporated) | 5 | 0.5% |
| Self-Employed (Not Incorporated) | 24 | 2.5% |
| Not-for-profit Organizations | 33 | 3.5% |
| Local Government Employees | 106 | 11.2% |
| State Government Employees | 45 | 4.7% |
| Federal Government Employees | 28 | 2.9% |
| Unpaid Family Workers | 0 | 0.0% |
| Total | 949 | 100.0% |
Employment Status by Age in Nicholson
According to the labor force statistics for Nicholson, out of the total population over 16 years of age (1,625), 67.3% or 1,094 individuals are in the labor force, with 12.2% or 133 of them unemployed. The age group with the highest labor force participation rate is 20 to 24 years, with 97.5% or 116 individuals in the labor force. Within the labor force, the 30 to 34 years age range has the highest percentage of unemployed individuals, with 30.8% or 60 of them being unemployed.
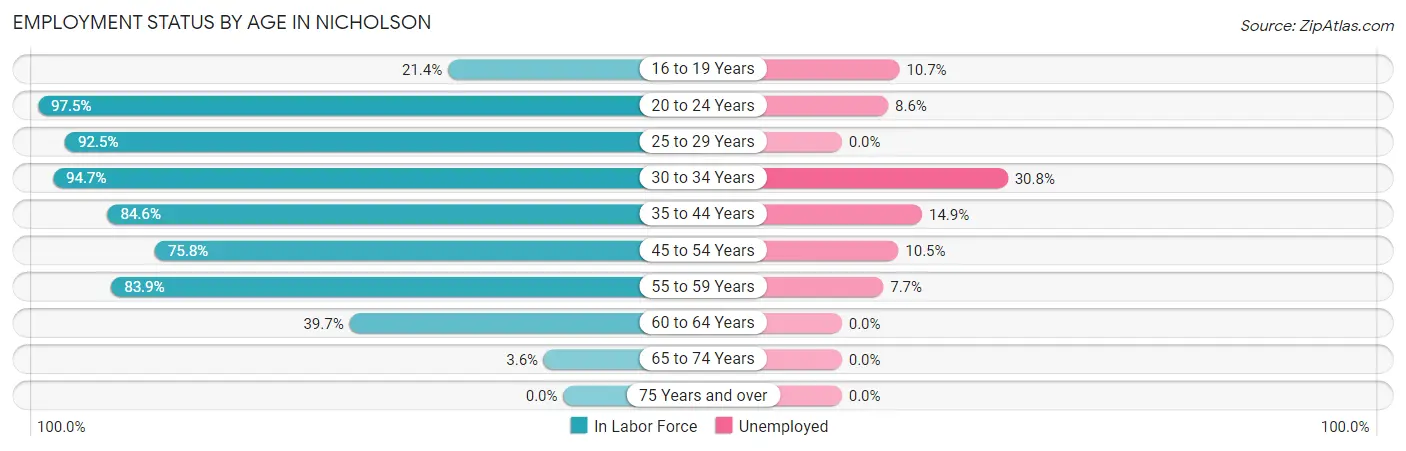
| Age Bracket | In Labor Force | Unemployed |
| 16 to 19 Years | 28 (21.4%) | 3 (10.7%) |
| 20 to 24 Years | 116 (97.5%) | 10 (8.6%) |
| 25 to 29 Years | 185 (92.5%) | 0 (0.0%) |
| 30 to 34 Years | 195 (94.7%) | 60 (30.8%) |
| 35 to 44 Years | 215 (84.6%) | 32 (14.9%) |
| 45 to 54 Years | 200 (75.8%) | 21 (10.5%) |
| 55 to 59 Years | 104 (83.9%) | 8 (7.7%) |
| 60 to 64 Years | 46 (39.7%) | 0 (0.0%) |
| 65 to 74 Years | 5 (3.6%) | 0 (0.0%) |
| 75 Years and over | 0 (0.0%) | 0 (0.0%) |
| Total | 1,094 (67.3%) | 133 (12.2%) |
Employment Status by Educational Attainment in Nicholson
According to labor force statistics for Nicholson, 81.2% of individuals (945) out of the total population between 25 and 64 years of age (1,164) are in the labor force, with 12.8% or 121 of them being unemployed. The group with the highest labor force participation rate are those with the educational attainment of college / associate degree, with 89.3% or 391 individuals in the labor force. Within the labor force, individuals with less than high school education have the highest percentage of unemployment, with 17.6% or 36 of them being unemployed.
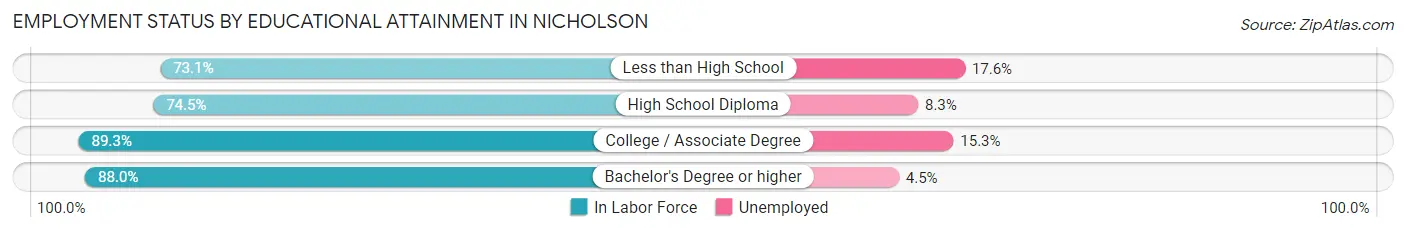
| Educational Attainment | In Labor Force | Unemployed |
| Less than High School | 204 (73.1%) | 49 (17.6%) |
| High School Diploma | 240 (74.5%) | 27 (8.3%) |
| College / Associate Degree | 391 (89.3%) | 67 (15.3%) |
| Bachelor's Degree or higher | 110 (88.0%) | 6 (4.5%) |
| Total | 945 (81.2%) | 149 (12.8%) |
Employment Occupations by Sex in Nicholson
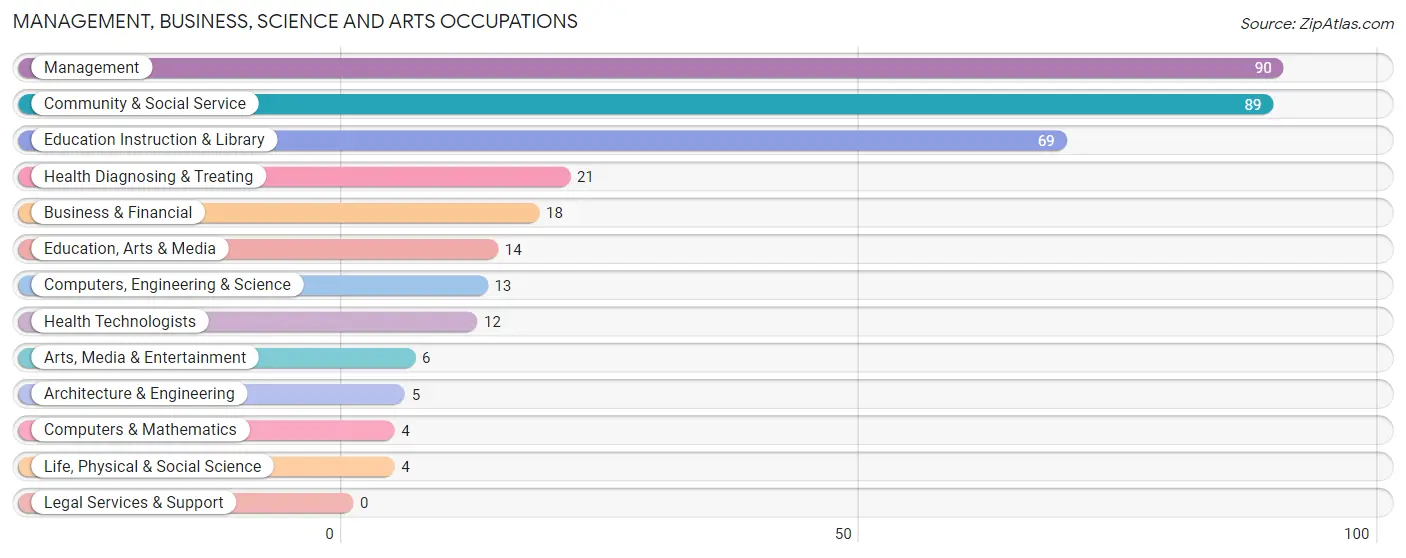
Management, Business, Science and Arts Occupations
The most common Management, Business, Science and Arts occupations in Nicholson are Management (90 | 9.4%), Community & Social Service (89 | 9.3%), Education Instruction & Library (69 | 7.2%), Health Diagnosing & Treating (21 | 2.2%), and Business & Financial (18 | 1.9%).
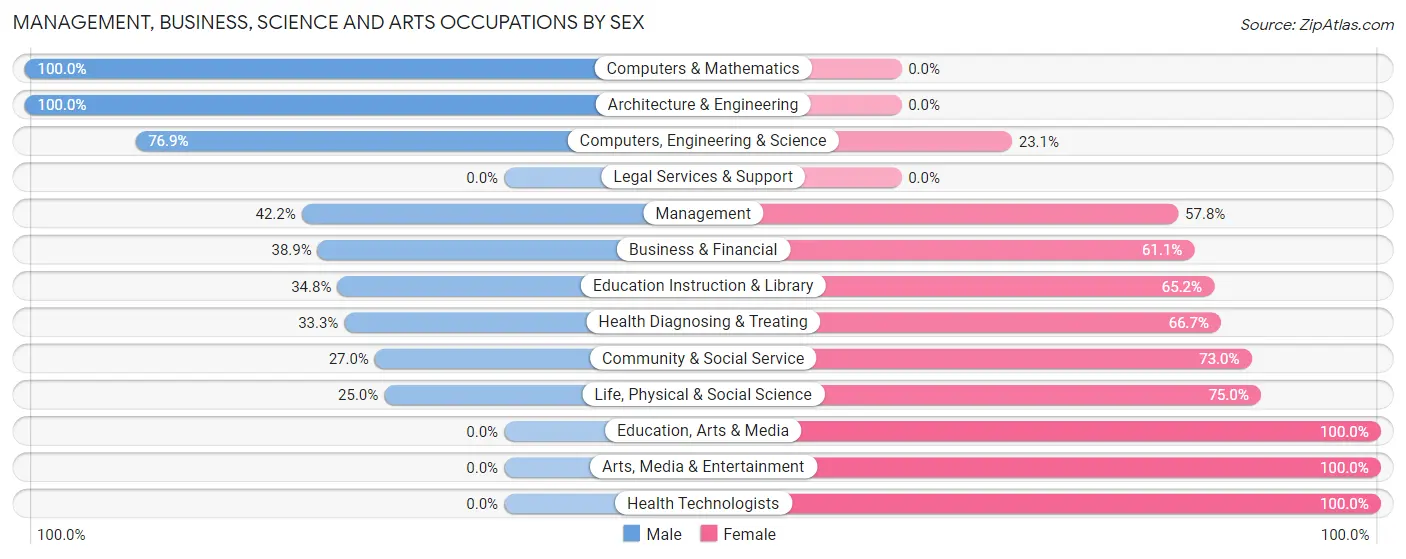
Management, Business, Science and Arts Occupations by Sex
Within the Management, Business, Science and Arts occupations in Nicholson, the most male-oriented occupations are Computers & Mathematics (100.0%), Architecture & Engineering (100.0%), and Computers, Engineering & Science (76.9%), while the most female-oriented occupations are Education, Arts & Media (100.0%), Arts, Media & Entertainment (100.0%), and Health Technologists (100.0%).
| Occupation | Male | Female |
| Management | 38 (42.2%) | 52 (57.8%) |
| Business & Financial | 7 (38.9%) | 11 (61.1%) |
| Computers, Engineering & Science | 10 (76.9%) | 3 (23.1%) |
| Computers & Mathematics | 4 (100.0%) | 0 (0.0%) |
| Architecture & Engineering | 5 (100.0%) | 0 (0.0%) |
| Life, Physical & Social Science | 1 (25.0%) | 3 (75.0%) |
| Community & Social Service | 24 (27.0%) | 65 (73.0%) |
| Education, Arts & Media | 0 (0.0%) | 14 (100.0%) |
| Legal Services & Support | 0 (0.0%) | 0 (0.0%) |
| Education Instruction & Library | 24 (34.8%) | 45 (65.2%) |
| Arts, Media & Entertainment | 0 (0.0%) | 6 (100.0%) |
| Health Diagnosing & Treating | 7 (33.3%) | 14 (66.7%) |
| Health Technologists | 0 (0.0%) | 12 (100.0%) |
| Total (Category) | 86 (37.2%) | 145 (62.8%) |
| Total (Overall) | 483 (50.3%) | 477 (49.7%) |
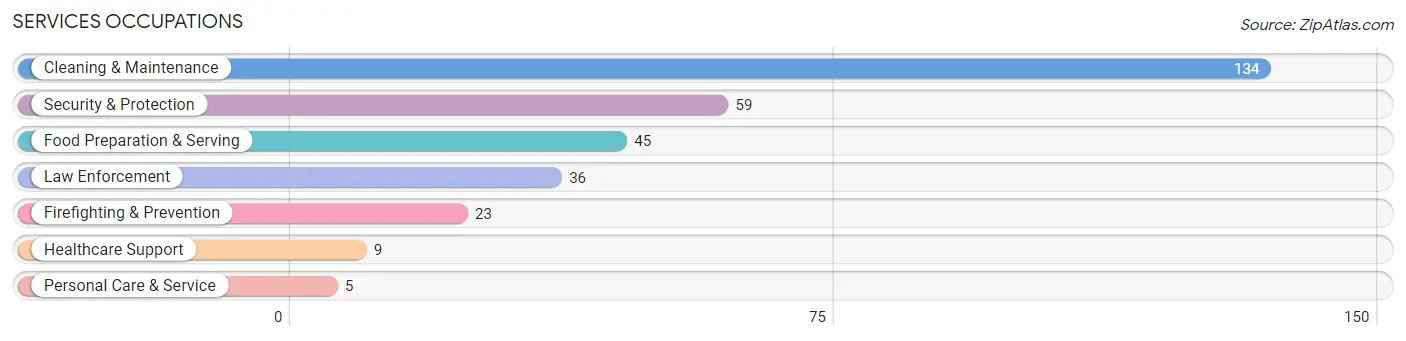
Services Occupations
The most common Services occupations in Nicholson are Cleaning & Maintenance (134 | 14.0%), Security & Protection (59 | 6.1%), Food Preparation & Serving (45 | 4.7%), Law Enforcement (36 | 3.7%), and Firefighting & Prevention (23 | 2.4%).
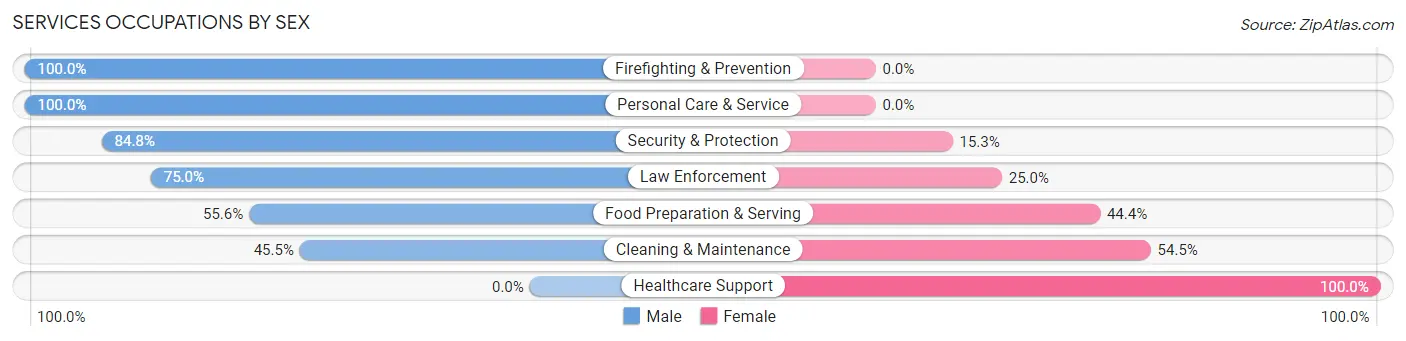
Services Occupations by Sex
Within the Services occupations in Nicholson, the most male-oriented occupations are Firefighting & Prevention (100.0%), Personal Care & Service (100.0%), and Security & Protection (84.8%), while the most female-oriented occupations are Healthcare Support (100.0%), Cleaning & Maintenance (54.5%), and Food Preparation & Serving (44.4%).
| Occupation | Male | Female |
| Healthcare Support | 0 (0.0%) | 9 (100.0%) |
| Security & Protection | 50 (84.8%) | 9 (15.2%) |
| Firefighting & Prevention | 23 (100.0%) | 0 (0.0%) |
| Law Enforcement | 27 (75.0%) | 9 (25.0%) |
| Food Preparation & Serving | 25 (55.6%) | 20 (44.4%) |
| Cleaning & Maintenance | 61 (45.5%) | 73 (54.5%) |
| Personal Care & Service | 5 (100.0%) | 0 (0.0%) |
| Total (Category) | 141 (55.9%) | 111 (44.1%) |
| Total (Overall) | 483 (50.3%) | 477 (49.7%) |
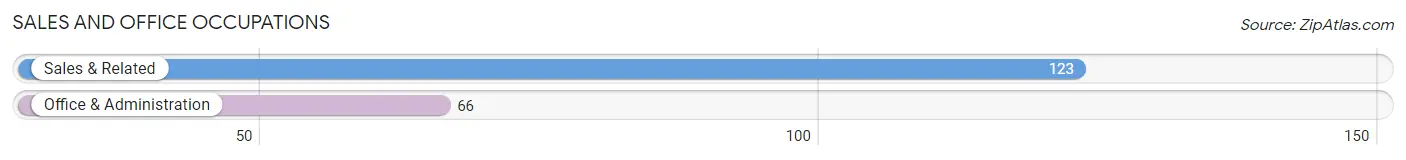
Sales and Office Occupations
The most common Sales and Office occupations in Nicholson are Sales & Related (123 | 12.8%), and Office & Administration (66 | 6.9%).
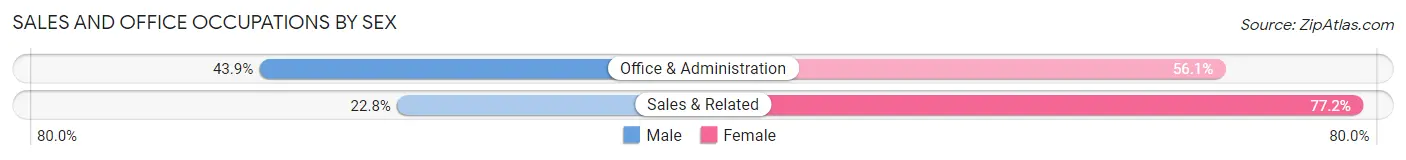
Sales and Office Occupations by Sex
| Occupation | Male | Female |
| Sales & Related | 28 (22.8%) | 95 (77.2%) |
| Office & Administration | 29 (43.9%) | 37 (56.1%) |
| Total (Category) | 57 (30.2%) | 132 (69.8%) |
| Total (Overall) | 483 (50.3%) | 477 (49.7%) |
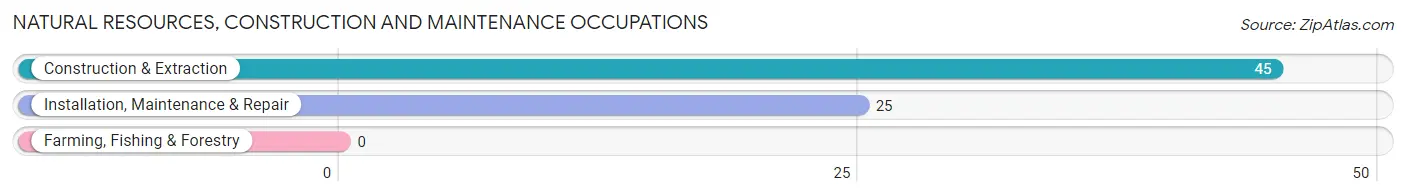
Natural Resources, Construction and Maintenance Occupations
The most common Natural Resources, Construction and Maintenance occupations in Nicholson are Construction & Extraction (45 | 4.7%), and Installation, Maintenance & Repair (25 | 2.6%).
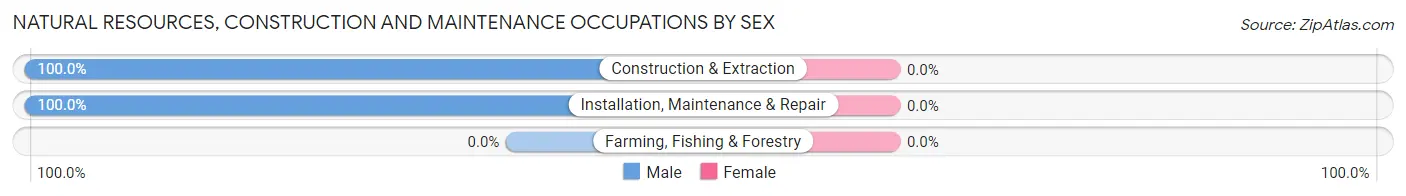
Natural Resources, Construction and Maintenance Occupations by Sex
| Occupation | Male | Female |
| Farming, Fishing & Forestry | 0 (0.0%) | 0 (0.0%) |
| Construction & Extraction | 45 (100.0%) | 0 (0.0%) |
| Installation, Maintenance & Repair | 25 (100.0%) | 0 (0.0%) |
| Total (Category) | 70 (100.0%) | 0 (0.0%) |
| Total (Overall) | 483 (50.3%) | 477 (49.7%) |
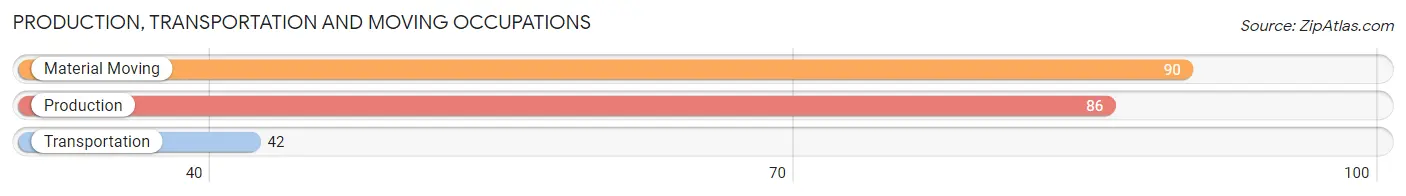
Production, Transportation and Moving Occupations
The most common Production, Transportation and Moving occupations in Nicholson are Material Moving (90 | 9.4%), Production (86 | 9.0%), and Transportation (42 | 4.4%).
Production, Transportation and Moving Occupations by Sex
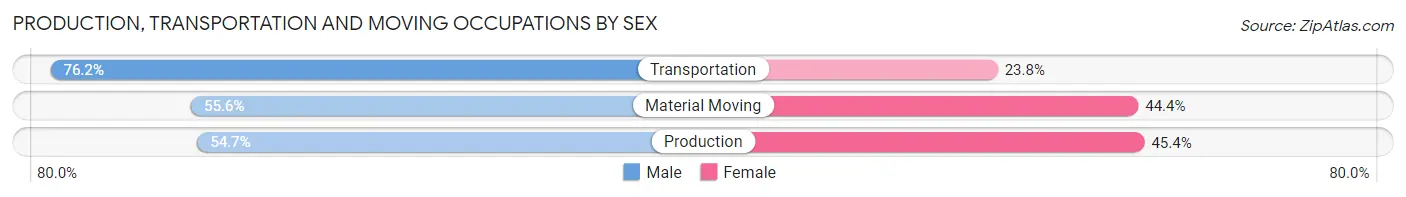
| Occupation | Male | Female |
| Production | 47 (54.6%) | 39 (45.4%) |
| Transportation | 32 (76.2%) | 10 (23.8%) |
| Material Moving | 50 (55.6%) | 40 (44.4%) |
| Total (Category) | 129 (59.2%) | 89 (40.8%) |
| Total (Overall) | 483 (50.3%) | 477 (49.7%) |
Employment Industries by Sex in Nicholson
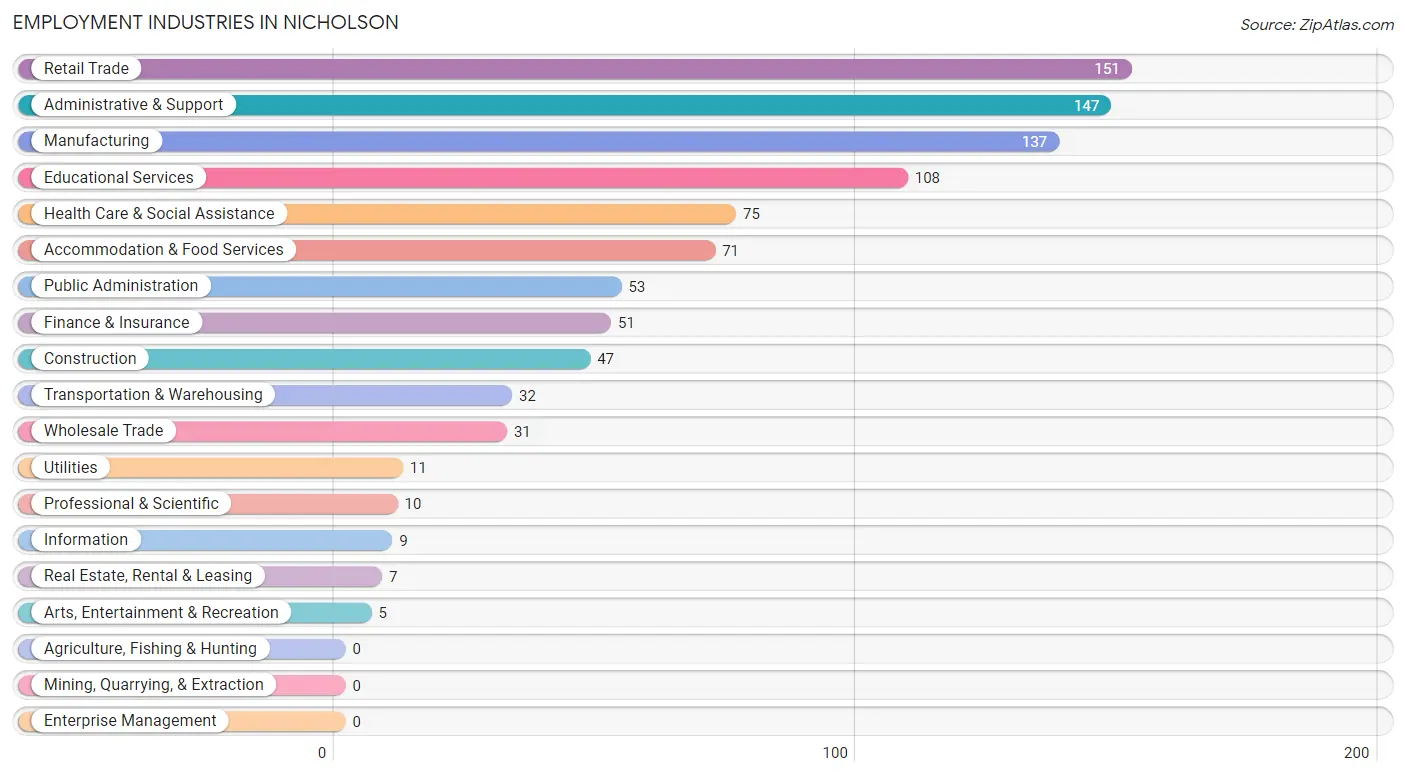
Employment Industries in Nicholson
The major employment industries in Nicholson include Retail Trade (151 | 15.7%), Administrative & Support (147 | 15.3%), Manufacturing (137 | 14.3%), Educational Services (108 | 11.3%), and Health Care & Social Assistance (75 | 7.8%).
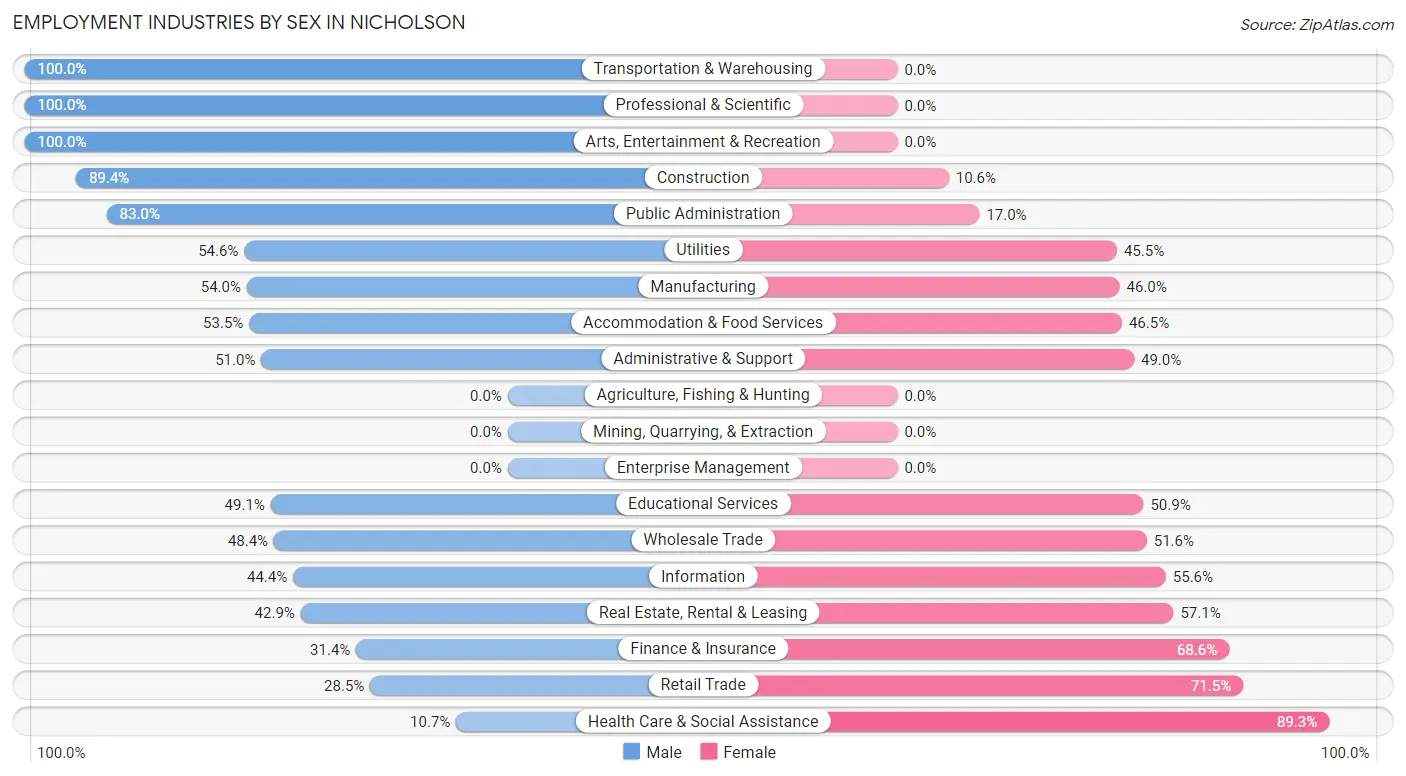
Employment Industries by Sex in Nicholson
The Nicholson industries that see more men than women are Transportation & Warehousing (100.0%), Professional & Scientific (100.0%), and Arts, Entertainment & Recreation (100.0%), whereas the industries that tend to have a higher number of women are Health Care & Social Assistance (89.3%), Retail Trade (71.5%), and Finance & Insurance (68.6%).
| Industry | Male | Female |
| Agriculture, Fishing & Hunting | 0 (0.0%) | 0 (0.0%) |
| Mining, Quarrying, & Extraction | 0 (0.0%) | 0 (0.0%) |
| Construction | 42 (89.4%) | 5 (10.6%) |
| Manufacturing | 74 (54.0%) | 63 (46.0%) |
| Wholesale Trade | 15 (48.4%) | 16 (51.6%) |
| Retail Trade | 43 (28.5%) | 108 (71.5%) |
| Transportation & Warehousing | 32 (100.0%) | 0 (0.0%) |
| Utilities | 6 (54.5%) | 5 (45.5%) |
| Information | 4 (44.4%) | 5 (55.6%) |
| Finance & Insurance | 16 (31.4%) | 35 (68.6%) |
| Real Estate, Rental & Leasing | 3 (42.9%) | 4 (57.1%) |
| Professional & Scientific | 10 (100.0%) | 0 (0.0%) |
| Enterprise Management | 0 (0.0%) | 0 (0.0%) |
| Administrative & Support | 75 (51.0%) | 72 (49.0%) |
| Educational Services | 53 (49.1%) | 55 (50.9%) |
| Health Care & Social Assistance | 8 (10.7%) | 67 (89.3%) |
| Arts, Entertainment & Recreation | 5 (100.0%) | 0 (0.0%) |
| Accommodation & Food Services | 38 (53.5%) | 33 (46.5%) |
| Public Administration | 44 (83.0%) | 9 (17.0%) |
| Total | 483 (50.3%) | 477 (49.7%) |
Education in Nicholson
School Enrollment in Nicholson
The most common levels of schooling among the 574 students in Nicholson are middle school (152 | 26.5%), high school (151 | 26.3%), and elementary school (128 | 22.3%).
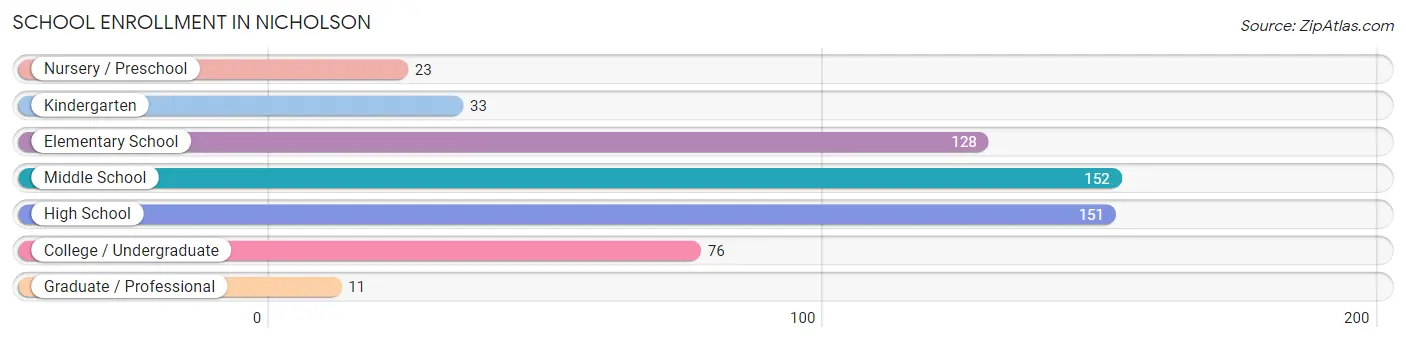
| School Level | # Students | % Students |
| Nursery / Preschool | 23 | 4.0% |
| Kindergarten | 33 | 5.8% |
| Elementary School | 128 | 22.3% |
| Middle School | 152 | 26.5% |
| High School | 151 | 26.3% |
| College / Undergraduate | 76 | 13.2% |
| Graduate / Professional | 11 | 1.9% |
| Total | 574 | 100.0% |
School Enrollment by Age by Funding Source in Nicholson
Out of a total of 574 students who are enrolled in schools in Nicholson, 30 (5.2%) attend a private institution, while the remaining 544 (94.8%) are enrolled in public schools. The age group of 3 to 4 year olds has the highest likelihood of being enrolled in private schools, with 7 (63.6% in the age bracket) enrolled. Conversely, the age group of 5 to 9 year old has the lowest likelihood of being enrolled in a private school, with 184 (100.0% in the age bracket) attending a public institution.
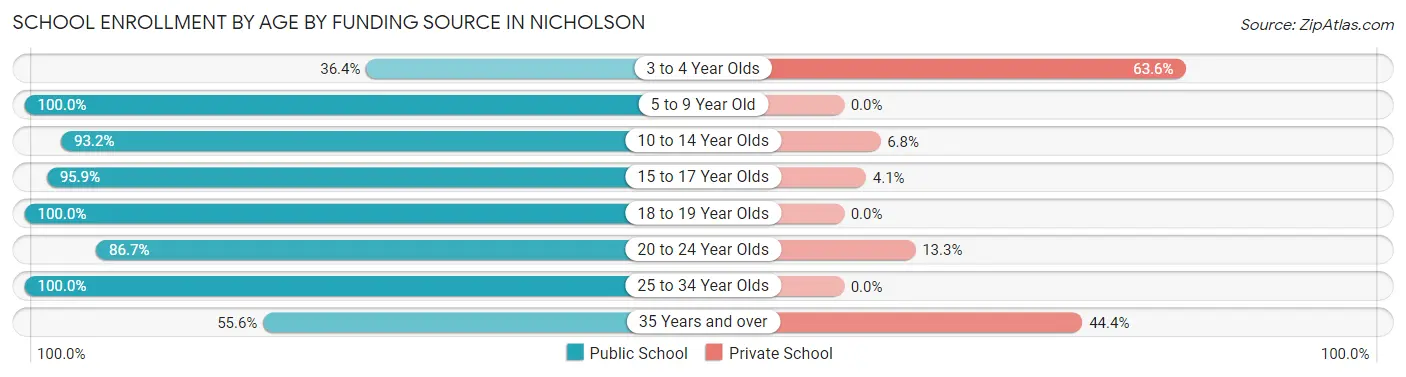
| Age Bracket | Public School | Private School |
| 3 to 4 Year Olds | 4 (36.4%) | 7 (63.6%) |
| 5 to 9 Year Old | 184 (100.0%) | 0 (0.0%) |
| 10 to 14 Year Olds | 137 (93.2%) | 10 (6.8%) |
| 15 to 17 Year Olds | 116 (95.9%) | 5 (4.1%) |
| 18 to 19 Year Olds | 25 (100.0%) | 0 (0.0%) |
| 20 to 24 Year Olds | 26 (86.7%) | 4 (13.3%) |
| 25 to 34 Year Olds | 47 (100.0%) | 0 (0.0%) |
| 35 Years and over | 5 (55.6%) | 4 (44.4%) |
| Total | 544 (94.8%) | 30 (5.2%) |
Educational Attainment by Field of Study in Nicholson
Business (51 | 28.5%), education (36 | 20.1%), computers & mathematics (19 | 10.6%), science & technology (15 | 8.4%), and arts & humanities (14 | 7.8%) are the most common fields of study among 179 individuals in Nicholson who have obtained a bachelor's degree or higher.
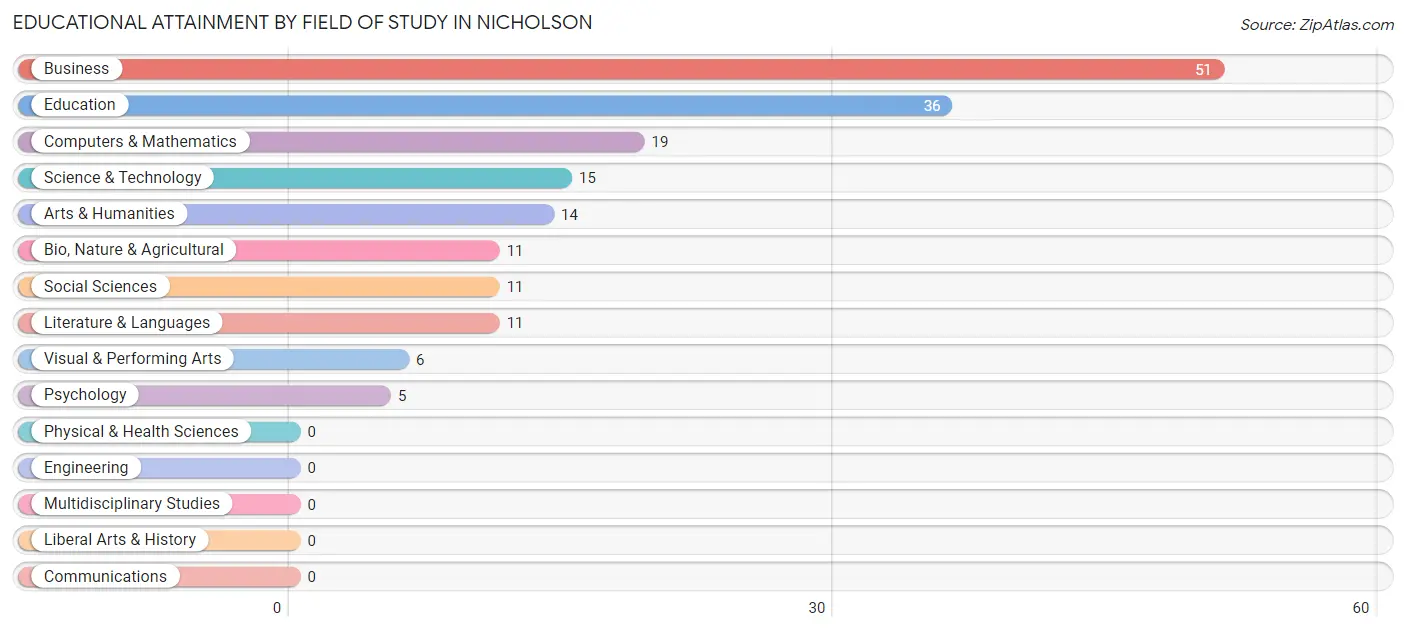
| Field of Study | # Graduates | % Graduates |
| Computers & Mathematics | 19 | 10.6% |
| Bio, Nature & Agricultural | 11 | 6.1% |
| Physical & Health Sciences | 0 | 0.0% |
| Psychology | 5 | 2.8% |
| Social Sciences | 11 | 6.1% |
| Engineering | 0 | 0.0% |
| Multidisciplinary Studies | 0 | 0.0% |
| Science & Technology | 15 | 8.4% |
| Business | 51 | 28.5% |
| Education | 36 | 20.1% |
| Literature & Languages | 11 | 6.1% |
| Liberal Arts & History | 0 | 0.0% |
| Visual & Performing Arts | 6 | 3.4% |
| Communications | 0 | 0.0% |
| Arts & Humanities | 14 | 7.8% |
| Total | 179 | 100.0% |
Transportation & Commute in Nicholson
Vehicle Availability by Sex in Nicholson
The most prevalent vehicle ownership categories in Nicholson are males with 2 vehicles (146, accounting for 30.9%) and females with 2 vehicles (117, making up 30.6%).
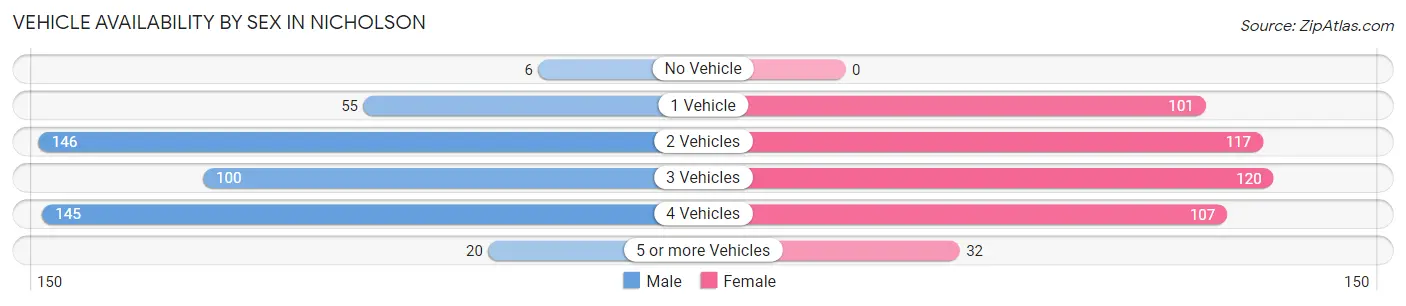
| Vehicles Available | Male | Female |
| No Vehicle | 6 (1.3%) | 0 (0.0%) |
| 1 Vehicle | 55 (11.7%) | 101 (21.2%) |
| 2 Vehicles | 146 (30.9%) | 117 (24.5%) |
| 3 Vehicles | 100 (21.2%) | 120 (25.2%) |
| 4 Vehicles | 145 (30.7%) | 107 (22.4%) |
| 5 or more Vehicles | 20 (4.2%) | 32 (6.7%) |
| Total | 472 (100.0%) | 477 (100.0%) |
Commute Time in Nicholson
The most frequently occuring commute durations in Nicholson are 15 to 19 minutes (175 commuters, 18.9%), 10 to 14 minutes (155 commuters, 16.7%), and 45 to 59 minutes (132 commuters, 14.2%).
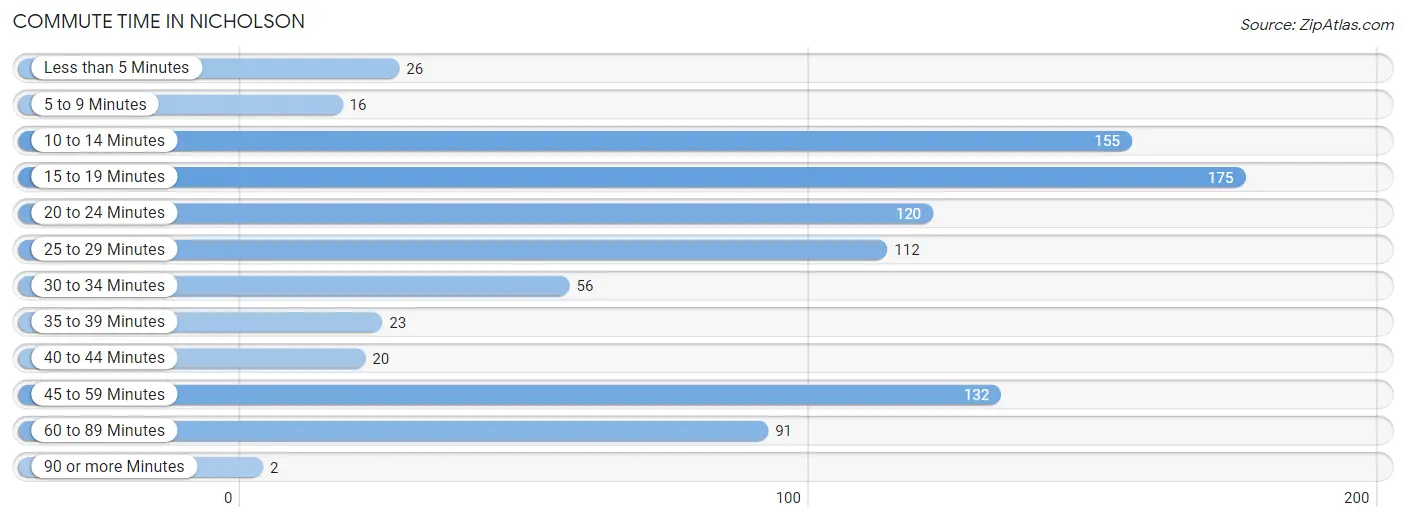
| Commute Time | # Commuters | % Commuters |
| Less than 5 Minutes | 26 | 2.8% |
| 5 to 9 Minutes | 16 | 1.7% |
| 10 to 14 Minutes | 155 | 16.7% |
| 15 to 19 Minutes | 175 | 18.9% |
| 20 to 24 Minutes | 120 | 12.9% |
| 25 to 29 Minutes | 112 | 12.1% |
| 30 to 34 Minutes | 56 | 6.0% |
| 35 to 39 Minutes | 23 | 2.5% |
| 40 to 44 Minutes | 20 | 2.2% |
| 45 to 59 Minutes | 132 | 14.2% |
| 60 to 89 Minutes | 91 | 9.8% |
| 90 or more Minutes | 2 | 0.2% |
Commute Time by Sex in Nicholson
The most common commute times in Nicholson are 45 to 59 minutes (106 commuters, 23.1%) for males and 25 to 29 minutes (101 commuters, 21.5%) for females.
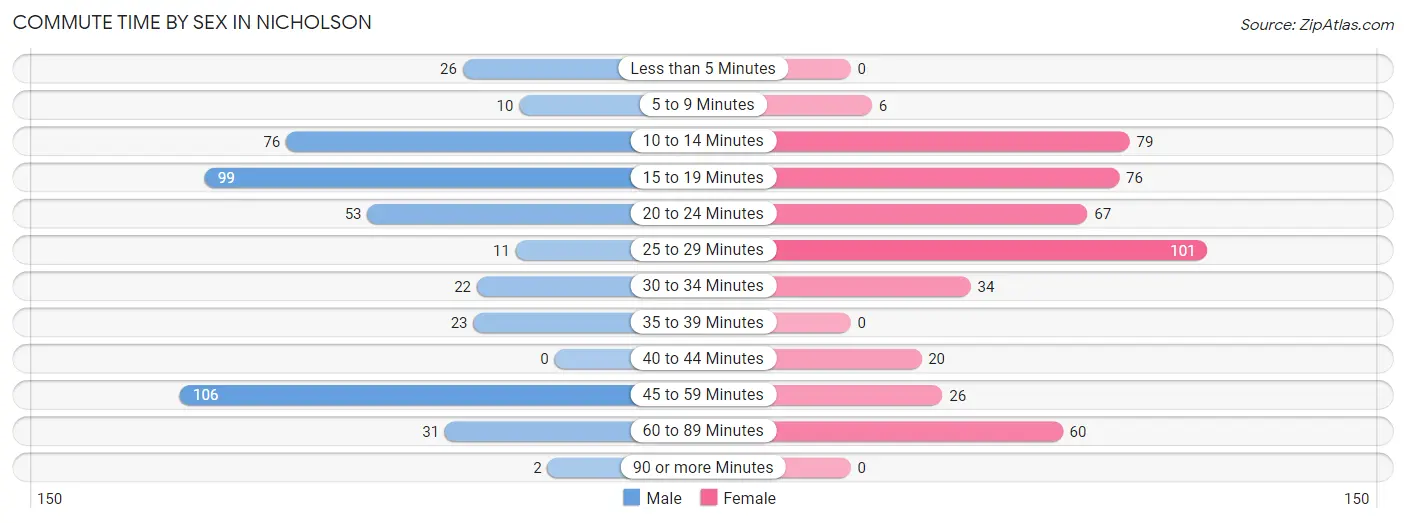
| Commute Time | Male | Female |
| Less than 5 Minutes | 26 (5.7%) | 0 (0.0%) |
| 5 to 9 Minutes | 10 (2.2%) | 6 (1.3%) |
| 10 to 14 Minutes | 76 (16.6%) | 79 (16.8%) |
| 15 to 19 Minutes | 99 (21.6%) | 76 (16.2%) |
| 20 to 24 Minutes | 53 (11.6%) | 67 (14.3%) |
| 25 to 29 Minutes | 11 (2.4%) | 101 (21.5%) |
| 30 to 34 Minutes | 22 (4.8%) | 34 (7.2%) |
| 35 to 39 Minutes | 23 (5.0%) | 0 (0.0%) |
| 40 to 44 Minutes | 0 (0.0%) | 20 (4.3%) |
| 45 to 59 Minutes | 106 (23.1%) | 26 (5.5%) |
| 60 to 89 Minutes | 31 (6.8%) | 60 (12.8%) |
| 90 or more Minutes | 2 (0.4%) | 0 (0.0%) |
Time of Departure to Work by Sex in Nicholson
The most frequent times of departure to work in Nicholson are 7:30 AM to 7:59 AM (88, 19.2%) for males and 6:30 AM to 6:59 AM (81, 17.3%) for females.
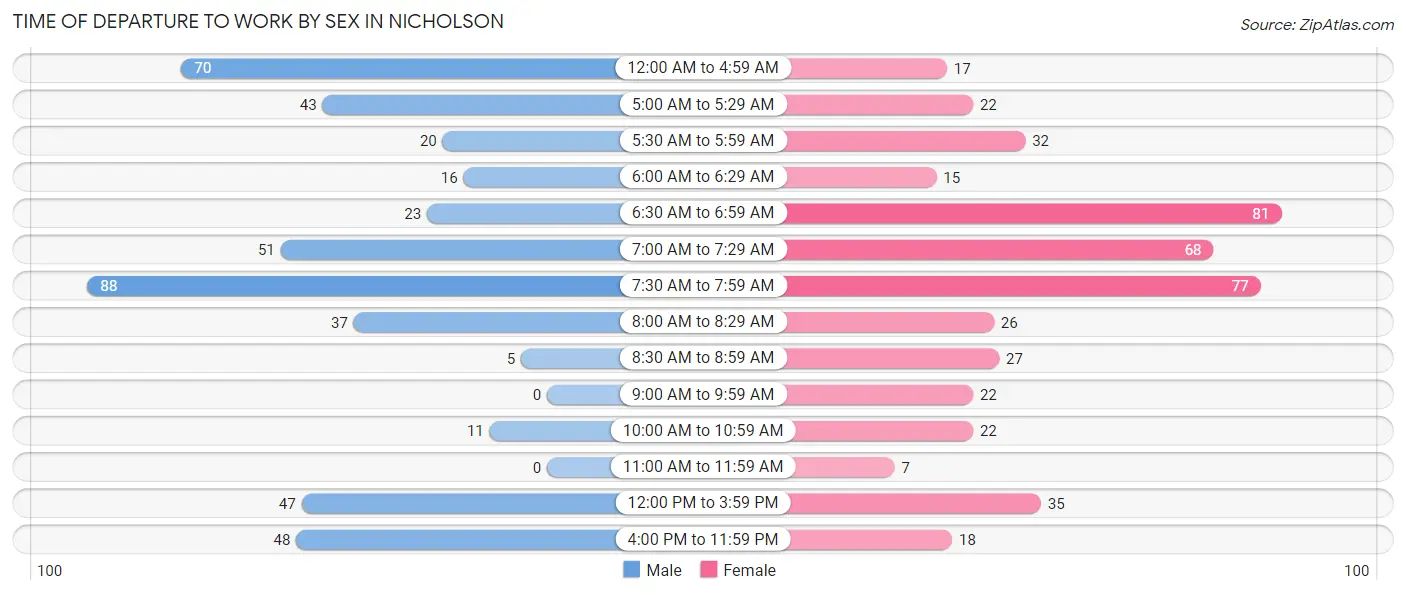
| Time of Departure | Male | Female |
| 12:00 AM to 4:59 AM | 70 (15.2%) | 17 (3.6%) |
| 5:00 AM to 5:29 AM | 43 (9.4%) | 22 (4.7%) |
| 5:30 AM to 5:59 AM | 20 (4.4%) | 32 (6.8%) |
| 6:00 AM to 6:29 AM | 16 (3.5%) | 15 (3.2%) |
| 6:30 AM to 6:59 AM | 23 (5.0%) | 81 (17.3%) |
| 7:00 AM to 7:29 AM | 51 (11.1%) | 68 (14.5%) |
| 7:30 AM to 7:59 AM | 88 (19.2%) | 77 (16.4%) |
| 8:00 AM to 8:29 AM | 37 (8.1%) | 26 (5.5%) |
| 8:30 AM to 8:59 AM | 5 (1.1%) | 27 (5.8%) |
| 9:00 AM to 9:59 AM | 0 (0.0%) | 22 (4.7%) |
| 10:00 AM to 10:59 AM | 11 (2.4%) | 22 (4.7%) |
| 11:00 AM to 11:59 AM | 0 (0.0%) | 7 (1.5%) |
| 12:00 PM to 3:59 PM | 47 (10.2%) | 35 (7.5%) |
| 4:00 PM to 11:59 PM | 48 (10.5%) | 18 (3.8%) |
| Total | 459 (100.0%) | 469 (100.0%) |
Housing Occupancy in Nicholson
Occupancy by Ownership in Nicholson
Of the total 710 dwellings in Nicholson, owner-occupied units account for 513 (72.3%), while renter-occupied units make up 197 (27.8%).
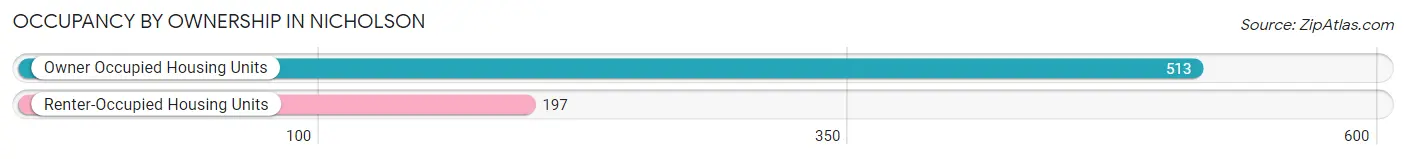
| Occupancy | # Housing Units | % Housing Units |
| Owner Occupied Housing Units | 513 | 72.3% |
| Renter-Occupied Housing Units | 197 | 27.8% |
| Total Occupied Housing Units | 710 | 100.0% |
Occupancy by Household Size in Nicholson
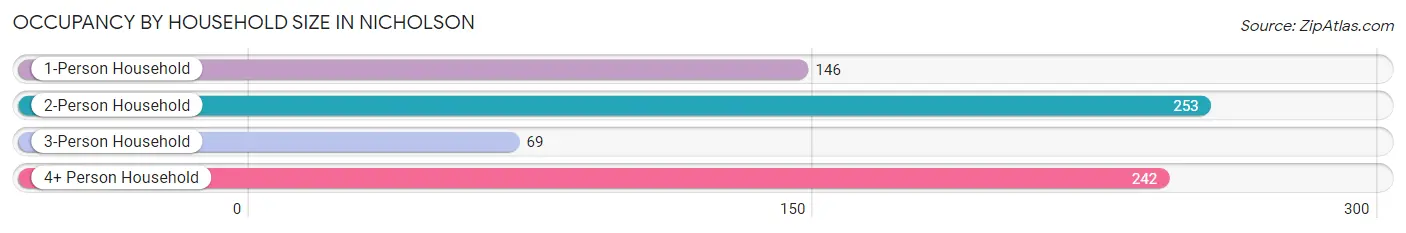
| Household Size | # Housing Units | % Housing Units |
| 1-Person Household | 146 | 20.6% |
| 2-Person Household | 253 | 35.6% |
| 3-Person Household | 69 | 9.7% |
| 4+ Person Household | 242 | 34.1% |
| Total Housing Units | 710 | 100.0% |
Occupancy by Ownership by Household Size in Nicholson
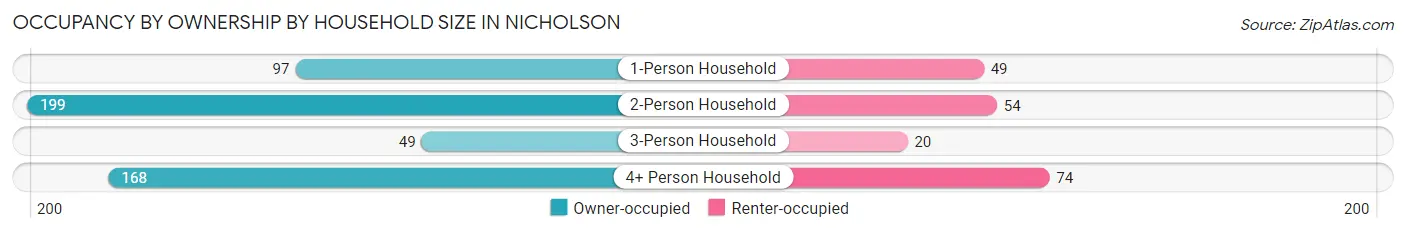
| Household Size | Owner-occupied | Renter-occupied |
| 1-Person Household | 97 (66.4%) | 49 (33.6%) |
| 2-Person Household | 199 (78.7%) | 54 (21.3%) |
| 3-Person Household | 49 (71.0%) | 20 (29.0%) |
| 4+ Person Household | 168 (69.4%) | 74 (30.6%) |
| Total Housing Units | 513 (72.3%) | 197 (27.8%) |
Occupancy by Educational Attainment in Nicholson
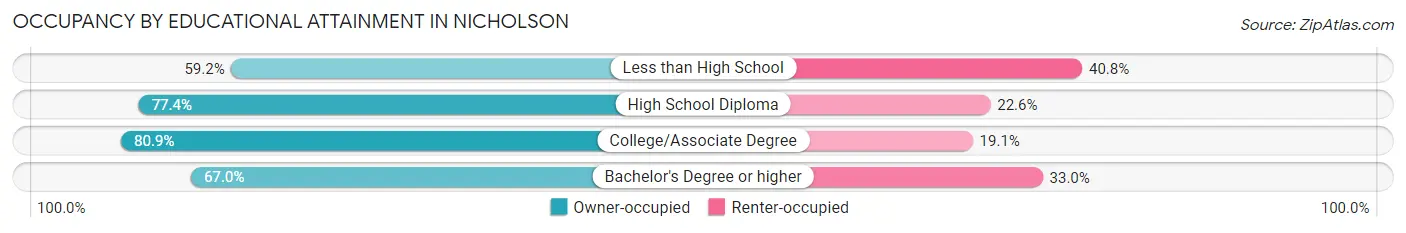
| Household Size | Owner-occupied | Renter-occupied |
| Less than High School | 116 (59.2%) | 80 (40.8%) |
| High School Diploma | 106 (77.4%) | 31 (22.6%) |
| College/Associate Degree | 224 (80.9%) | 53 (19.1%) |
| Bachelor's Degree or higher | 67 (67.0%) | 33 (33.0%) |
Occupancy by Age of Householder in Nicholson
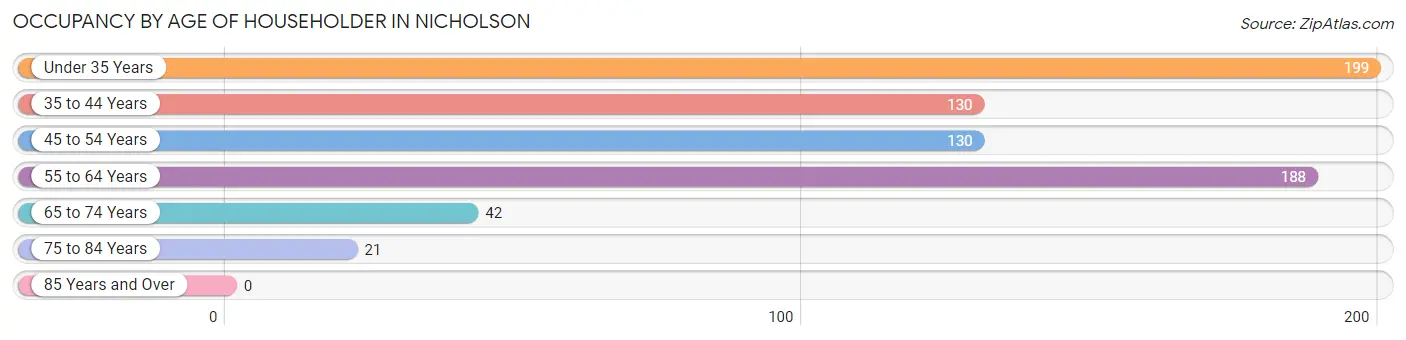
| Age Bracket | # Households | % Households |
| Under 35 Years | 199 | 28.0% |
| 35 to 44 Years | 130 | 18.3% |
| 45 to 54 Years | 130 | 18.3% |
| 55 to 64 Years | 188 | 26.5% |
| 65 to 74 Years | 42 | 5.9% |
| 75 to 84 Years | 21 | 3.0% |
| 85 Years and Over | 0 | 0.0% |
| Total | 710 | 100.0% |
Housing Finances in Nicholson
Median Income by Occupancy in Nicholson
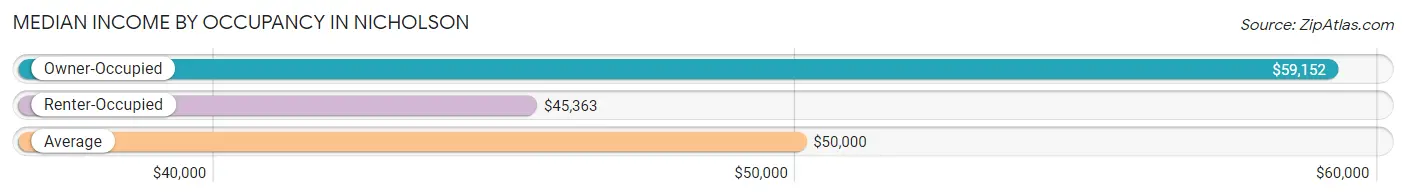
| Occupancy Type | # Households | Median Income |
| Owner-Occupied | 513 (72.3%) | $59,152 |
| Renter-Occupied | 197 (27.8%) | $45,363 |
| Average | 710 (100.0%) | $50,000 |
Occupancy by Householder Income Bracket in Nicholson
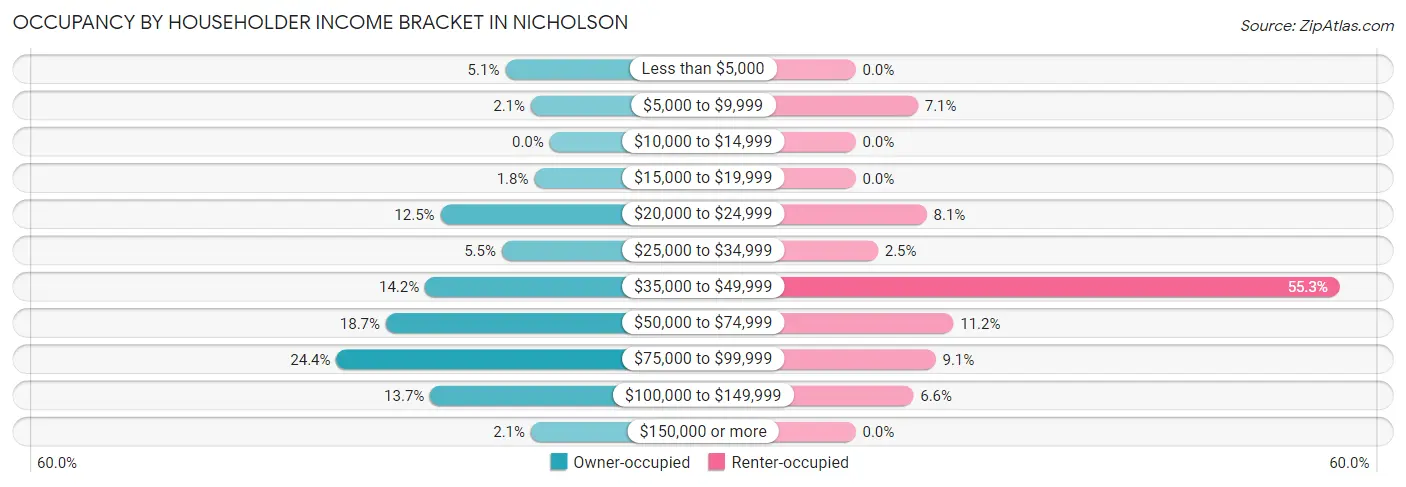
| Income Bracket | Owner-occupied | Renter-occupied |
| Less than $5,000 | 26 (5.1%) | 0 (0.0%) |
| $5,000 to $9,999 | 11 (2.1%) | 14 (7.1%) |
| $10,000 to $14,999 | 0 (0.0%) | 0 (0.0%) |
| $15,000 to $19,999 | 9 (1.8%) | 0 (0.0%) |
| $20,000 to $24,999 | 64 (12.5%) | 16 (8.1%) |
| $25,000 to $34,999 | 28 (5.5%) | 5 (2.5%) |
| $35,000 to $49,999 | 73 (14.2%) | 109 (55.3%) |
| $50,000 to $74,999 | 96 (18.7%) | 22 (11.2%) |
| $75,000 to $99,999 | 125 (24.4%) | 18 (9.1%) |
| $100,000 to $149,999 | 70 (13.7%) | 13 (6.6%) |
| $150,000 or more | 11 (2.1%) | 0 (0.0%) |
| Total | 513 (100.0%) | 197 (100.0%) |
Monthly Housing Cost Tiers in Nicholson
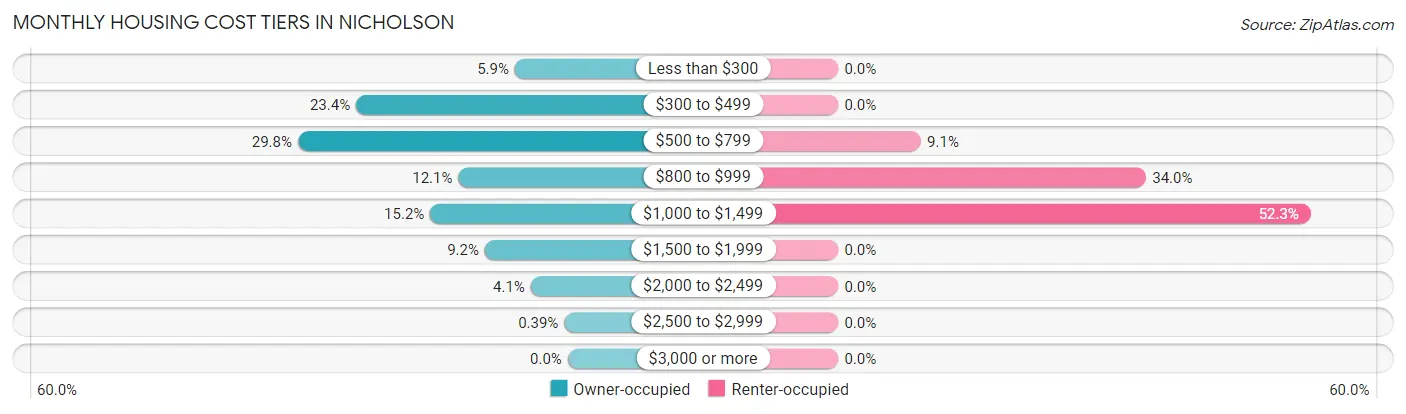
| Monthly Cost | Owner-occupied | Renter-occupied |
| Less than $300 | 30 (5.9%) | 0 (0.0%) |
| $300 to $499 | 120 (23.4%) | 0 (0.0%) |
| $500 to $799 | 153 (29.8%) | 18 (9.1%) |
| $800 to $999 | 62 (12.1%) | 67 (34.0%) |
| $1,000 to $1,499 | 78 (15.2%) | 103 (52.3%) |
| $1,500 to $1,999 | 47 (9.2%) | 0 (0.0%) |
| $2,000 to $2,499 | 21 (4.1%) | 0 (0.0%) |
| $2,500 to $2,999 | 2 (0.4%) | 0 (0.0%) |
| $3,000 or more | 0 (0.0%) | 0 (0.0%) |
| Total | 513 (100.0%) | 197 (100.0%) |
Physical Housing Characteristics in Nicholson
Housing Structures in Nicholson
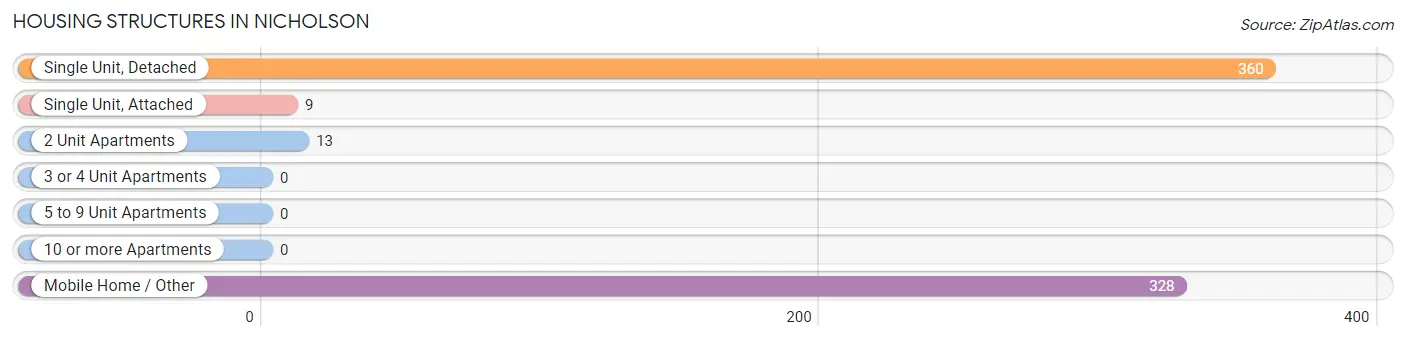
| Structure Type | # Housing Units | % Housing Units |
| Single Unit, Detached | 360 | 50.7% |
| Single Unit, Attached | 9 | 1.3% |
| 2 Unit Apartments | 13 | 1.8% |
| 3 or 4 Unit Apartments | 0 | 0.0% |
| 5 to 9 Unit Apartments | 0 | 0.0% |
| 10 or more Apartments | 0 | 0.0% |
| Mobile Home / Other | 328 | 46.2% |
| Total | 710 | 100.0% |
Housing Structures by Occupancy in Nicholson
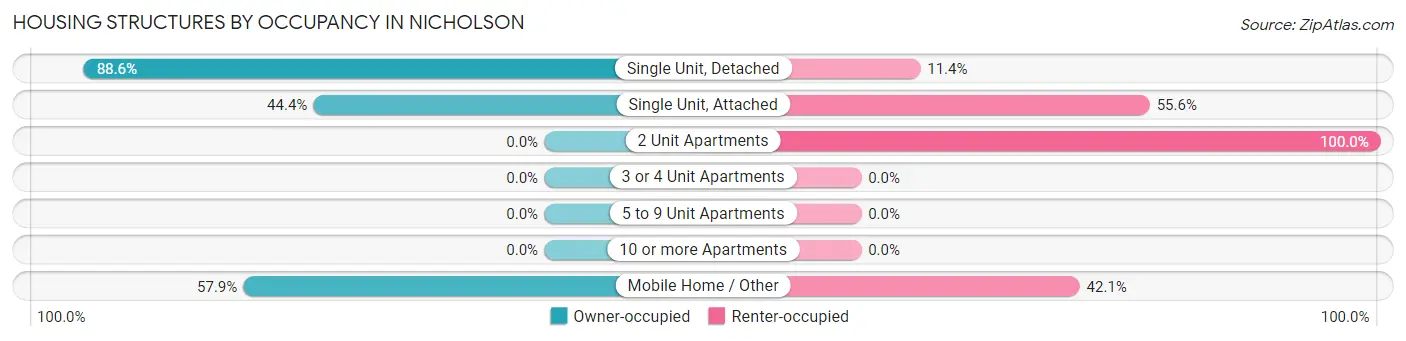
| Structure Type | Owner-occupied | Renter-occupied |
| Single Unit, Detached | 319 (88.6%) | 41 (11.4%) |
| Single Unit, Attached | 4 (44.4%) | 5 (55.6%) |
| 2 Unit Apartments | 0 (0.0%) | 13 (100.0%) |
| 3 or 4 Unit Apartments | 0 (0.0%) | 0 (0.0%) |
| 5 to 9 Unit Apartments | 0 (0.0%) | 0 (0.0%) |
| 10 or more Apartments | 0 (0.0%) | 0 (0.0%) |
| Mobile Home / Other | 190 (57.9%) | 138 (42.1%) |
| Total | 513 (72.3%) | 197 (27.8%) |
Housing Structures by Number of Rooms in Nicholson
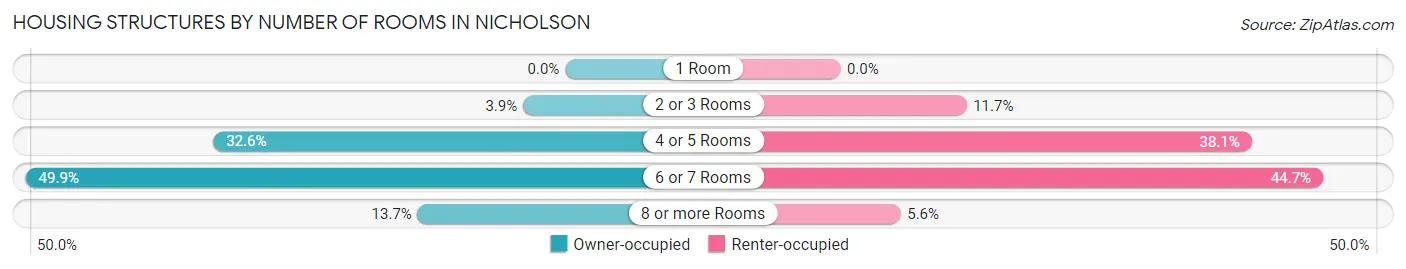
| Number of Rooms | Owner-occupied | Renter-occupied |
| 1 Room | 0 (0.0%) | 0 (0.0%) |
| 2 or 3 Rooms | 20 (3.9%) | 23 (11.7%) |
| 4 or 5 Rooms | 167 (32.6%) | 75 (38.1%) |
| 6 or 7 Rooms | 256 (49.9%) | 88 (44.7%) |
| 8 or more Rooms | 70 (13.7%) | 11 (5.6%) |
| Total | 513 (100.0%) | 197 (100.0%) |
Housing Structure by Heating Type in Nicholson
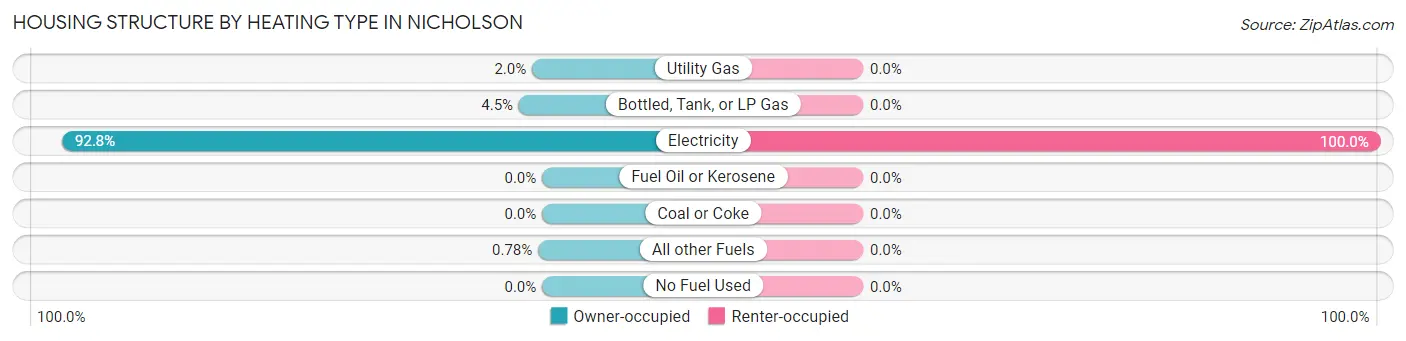
| Heating Type | Owner-occupied | Renter-occupied |
| Utility Gas | 10 (1.9%) | 0 (0.0%) |
| Bottled, Tank, or LP Gas | 23 (4.5%) | 0 (0.0%) |
| Electricity | 476 (92.8%) | 197 (100.0%) |
| Fuel Oil or Kerosene | 0 (0.0%) | 0 (0.0%) |
| Coal or Coke | 0 (0.0%) | 0 (0.0%) |
| All other Fuels | 4 (0.8%) | 0 (0.0%) |
| No Fuel Used | 0 (0.0%) | 0 (0.0%) |
| Total | 513 (100.0%) | 197 (100.0%) |
Household Vehicle Usage in Nicholson
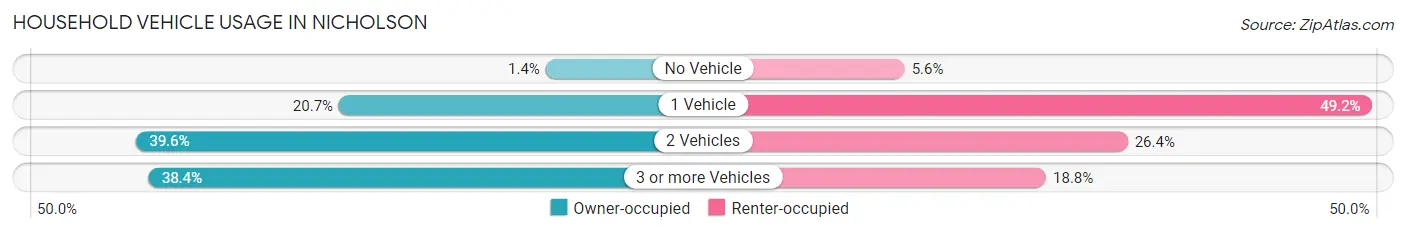
| Vehicles per Household | Owner-occupied | Renter-occupied |
| No Vehicle | 7 (1.4%) | 11 (5.6%) |
| 1 Vehicle | 106 (20.7%) | 97 (49.2%) |
| 2 Vehicles | 203 (39.6%) | 52 (26.4%) |
| 3 or more Vehicles | 197 (38.4%) | 37 (18.8%) |
| Total | 513 (100.0%) | 197 (100.0%) |
Real Estate & Mortgages in Nicholson
Real Estate and Mortgage Overview in Nicholson
| Characteristic | Without Mortgage | With Mortgage |
| Housing Units | 251 | 262 |
| Median Property Value | $82,100 | $153,600 |
| Median Household Income | $54,875 | $11 |
| Monthly Housing Costs | $434 | $0 |
| Real Estate Taxes | - | - |
Property Value by Mortgage Status in Nicholson
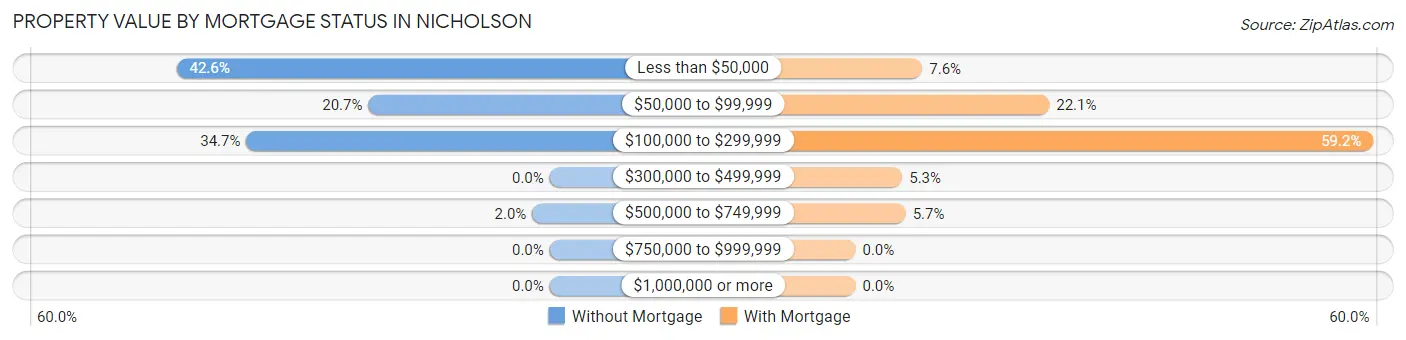
| Property Value | Without Mortgage | With Mortgage |
| Less than $50,000 | 107 (42.6%) | 20 (7.6%) |
| $50,000 to $99,999 | 52 (20.7%) | 58 (22.1%) |
| $100,000 to $299,999 | 87 (34.7%) | 155 (59.2%) |
| $300,000 to $499,999 | 0 (0.0%) | 14 (5.3%) |
| $500,000 to $749,999 | 5 (2.0%) | 15 (5.7%) |
| $750,000 to $999,999 | 0 (0.0%) | 0 (0.0%) |
| $1,000,000 or more | 0 (0.0%) | 0 (0.0%) |
| Total | 251 (100.0%) | 262 (100.0%) |
Household Income by Mortgage Status in Nicholson
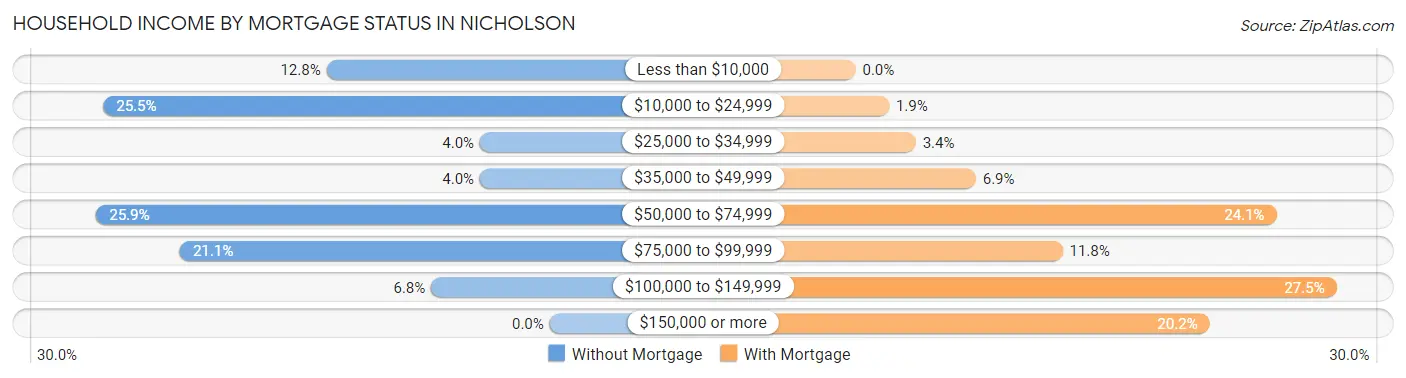
| Household Income | Without Mortgage | With Mortgage |
| Less than $10,000 | 32 (12.8%) | 0 (0.0%) |
| $10,000 to $24,999 | 64 (25.5%) | 5 (1.9%) |
| $25,000 to $34,999 | 10 (4.0%) | 9 (3.4%) |
| $35,000 to $49,999 | 10 (4.0%) | 18 (6.9%) |
| $50,000 to $74,999 | 65 (25.9%) | 63 (24.0%) |
| $75,000 to $99,999 | 53 (21.1%) | 31 (11.8%) |
| $100,000 to $149,999 | 17 (6.8%) | 72 (27.5%) |
| $150,000 or more | 0 (0.0%) | 53 (20.2%) |
| Total | 251 (100.0%) | 262 (100.0%) |
Property Value to Household Income Ratio in Nicholson
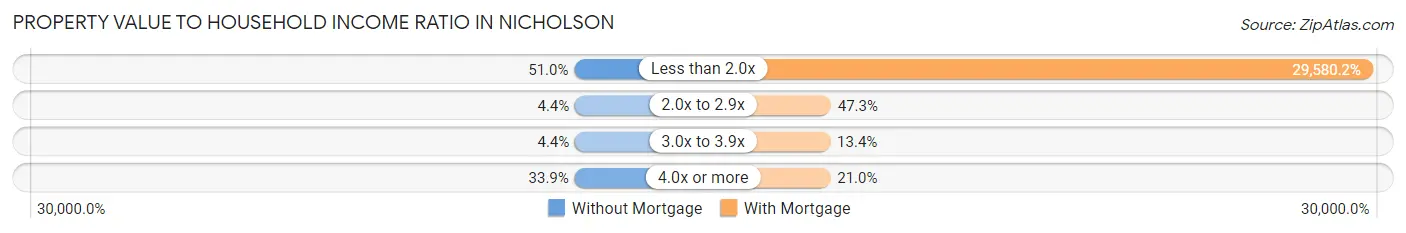
| Value-to-Income Ratio | Without Mortgage | With Mortgage |
| Less than 2.0x | 128 (51.0%) | 77,500 (29,580.1%) |
| 2.0x to 2.9x | 11 (4.4%) | 124 (47.3%) |
| 3.0x to 3.9x | 11 (4.4%) | 35 (13.4%) |
| 4.0x or more | 85 (33.9%) | 55 (21.0%) |
| Total | 251 (100.0%) | 262 (100.0%) |
Real Estate Taxes by Mortgage Status in Nicholson
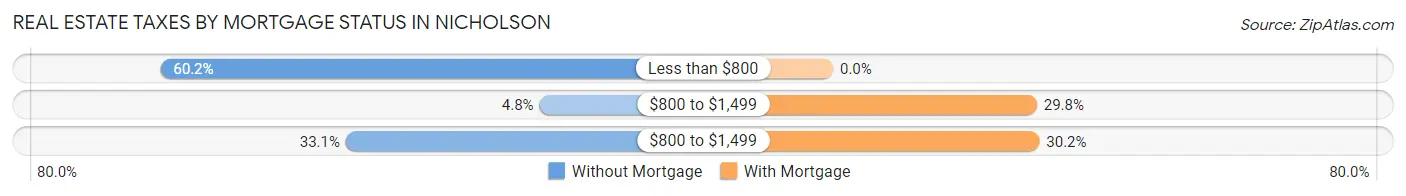
| Property Taxes | Without Mortgage | With Mortgage |
| Less than $800 | 151 (60.2%) | 0 (0.0%) |
| $800 to $1,499 | 12 (4.8%) | 78 (29.8%) |
| $800 to $1,499 | 83 (33.1%) | 79 (30.1%) |
| Total | 251 (100.0%) | 262 (100.0%) |
Health & Disability in Nicholson
Health Insurance Coverage by Age in Nicholson
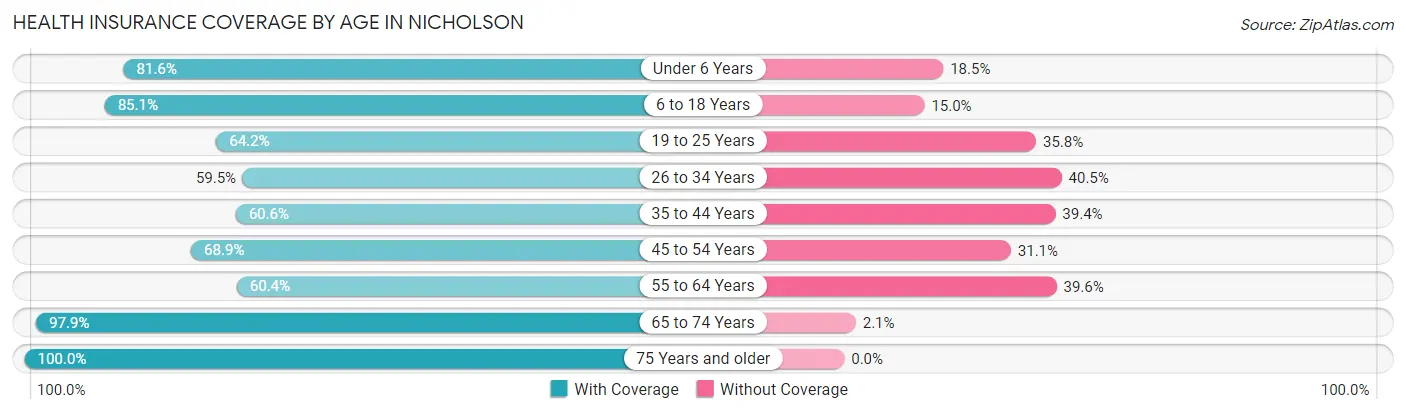
| Age Bracket | With Coverage | Without Coverage |
| Under 6 Years | 84 (81.6%) | 19 (18.4%) |
| 6 to 18 Years | 387 (85.1%) | 68 (14.9%) |
| 19 to 25 Years | 106 (64.2%) | 59 (35.8%) |
| 26 to 34 Years | 223 (59.5%) | 152 (40.5%) |
| 35 to 44 Years | 154 (60.6%) | 100 (39.4%) |
| 45 to 54 Years | 182 (68.9%) | 82 (31.1%) |
| 55 to 64 Years | 145 (60.4%) | 95 (39.6%) |
| 65 to 74 Years | 137 (97.9%) | 3 (2.1%) |
| 75 Years and older | 71 (100.0%) | 0 (0.0%) |
| Total | 1,489 (72.0%) | 578 (28.0%) |
Health Insurance Coverage by Citizenship Status in Nicholson
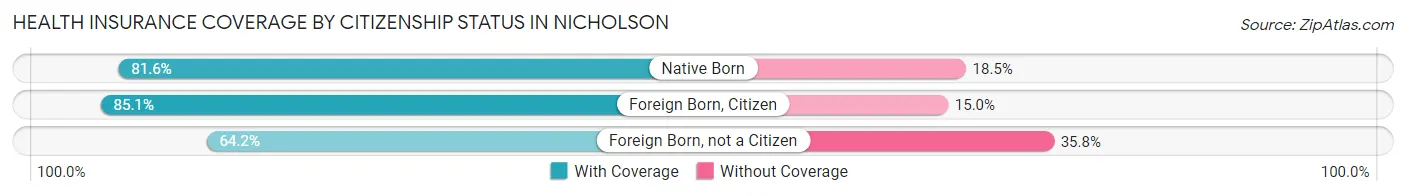
| Citizenship Status | With Coverage | Without Coverage |
| Native Born | 84 (81.6%) | 19 (18.4%) |
| Foreign Born, Citizen | 387 (85.1%) | 68 (14.9%) |
| Foreign Born, not a Citizen | 106 (64.2%) | 59 (35.8%) |
Health Insurance Coverage by Household Income in Nicholson
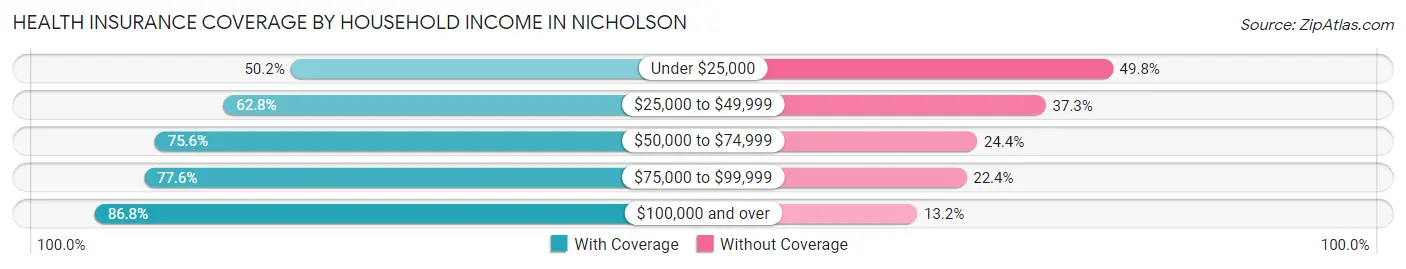
| Household Income | With Coverage | Without Coverage |
| Under $25,000 | 129 (50.2%) | 128 (49.8%) |
| $25,000 to $49,999 | 320 (62.7%) | 190 (37.2%) |
| $50,000 to $74,999 | 285 (75.6%) | 92 (24.4%) |
| $75,000 to $99,999 | 392 (77.6%) | 113 (22.4%) |
| $100,000 and over | 363 (86.8%) | 55 (13.2%) |
Public vs Private Health Insurance Coverage by Age in Nicholson
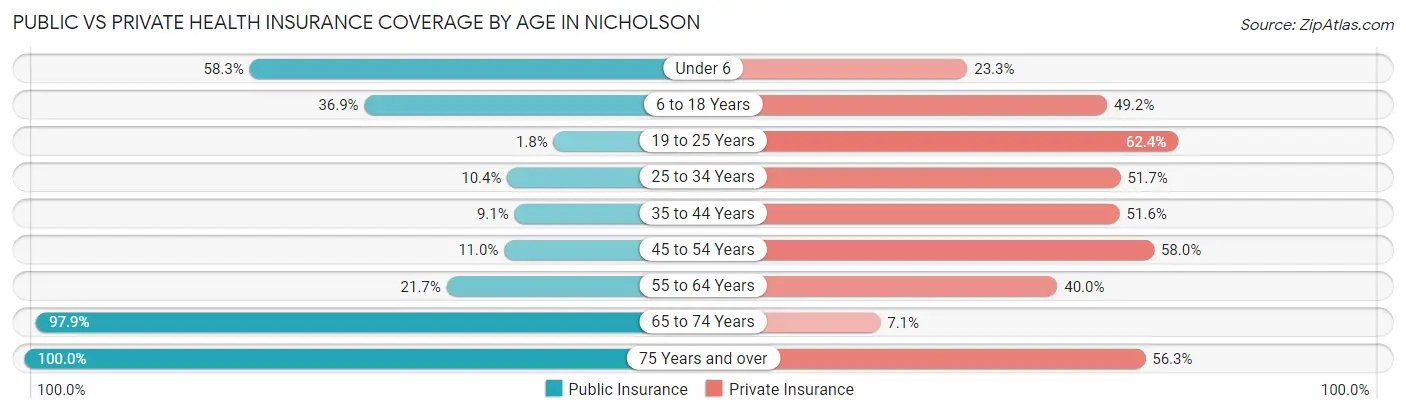
| Age Bracket | Public Insurance | Private Insurance |
| Under 6 | 60 (58.3%) | 24 (23.3%) |
| 6 to 18 Years | 168 (36.9%) | 224 (49.2%) |
| 19 to 25 Years | 3 (1.8%) | 103 (62.4%) |
| 25 to 34 Years | 39 (10.4%) | 194 (51.7%) |
| 35 to 44 Years | 23 (9.1%) | 131 (51.6%) |
| 45 to 54 Years | 29 (11.0%) | 153 (58.0%) |
| 55 to 64 Years | 52 (21.7%) | 96 (40.0%) |
| 65 to 74 Years | 137 (97.9%) | 10 (7.1%) |
| 75 Years and over | 71 (100.0%) | 40 (56.3%) |
| Total | 582 (28.2%) | 975 (47.2%) |
Disability Status by Sex by Age in Nicholson
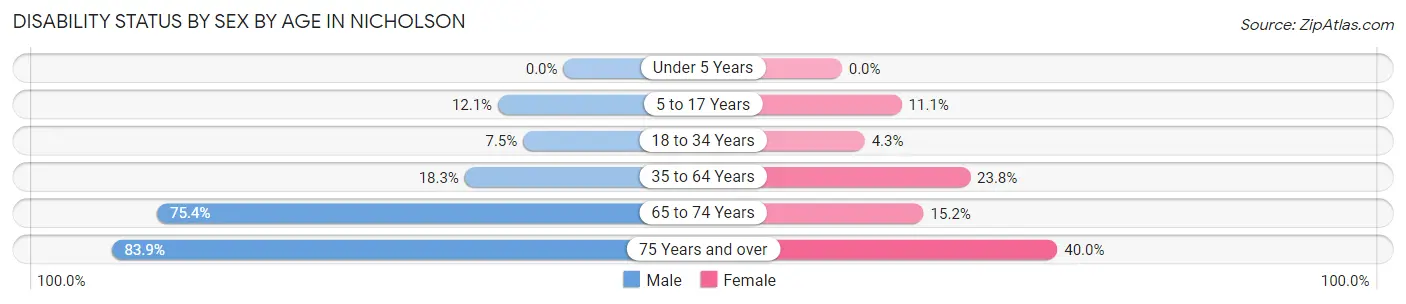
| Age Bracket | Male | Female |
| Under 5 Years | 0 (0.0%) | 0 (0.0%) |
| 5 to 17 Years | 34 (12.1%) | 20 (11.1%) |
| 18 to 34 Years | 23 (7.5%) | 11 (4.3%) |
| 35 to 64 Years | 65 (18.3%) | 96 (23.8%) |
| 65 to 74 Years | 46 (75.4%) | 12 (15.2%) |
| 75 Years and over | 26 (83.9%) | 16 (40.0%) |
Disability Class by Sex by Age in Nicholson
Disability Class: Hearing Difficulty
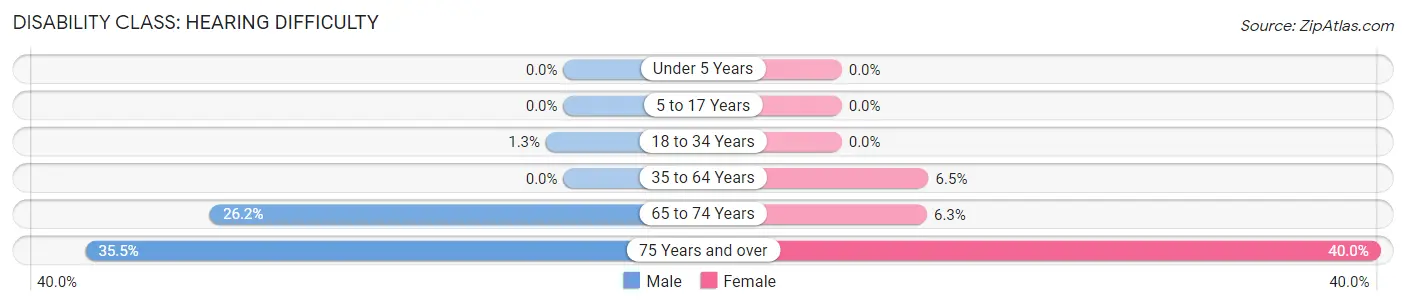
| Age Bracket | Male | Female |
| Under 5 Years | 0 (0.0%) | 0 (0.0%) |
| 5 to 17 Years | 0 (0.0%) | 0 (0.0%) |
| 18 to 34 Years | 4 (1.3%) | 0 (0.0%) |
| 35 to 64 Years | 0 (0.0%) | 26 (6.5%) |
| 65 to 74 Years | 16 (26.2%) | 5 (6.3%) |
| 75 Years and over | 11 (35.5%) | 16 (40.0%) |
Disability Class: Vision Difficulty
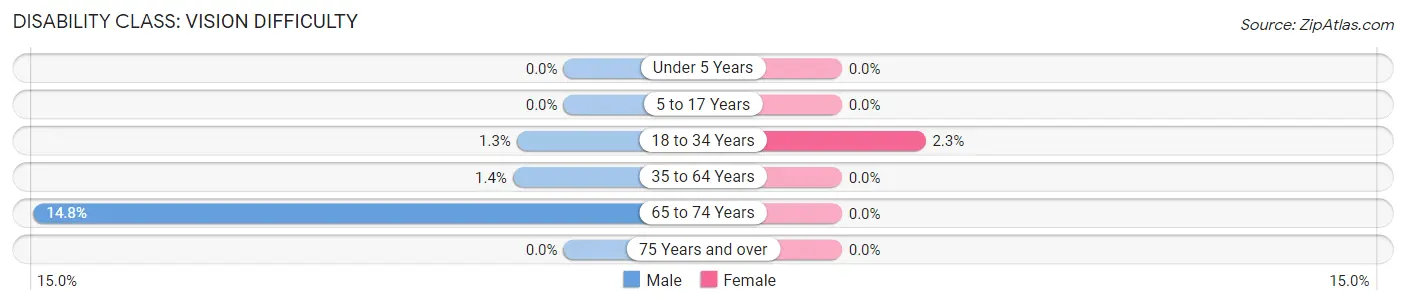
| Age Bracket | Male | Female |
| Under 5 Years | 0 (0.0%) | 0 (0.0%) |
| 5 to 17 Years | 0 (0.0%) | 0 (0.0%) |
| 18 to 34 Years | 4 (1.3%) | 6 (2.3%) |
| 35 to 64 Years | 5 (1.4%) | 0 (0.0%) |
| 65 to 74 Years | 9 (14.7%) | 0 (0.0%) |
| 75 Years and over | 0 (0.0%) | 0 (0.0%) |
Disability Class: Cognitive Difficulty
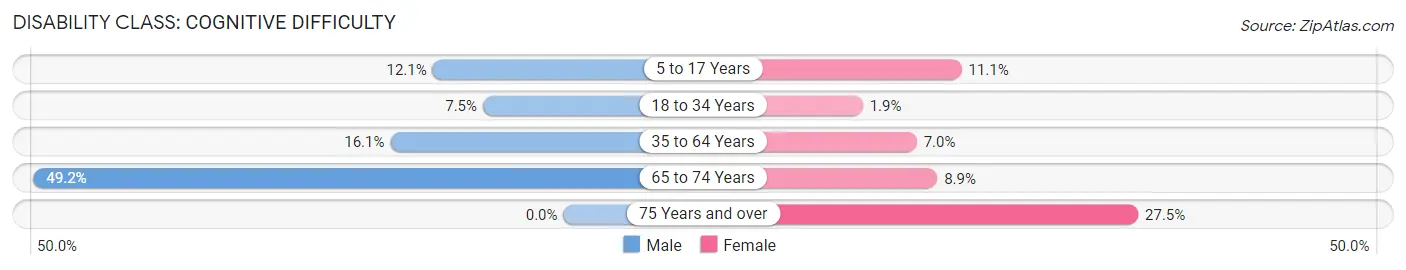
| Age Bracket | Male | Female |
| 5 to 17 Years | 34 (12.1%) | 20 (11.1%) |
| 18 to 34 Years | 23 (7.5%) | 5 (1.9%) |
| 35 to 64 Years | 57 (16.1%) | 28 (7.0%) |
| 65 to 74 Years | 30 (49.2%) | 7 (8.9%) |
| 75 Years and over | 0 (0.0%) | 11 (27.5%) |
Disability Class: Ambulatory Difficulty
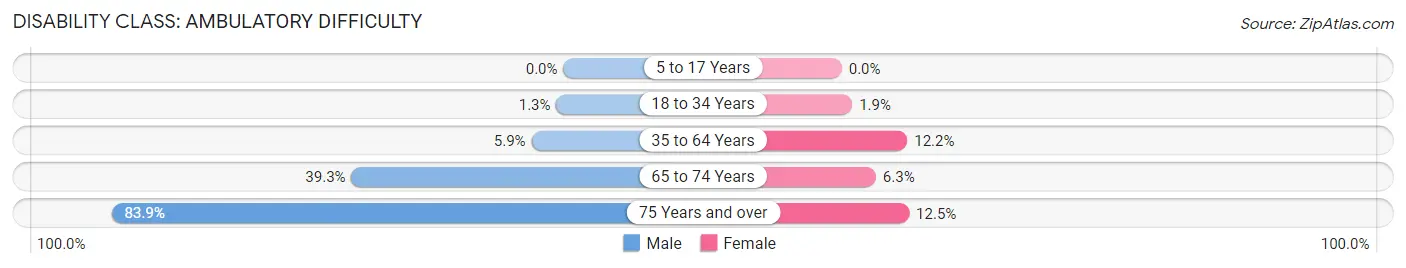
| Age Bracket | Male | Female |
| 5 to 17 Years | 0 (0.0%) | 0 (0.0%) |
| 18 to 34 Years | 4 (1.3%) | 5 (1.9%) |
| 35 to 64 Years | 21 (5.9%) | 49 (12.2%) |
| 65 to 74 Years | 24 (39.3%) | 5 (6.3%) |
| 75 Years and over | 26 (83.9%) | 5 (12.5%) |
Disability Class: Self-Care Difficulty
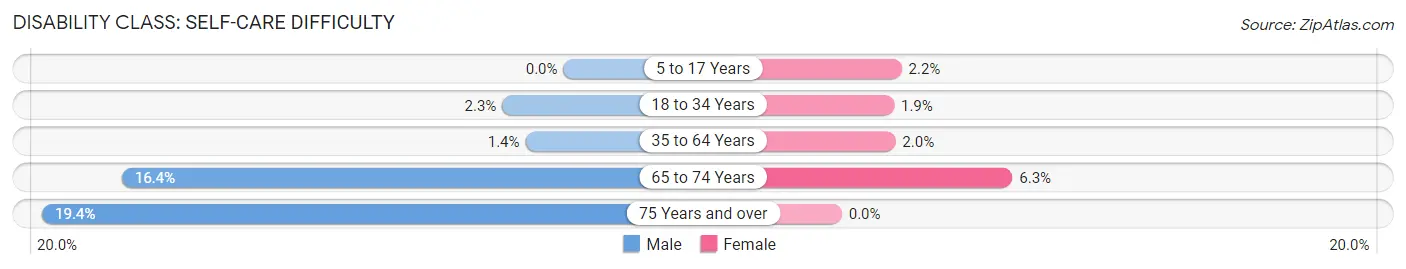
| Age Bracket | Male | Female |
| 5 to 17 Years | 0 (0.0%) | 4 (2.2%) |
| 18 to 34 Years | 7 (2.3%) | 5 (1.9%) |
| 35 to 64 Years | 5 (1.4%) | 8 (2.0%) |
| 65 to 74 Years | 10 (16.4%) | 5 (6.3%) |
| 75 Years and over | 6 (19.4%) | 0 (0.0%) |
Technology Access in Nicholson
Computing Device Access in Nicholson
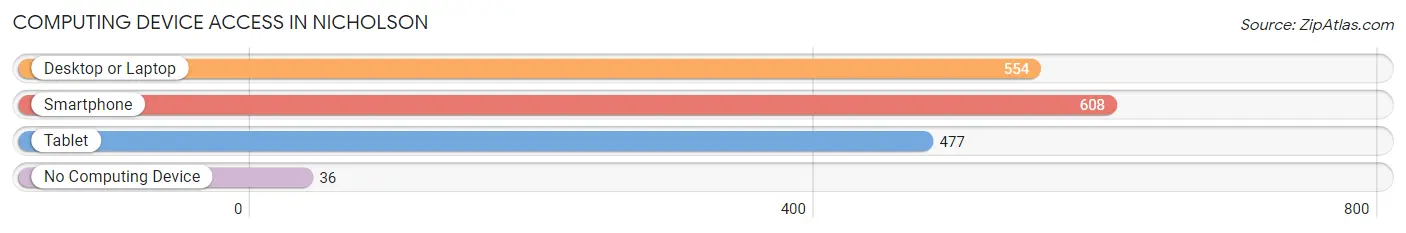
| Device Type | # Households | % Households |
| Desktop or Laptop | 554 | 78.0% |
| Smartphone | 608 | 85.6% |
| Tablet | 477 | 67.2% |
| No Computing Device | 36 | 5.1% |
| Total | 710 | 100.0% |
Internet Access in Nicholson
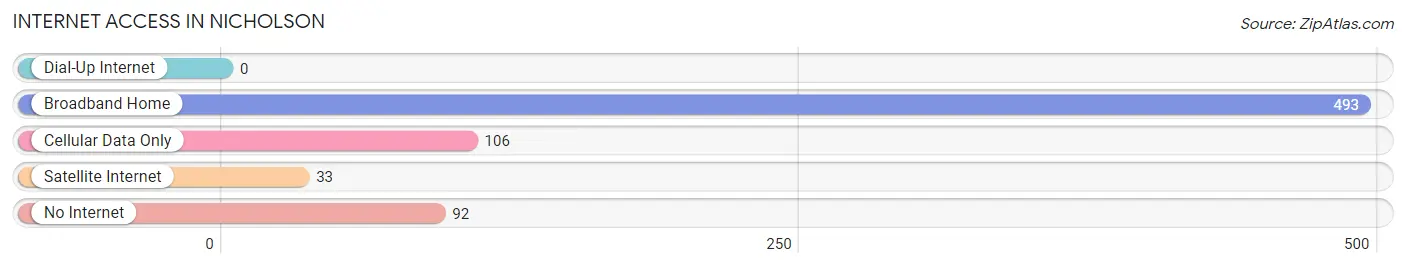
| Internet Type | # Households | % Households |
| Dial-Up Internet | 0 | 0.0% |
| Broadband Home | 493 | 69.4% |
| Cellular Data Only | 106 | 14.9% |
| Satellite Internet | 33 | 4.6% |
| No Internet | 92 | 13.0% |
| Total | 710 | 100.0% |
Nicholson Summary
Nicholson is a small city located in Jackson County, Georgia, United States. It is situated in the foothills of the Blue Ridge Mountains, approximately 50 miles northeast of Atlanta. The city has a population of approximately 1,500 people and covers an area of 1.2 square miles.
History
Nicholson was founded in 1883 by a group of settlers from the nearby town of Maysville. The town was named after the Nicholson family, who were among the first settlers. The town was incorporated in 1887 and was the first incorporated town in Jackson County.
In the early 1900s, Nicholson was a thriving agricultural community, with cotton, corn, and tobacco being the main crops. The town also had a number of small businesses, including a general store, a blacksmith shop, and a grist mill.
In the 1950s, the town began to decline as many of the residents moved away in search of better economic opportunities. The town was further impacted by the construction of Interstate 85, which bypassed Nicholson and diverted traffic away from the town.
Geography
Nicholson is located in the foothills of the Blue Ridge Mountains, approximately 50 miles northeast of Atlanta. The city is situated at an elevation of 1,000 feet above sea level. The city is surrounded by rolling hills and is located near the headwaters of the Apalachee River.
The climate in Nicholson is mild and humid, with temperatures ranging from the mid-30s in the winter to the mid-80s in the summer. The city receives an average of 48 inches of rain per year.
Economy
The economy of Nicholson is largely based on agriculture. The main crops grown in the area are cotton, corn, and tobacco. The city also has a number of small businesses, including a general store, a blacksmith shop, and a grist mill.
The city is also home to a number of manufacturing companies, including a furniture factory and a plastics factory. The city is also home to a number of small retail stores, restaurants, and other businesses.
Demographics
As of the 2010 census, the population of Nicholson was 1,500. The racial makeup of the city was 94.2% White, 3.3% African American, 0.7% Native American, 0.3% Asian, and 1.5% from other races.
The median household income in Nicholson was $37,500, and the median family income was $45,000. The per capita income in the city was $18,000. Approximately 15.5% of the population was below the poverty line.
Conclusion
Nicholson is a small city located in Jackson County, Georgia, United States. It is situated in the foothills of the Blue Ridge Mountains, approximately 50 miles northeast of Atlanta. The city has a population of approximately 1,500 people and covers an area of 1.2 square miles. The economy of Nicholson is largely based on agriculture, with cotton, corn, and tobacco being the main crops. The city also has a number of small businesses, including a general store, a blacksmith shop, and a grist mill. The racial makeup of the city was 94.2% White, 3.3% African American, 0.7% Native American, 0.3% Asian, and 1.5% from other races. The median household income in Nicholson was $37,500, and the median family income was $45,000.
Common Questions
What is Per Capita Income in Nicholson?
Per Capita income in Nicholson is $21,218.
What is the Median Family Income in Nicholson?
Median Family Income in Nicholson is $57,875.
What is the Median Household income in Nicholson?
Median Household Income in Nicholson is $50,000.
What is Income or Wage Gap in Nicholson?
Income or Wage Gap in Nicholson is 15.1%.
Women in Nicholson earn 84.9 cents for every dollar earned by a man.
What is Inequality or Gini Index in Nicholson?
Inequality or Gini Index in Nicholson is 0.34.
What is the Total Population of Nicholson?
Total Population of Nicholson is 2,067.
What is the Total Male Population of Nicholson?
Total Male Population of Nicholson is 1,089.
What is the Total Female Population of Nicholson?
Total Female Population of Nicholson is 978.
What is the Ratio of Males per 100 Females in Nicholson?
There are 111.35 Males per 100 Females in Nicholson.
What is the Ratio of Females per 100 Males in Nicholson?
There are 89.81 Females per 100 Males in Nicholson.
What is the Median Population Age in Nicholson?
Median Population Age in Nicholson is 34.2 Years.
What is the Average Family Size in Nicholson
Average Family Size in Nicholson is 3.4 People.
What is the Average Household Size in Nicholson
Average Household Size in Nicholson is 2.9 People.
How Large is the Labor Force in Nicholson?
There are 1,094 People in the Labor Forcein in Nicholson.
What is the Percentage of People in the Labor Force in Nicholson?
67.3% of People are in the Labor Force in Nicholson.
What is the Unemployment Rate in Nicholson?
Unemployment Rate in Nicholson is 12.2%.