Social Circle, GA Map & Demographics
Social Circle Map
Social Circle Overview
$30,414
PER CAPITA INCOME
$93,245
AVG FAMILY INCOME
$68,333
AVG HOUSEHOLD INCOME
26.8%
WAGE / INCOME GAP [ % ]
73.2¢/ $1
WAGE / INCOME GAP [ $ ]
0.37
INEQUALITY / GINI INDEX
5,011
TOTAL POPULATION
2,700
MALE POPULATION
2,311
FEMALE POPULATION
116.83
MALES / 100 FEMALES
85.59
FEMALES / 100 MALES
36.8
MEDIAN AGE
3.5
AVG FAMILY SIZE
2.8
AVG HOUSEHOLD SIZE
2,614
LABOR FORCE [ PEOPLE ]
64.8%
PERCENT IN LABOR FORCE
6.6%
UNEMPLOYMENT RATE
Social Circle Zip Codes
Income in Social Circle
Income Overview in Social Circle
Per Capita Income in Social Circle is $30,414, while median incomes of families and households are $93,245 and $68,333 respectively.
| Characteristic | Number | Measure |
| Per Capita Income | 5,011 | $30,414 |
| Median Family Income | 1,184 | $93,245 |
| Mean Family Income | 1,184 | $101,517 |
| Median Household Income | 1,784 | $68,333 |
| Mean Household Income | 1,784 | $81,464 |
| Income Deficit | 1,184 | $0 |
| Wage / Income Gap (%) | 5,011 | 26.83% |
| Wage / Income Gap ($) | 5,011 | 73.17¢ per $1 |
| Gini / Inequality Index | 5,011 | 0.37 |
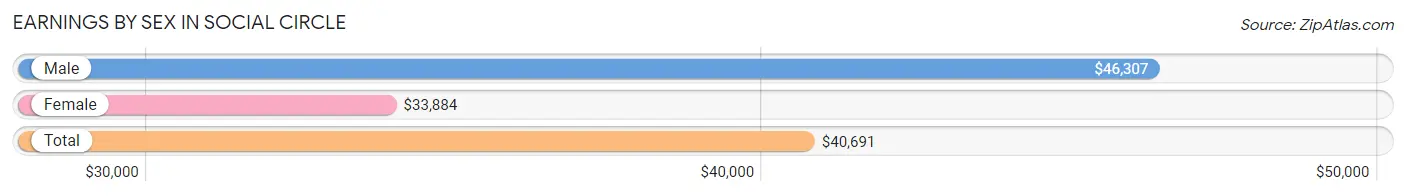
Earnings by Sex in Social Circle
Average Earnings in Social Circle are $40,691, $46,307 for men and $33,884 for women, a difference of 26.8%.
| Sex | Number | Average Earnings |
| Male | 1,328 (50.3%) | $46,307 |
| Female | 1,312 (49.7%) | $33,884 |
| Total | 2,640 (100.0%) | $40,691 |
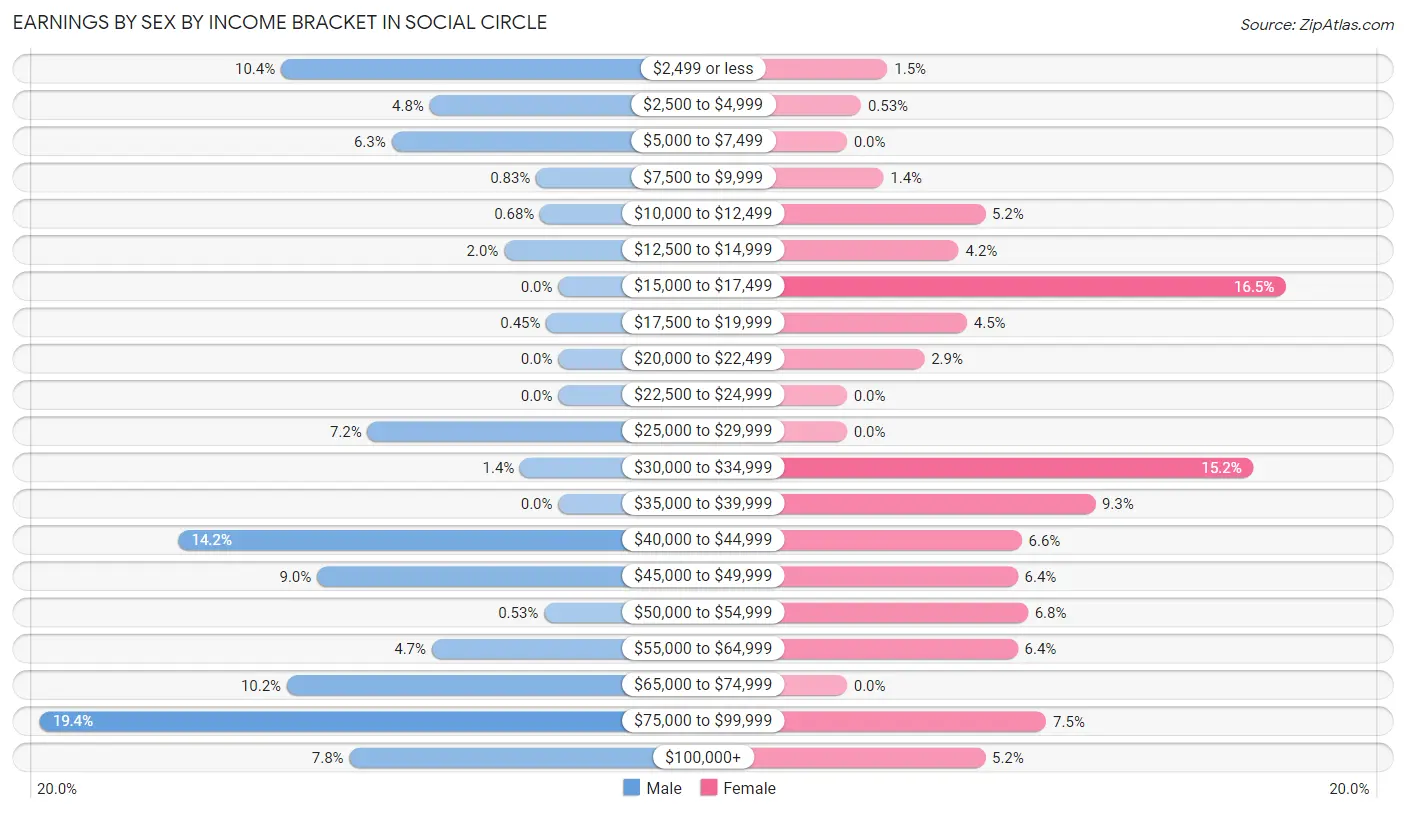
Earnings by Sex by Income Bracket in Social Circle
The most common earnings brackets in Social Circle are $75,000 to $99,999 for men (258 | 19.4%) and $15,000 to $17,499 for women (216 | 16.5%).
| Income | Male | Female |
| $2,499 or less | 138 (10.4%) | 20 (1.5%) |
| $2,500 to $4,999 | 64 (4.8%) | 7 (0.5%) |
| $5,000 to $7,499 | 83 (6.2%) | 0 (0.0%) |
| $7,500 to $9,999 | 11 (0.8%) | 18 (1.4%) |
| $10,000 to $12,499 | 9 (0.7%) | 68 (5.2%) |
| $12,500 to $14,999 | 27 (2.0%) | 55 (4.2%) |
| $15,000 to $17,499 | 0 (0.0%) | 216 (16.5%) |
| $17,500 to $19,999 | 6 (0.4%) | 59 (4.5%) |
| $20,000 to $22,499 | 0 (0.0%) | 38 (2.9%) |
| $22,500 to $24,999 | 0 (0.0%) | 0 (0.0%) |
| $25,000 to $29,999 | 95 (7.1%) | 0 (0.0%) |
| $30,000 to $34,999 | 19 (1.4%) | 200 (15.2%) |
| $35,000 to $39,999 | 0 (0.0%) | 122 (9.3%) |
| $40,000 to $44,999 | 189 (14.2%) | 86 (6.6%) |
| $45,000 to $49,999 | 120 (9.0%) | 84 (6.4%) |
| $50,000 to $54,999 | 7 (0.5%) | 89 (6.8%) |
| $55,000 to $64,999 | 63 (4.7%) | 84 (6.4%) |
| $65,000 to $74,999 | 135 (10.2%) | 0 (0.0%) |
| $75,000 to $99,999 | 258 (19.4%) | 98 (7.5%) |
| $100,000+ | 104 (7.8%) | 68 (5.2%) |
| Total | 1,328 (100.0%) | 1,312 (100.0%) |
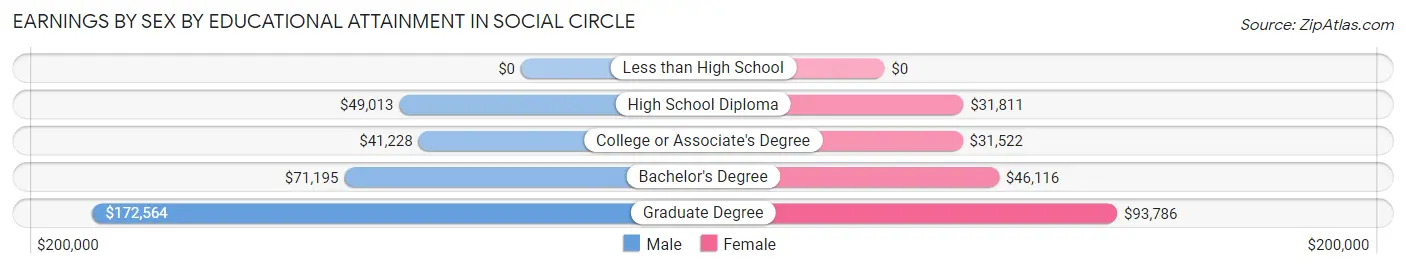
Earnings by Sex by Educational Attainment in Social Circle
Average earnings in Social Circle are $49,770 for men and $38,354 for women, a difference of 22.9%. Men with an educational attainment of graduate degree enjoy the highest average annual earnings of $172,564, while those with college or associate's degree education earn the least with $41,228. Women with an educational attainment of graduate degree earn the most with the average annual earnings of $93,786, while those with college or associate's degree education have the smallest earnings of $31,522.
| Educational Attainment | Male Income | Female Income |
| Less than High School | - | - |
| High School Diploma | $49,013 | $31,811 |
| College or Associate's Degree | $41,228 | $31,522 |
| Bachelor's Degree | $71,195 | $46,116 |
| Graduate Degree | $172,564 | $93,786 |
| Total | $49,770 | $38,354 |
Family Income in Social Circle
Family Income Brackets in Social Circle
According to the Social Circle family income data, there are 308 families falling into the $75,000 to $99,999 income range, which is the most common income bracket and makes up 26.0% of all families.
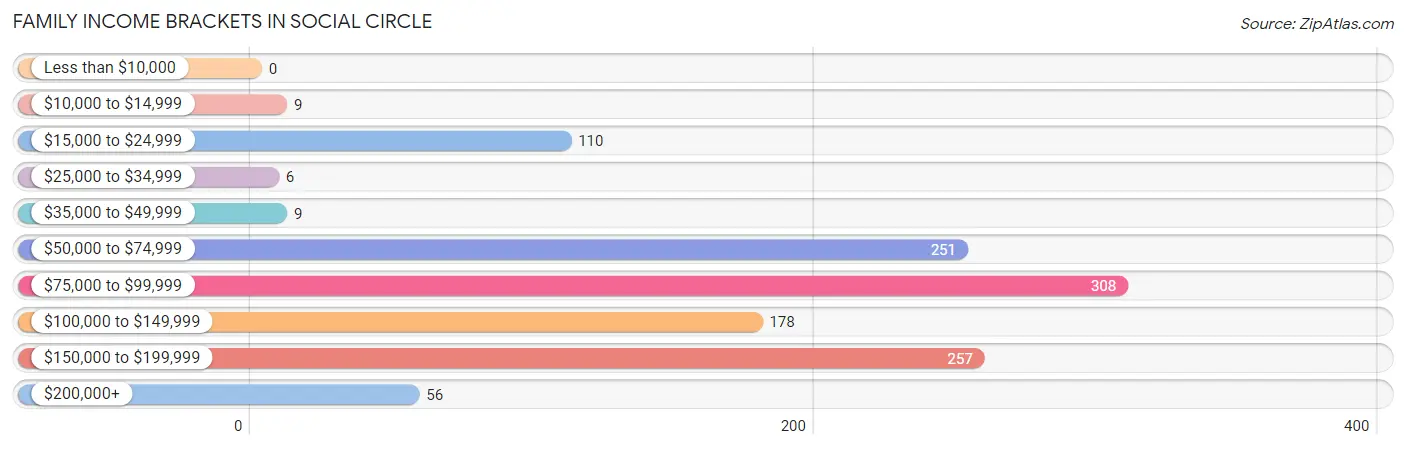
| Income Bracket | # Families | % Families |
| Less than $10,000 | 0 | 0.0% |
| $10,000 to $14,999 | 9 | 0.8% |
| $15,000 to $24,999 | 110 | 9.3% |
| $25,000 to $34,999 | 6 | 0.5% |
| $35,000 to $49,999 | 9 | 0.8% |
| $50,000 to $74,999 | 251 | 21.2% |
| $75,000 to $99,999 | 308 | 26.0% |
| $100,000 to $149,999 | 178 | 15.0% |
| $150,000 to $199,999 | 257 | 21.7% |
| $200,000+ | 56 | 4.7% |
Family Income by Famaliy Size in Social Circle
3-person families (226 | 19.1%) account for the highest median family income in Social Circle with $105,375 per family, while 2-person families (517 | 43.7%) have the highest median income of $47,682 per family member.
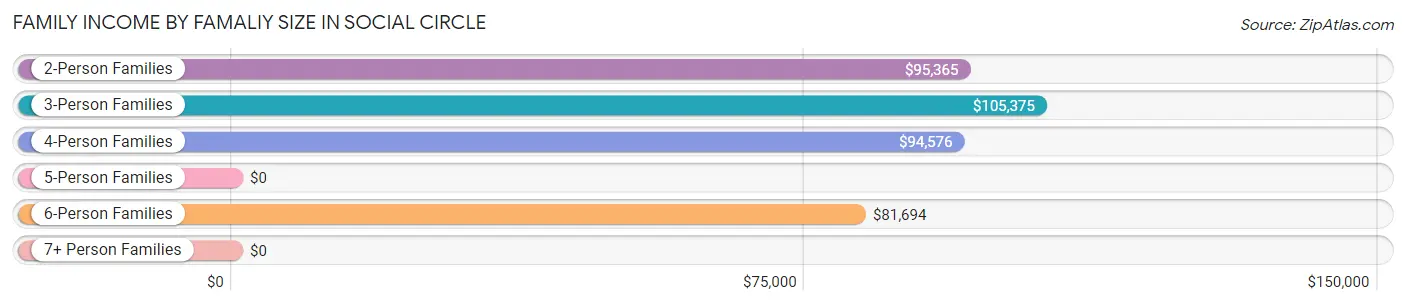
| Income Bracket | # Families | Median Income |
| 2-Person Families | 517 (43.7%) | $95,365 |
| 3-Person Families | 226 (19.1%) | $105,375 |
| 4-Person Families | 188 (15.9%) | $94,576 |
| 5-Person Families | 149 (12.6%) | $0 |
| 6-Person Families | 90 (7.6%) | $81,694 |
| 7+ Person Families | 14 (1.2%) | $0 |
| Total | 1,184 (100.0%) | $93,245 |
Family Income by Number of Earners in Social Circle
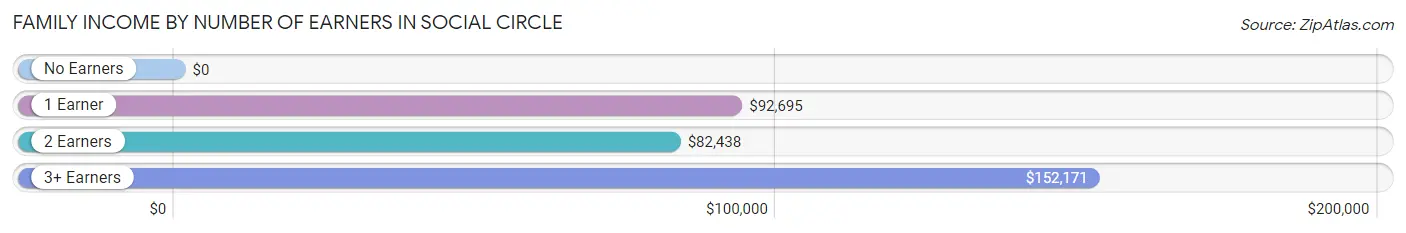
| Number of Earners | # Families | Median Income |
| No Earners | 86 (7.3%) | $0 |
| 1 Earner | 254 (21.4%) | $92,695 |
| 2 Earners | 700 (59.1%) | $82,438 |
| 3+ Earners | 144 (12.2%) | $152,171 |
| Total | 1,184 (100.0%) | $93,245 |
Household Income in Social Circle
Household Income Brackets in Social Circle
With 407 households falling in the category, the $50,000 to $74,999 income range is the most frequent in Social Circle, accounting for 22.8% of all households. In contrast, only 9 households (0.5%) fall into the $10,000 to $14,999 income bracket, making it the least populous group.
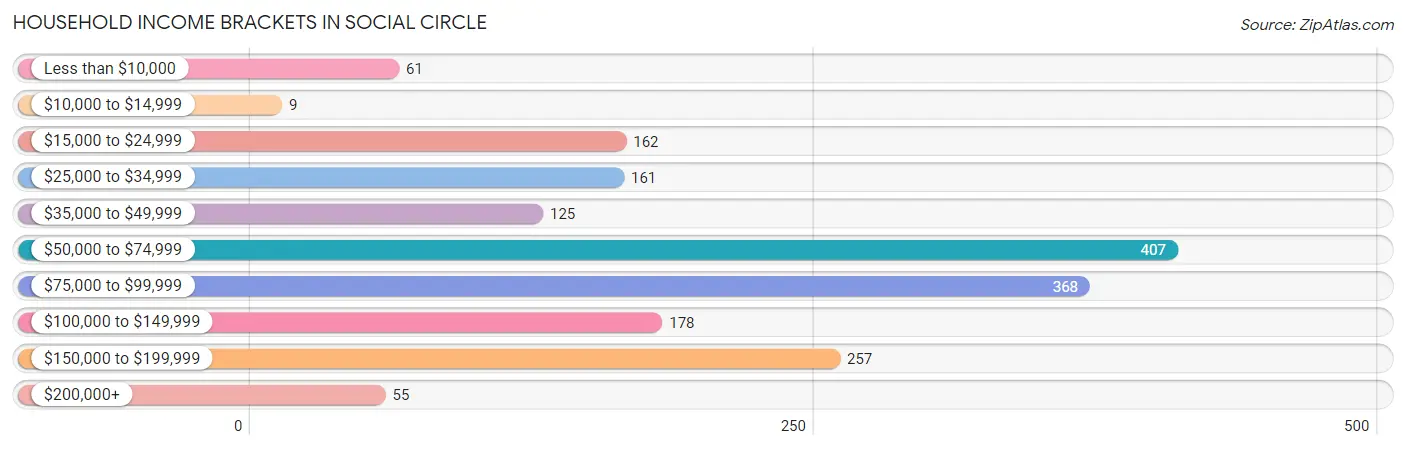
| Income Bracket | # Households | % Households |
| Less than $10,000 | 61 | 3.4% |
| $10,000 to $14,999 | 9 | 0.5% |
| $15,000 to $24,999 | 162 | 9.1% |
| $25,000 to $34,999 | 161 | 9.0% |
| $35,000 to $49,999 | 125 | 7.0% |
| $50,000 to $74,999 | 407 | 22.8% |
| $75,000 to $99,999 | 368 | 20.6% |
| $100,000 to $149,999 | 178 | 10.0% |
| $150,000 to $199,999 | 257 | 14.4% |
| $200,000+ | 55 | 3.1% |
Household Income by Householder Age in Social Circle
The median household income in Social Circle is $68,333, with the highest median household income of $82,917 found in the 25 to 44 years age bracket for the primary householder. A total of 611 households (34.3%) fall into this category. Meanwhile, the 15 to 24 years age bracket for the primary householder has the lowest median household income of $0, with 76 households (4.3%) in this group.
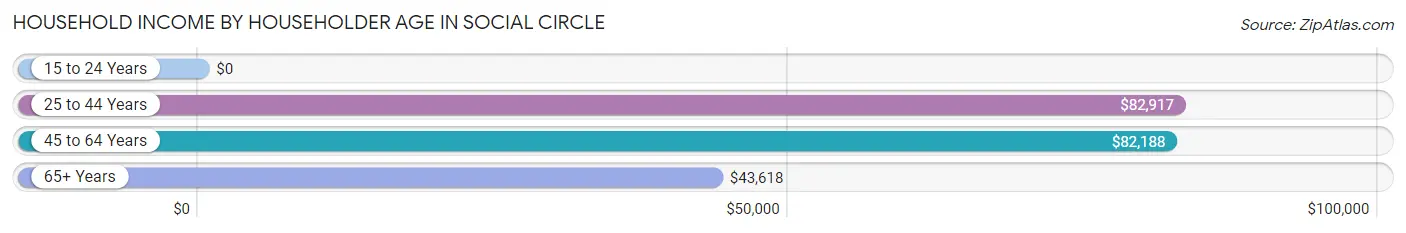
| Income Bracket | # Households | Median Income |
| 15 to 24 Years | 76 (4.3%) | $0 |
| 25 to 44 Years | 611 (34.3%) | $82,917 |
| 45 to 64 Years | 614 (34.4%) | $82,188 |
| 65+ Years | 483 (27.1%) | $43,618 |
| Total | 1,784 (100.0%) | $68,333 |
Poverty in Social Circle
Income Below Poverty by Sex and Age in Social Circle
With 5.8% poverty level for males and 5.7% for females among the residents of Social Circle, 25 to 34 year old males and 18 to 24 year old females are the most vulnerable to poverty, with 83 males (18.6%) and 33 females (15.1%) in their respective age groups living below the poverty level.
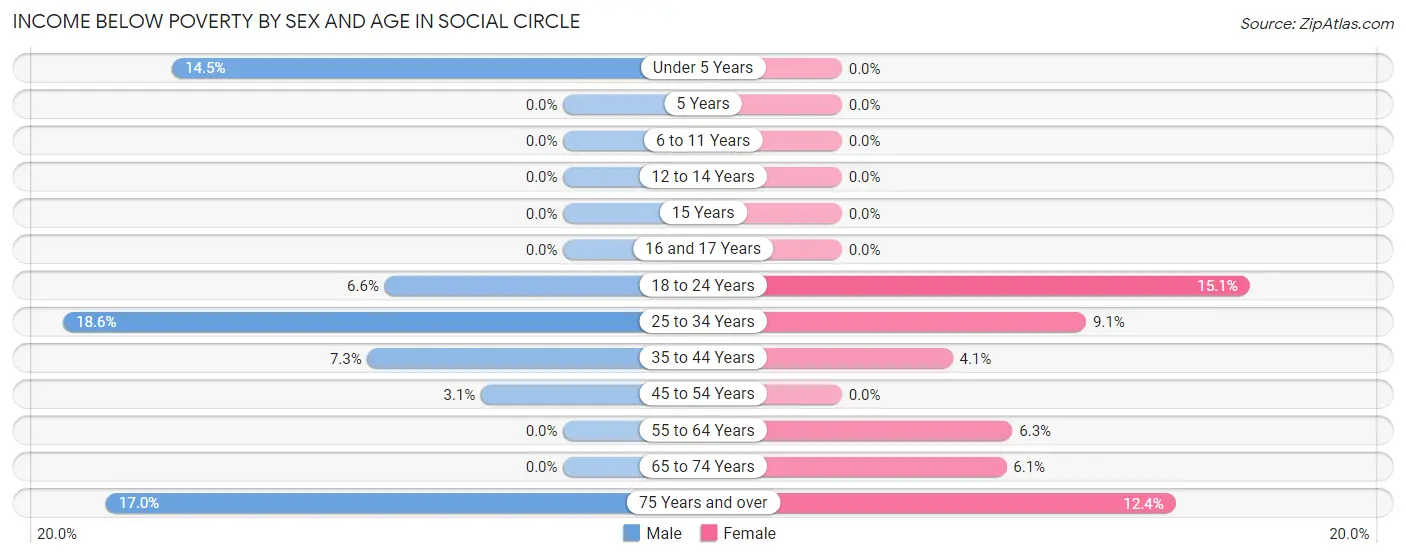
| Age Bracket | Male | Female |
| Under 5 Years | 9 (14.5%) | 0 (0.0%) |
| 5 Years | 0 (0.0%) | 0 (0.0%) |
| 6 to 11 Years | 0 (0.0%) | 0 (0.0%) |
| 12 to 14 Years | 0 (0.0%) | 0 (0.0%) |
| 15 Years | 0 (0.0%) | 0 (0.0%) |
| 16 and 17 Years | 0 (0.0%) | 0 (0.0%) |
| 18 to 24 Years | 12 (6.6%) | 33 (15.1%) |
| 25 to 34 Years | 83 (18.6%) | 33 (9.1%) |
| 35 to 44 Years | 25 (7.3%) | 9 (4.1%) |
| 45 to 54 Years | 9 (3.0%) | 0 (0.0%) |
| 55 to 64 Years | 0 (0.0%) | 25 (6.3%) |
| 65 to 74 Years | 0 (0.0%) | 14 (6.1%) |
| 75 Years and over | 18 (17.0%) | 14 (12.4%) |
| Total | 156 (5.8%) | 128 (5.7%) |
Income Above Poverty by Sex and Age in Social Circle
According to the poverty statistics in Social Circle, males aged 6 to 11 years and females aged under 5 years are the age groups that are most secure financially, with 100.0% of males and 100.0% of females in these age groups living above the poverty line.
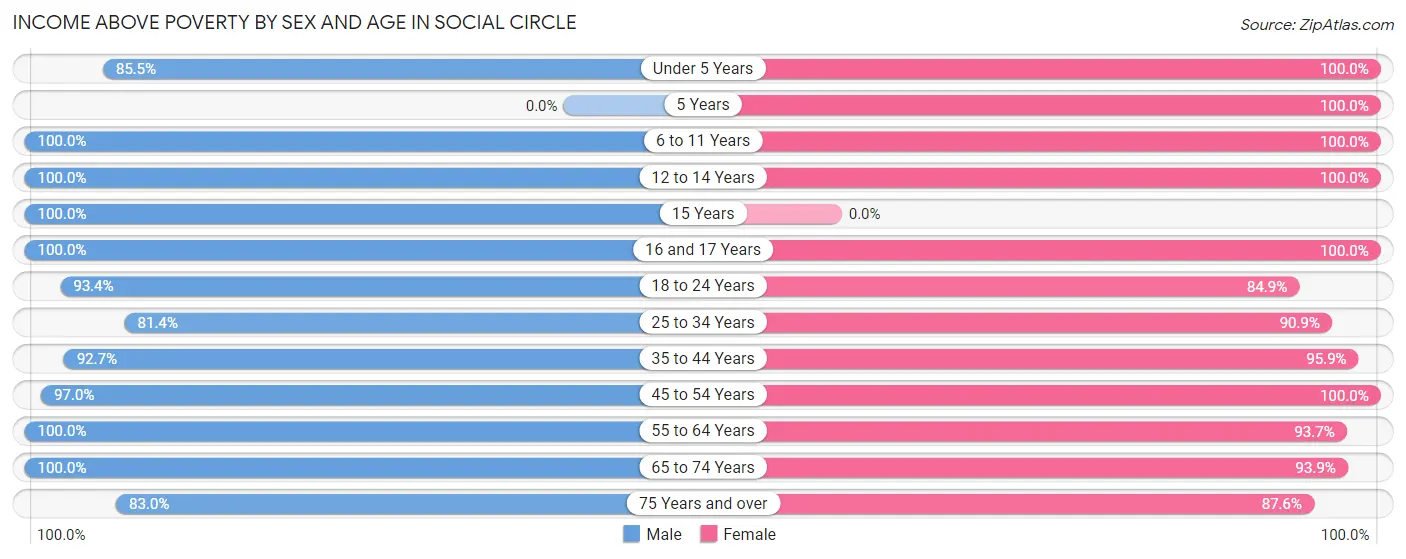
| Age Bracket | Male | Female |
| Under 5 Years | 53 (85.5%) | 167 (100.0%) |
| 5 Years | 0 (0.0%) | 44 (100.0%) |
| 6 to 11 Years | 199 (100.0%) | 122 (100.0%) |
| 12 to 14 Years | 181 (100.0%) | 95 (100.0%) |
| 15 Years | 107 (100.0%) | 0 (0.0%) |
| 16 and 17 Years | 232 (100.0%) | 12 (100.0%) |
| 18 to 24 Years | 169 (93.4%) | 185 (84.9%) |
| 25 to 34 Years | 364 (81.4%) | 331 (90.9%) |
| 35 to 44 Years | 319 (92.7%) | 210 (95.9%) |
| 45 to 54 Years | 286 (97.0%) | 268 (100.0%) |
| 55 to 64 Years | 315 (100.0%) | 370 (93.7%) |
| 65 to 74 Years | 218 (100.0%) | 215 (93.9%) |
| 75 Years and over | 88 (83.0%) | 99 (87.6%) |
| Total | 2,531 (94.2%) | 2,118 (94.3%) |
Income Below Poverty Among Married-Couple Families in Social Circle
The poverty statistics for married-couple families in Social Circle show that 0.9% or 9 of the total 960 families live below the poverty line. Families with 1 or 2 children have the highest poverty rate of 2.9%, comprising of 9 families. On the other hand, families with no children have the lowest poverty rate of 0.0%, which includes 0 families.
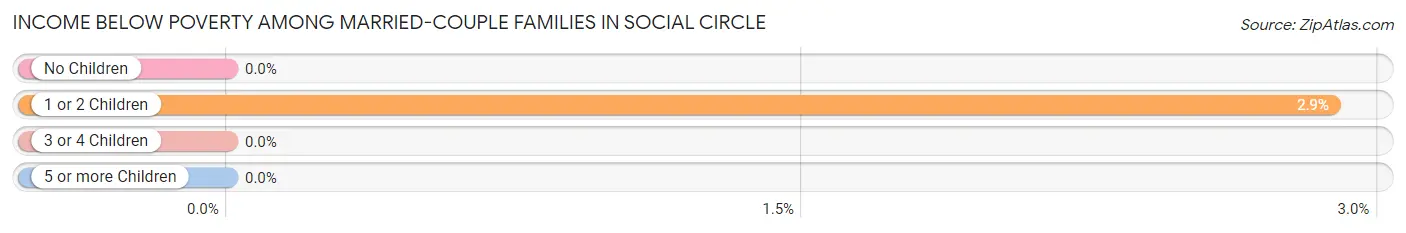
| Children | Above Poverty | Below Poverty |
| No Children | 451 (100.0%) | 0 (0.0%) |
| 1 or 2 Children | 304 (97.1%) | 9 (2.9%) |
| 3 or 4 Children | 196 (100.0%) | 0 (0.0%) |
| 5 or more Children | 0 (0.0%) | 0 (0.0%) |
| Total | 951 (99.1%) | 9 (0.9%) |
Income Below Poverty Among Single-Parent Households in Social Circle
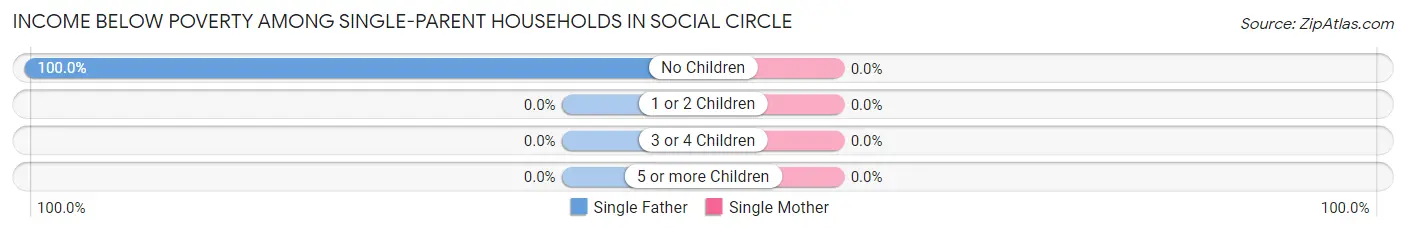
| Children | Single Father | Single Mother |
| No Children | 101 (100.0%) | 0 (0.0%) |
| 1 or 2 Children | 0 (0.0%) | 0 (0.0%) |
| 3 or 4 Children | 0 (0.0%) | 0 (0.0%) |
| 5 or more Children | 0 (0.0%) | 0 (0.0%) |
| Total | 101 (60.8%) | 0 (0.0%) |
Income Below Poverty Among Married-Couple vs Single-Parent Households in Social Circle
The poverty data for Social Circle shows that 9 of the married-couple family households (0.9%) and 101 of the single-parent households (45.1%) are living below the poverty level. Within the married-couple family households, those with 1 or 2 children have the highest poverty rate, with 9 households (2.9%) falling below the poverty line. Among the single-parent households, those with no children have the highest poverty rate, with 101 household (63.5%) living below poverty.
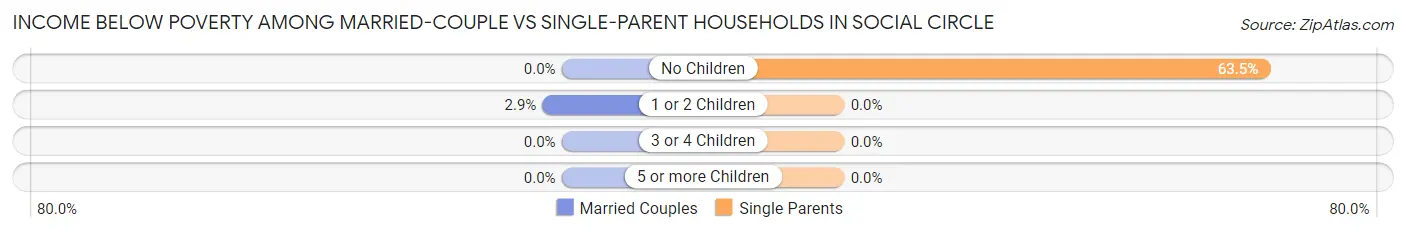
| Children | Married-Couple Families | Single-Parent Households |
| No Children | 0 (0.0%) | 101 (63.5%) |
| 1 or 2 Children | 9 (2.9%) | 0 (0.0%) |
| 3 or 4 Children | 0 (0.0%) | 0 (0.0%) |
| 5 or more Children | 0 (0.0%) | 0 (0.0%) |
| Total | 9 (0.9%) | 101 (45.1%) |
Race in Social Circle
The most populous races in Social Circle are White / Caucasian (3,341 | 66.7%), Black / African American (1,652 | 33.0%), and Hispanic or Latino (116 | 2.3%).
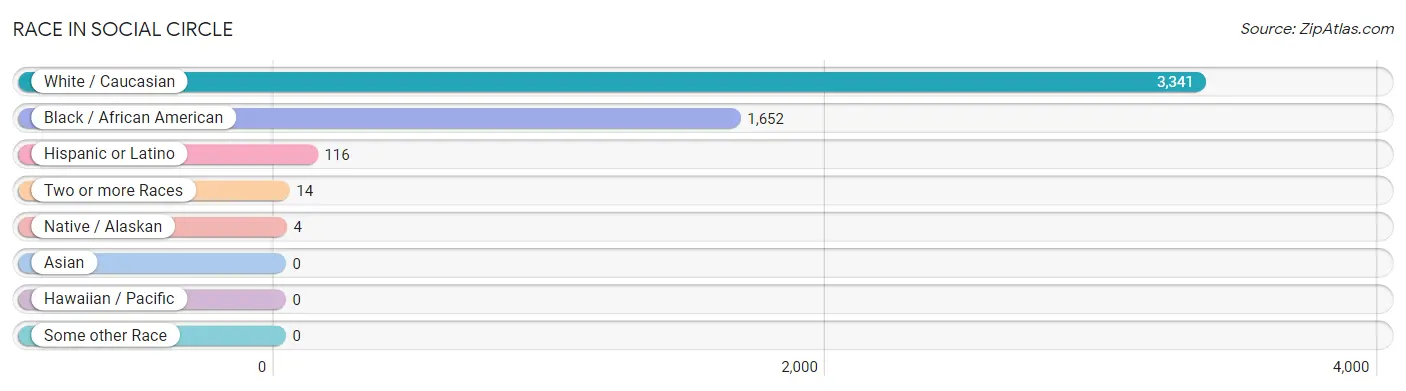
| Race | # Population | % Population |
| Asian | 0 | 0.0% |
| Black / African American | 1,652 | 33.0% |
| Hawaiian / Pacific | 0 | 0.0% |
| Hispanic or Latino | 116 | 2.3% |
| Native / Alaskan | 4 | 0.1% |
| White / Caucasian | 3,341 | 66.7% |
| Two or more Races | 14 | 0.3% |
| Some other Race | 0 | 0.0% |
| Total | 5,011 | 100.0% |
Ancestry in Social Circle
The most populous ancestries reported in Social Circle are German (526 | 10.5%), Irish (442 | 8.8%), English (400 | 8.0%), American (333 | 6.7%), and Norwegian (244 | 4.9%), together accounting for 38.8% of all Social Circle residents.
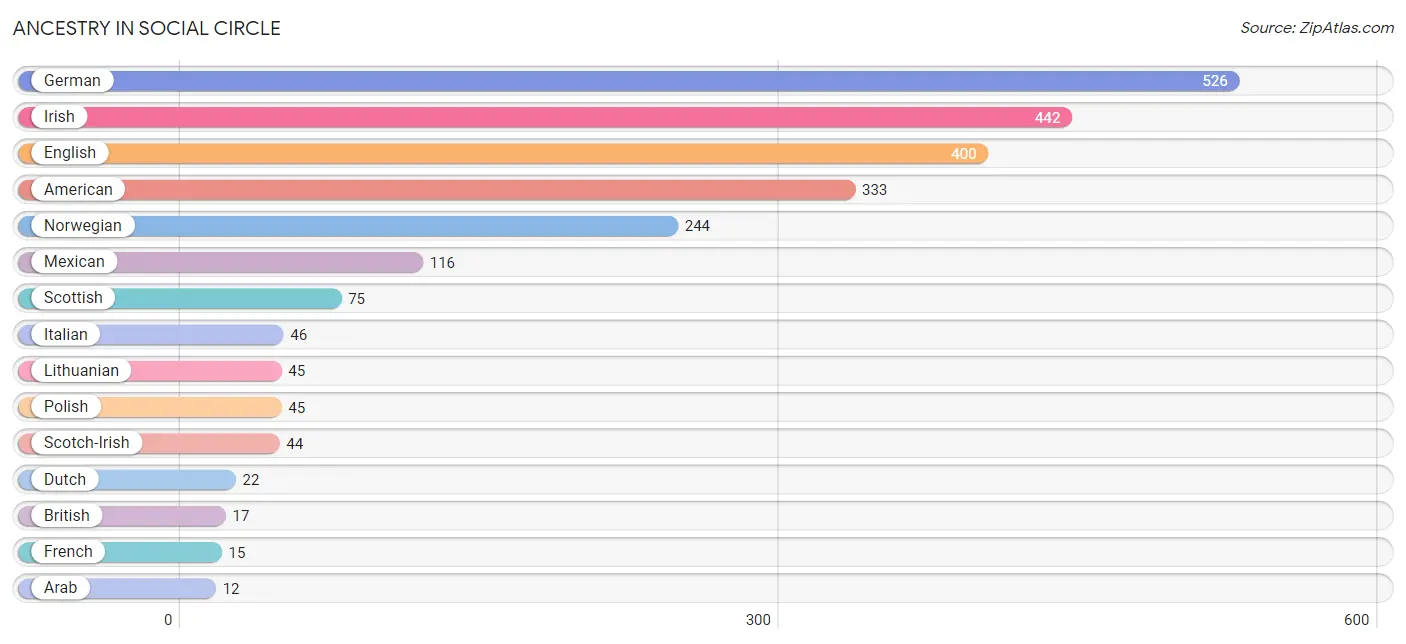
| Ancestry | # Population | % Population |
| American | 333 | 6.7% |
| Arab | 12 | 0.2% |
| Blackfeet | 4 | 0.1% |
| British | 17 | 0.3% |
| Cherokee | 3 | 0.1% |
| Dutch | 22 | 0.4% |
| English | 400 | 8.0% |
| French | 15 | 0.3% |
| German | 526 | 10.5% |
| Irish | 442 | 8.8% |
| Italian | 46 | 0.9% |
| Lithuanian | 45 | 0.9% |
| Mexican | 116 | 2.3% |
| Norwegian | 244 | 4.9% |
| Palestinian | 12 | 0.2% |
| Polish | 45 | 0.9% |
| Scotch-Irish | 44 | 0.9% |
| Scottish | 75 | 1.5% |
| Welsh | 8 | 0.2% | View All 19 Rows |
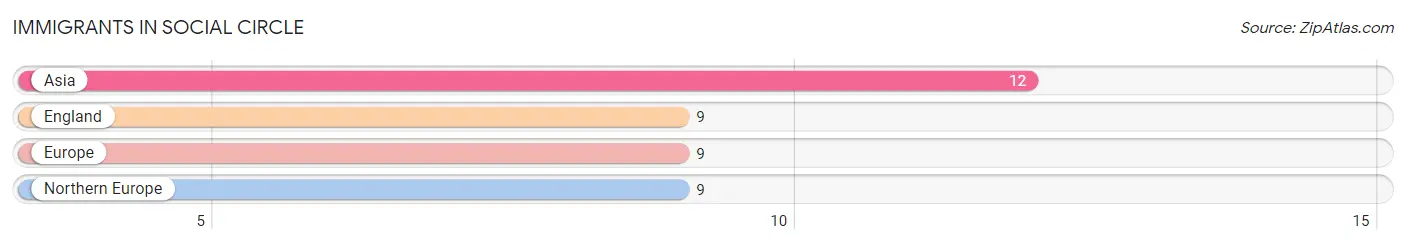
Immigrants in Social Circle
The most numerous immigrant groups reported in Social Circle came from Asia (12 | 0.2%), England (9 | 0.2%), Europe (9 | 0.2%), and Northern Europe (9 | 0.2%), together accounting for 0.8% of all Social Circle residents.
| Immigration Origin | # Population | % Population |
| Asia | 12 | 0.2% |
| England | 9 | 0.2% |
| Europe | 9 | 0.2% |
| Northern Europe | 9 | 0.2% | View All 4 Rows |
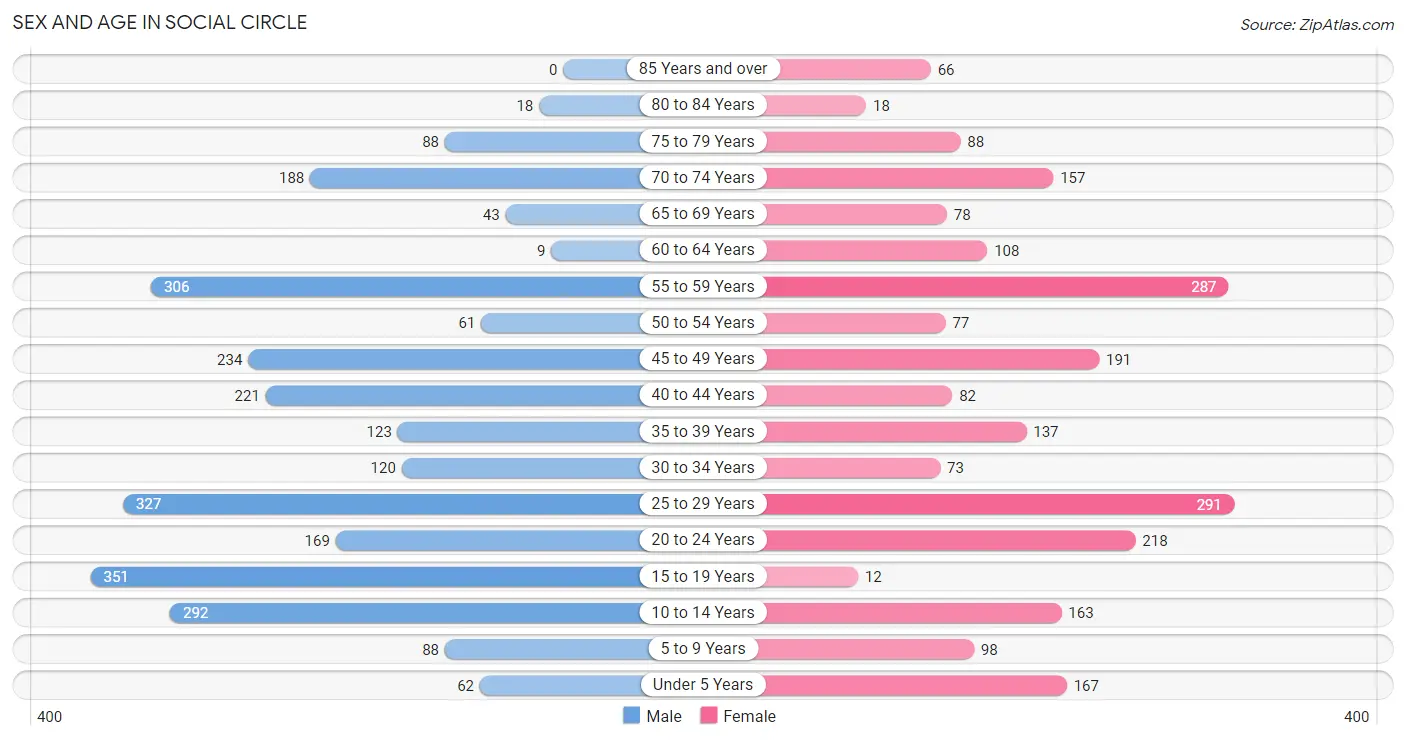
Sex and Age in Social Circle
Sex and Age in Social Circle
The most populous age groups in Social Circle are 15 to 19 Years (351 | 13.0%) for men and 25 to 29 Years (291 | 12.6%) for women.
| Age Bracket | Male | Female |
| Under 5 Years | 62 (2.3%) | 167 (7.2%) |
| 5 to 9 Years | 88 (3.3%) | 98 (4.2%) |
| 10 to 14 Years | 292 (10.8%) | 163 (7.0%) |
| 15 to 19 Years | 351 (13.0%) | 12 (0.5%) |
| 20 to 24 Years | 169 (6.3%) | 218 (9.4%) |
| 25 to 29 Years | 327 (12.1%) | 291 (12.6%) |
| 30 to 34 Years | 120 (4.4%) | 73 (3.2%) |
| 35 to 39 Years | 123 (4.6%) | 137 (5.9%) |
| 40 to 44 Years | 221 (8.2%) | 82 (3.5%) |
| 45 to 49 Years | 234 (8.7%) | 191 (8.3%) |
| 50 to 54 Years | 61 (2.3%) | 77 (3.3%) |
| 55 to 59 Years | 306 (11.3%) | 287 (12.4%) |
| 60 to 64 Years | 9 (0.3%) | 108 (4.7%) |
| 65 to 69 Years | 43 (1.6%) | 78 (3.4%) |
| 70 to 74 Years | 188 (7.0%) | 157 (6.8%) |
| 75 to 79 Years | 88 (3.3%) | 88 (3.8%) |
| 80 to 84 Years | 18 (0.7%) | 18 (0.8%) |
| 85 Years and over | 0 (0.0%) | 66 (2.9%) |
| Total | 2,700 (100.0%) | 2,311 (100.0%) |
Families and Households in Social Circle
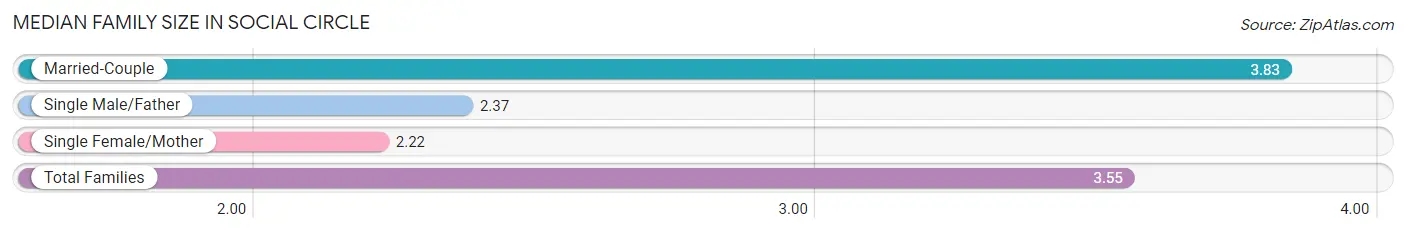
Median Family Size in Social Circle
The median family size in Social Circle is 3.55 persons per family, with married-couple families (960 | 81.1%) accounting for the largest median family size of 3.83 persons per family. On the other hand, single female/mother families (58 | 4.9%) represent the smallest median family size with 2.22 persons per family.
| Family Type | # Families | Family Size |
| Married-Couple | 960 (81.1%) | 3.83 |
| Single Male/Father | 166 (14.0%) | 2.37 |
| Single Female/Mother | 58 (4.9%) | 2.22 |
| Total Families | 1,184 (100.0%) | 3.55 |
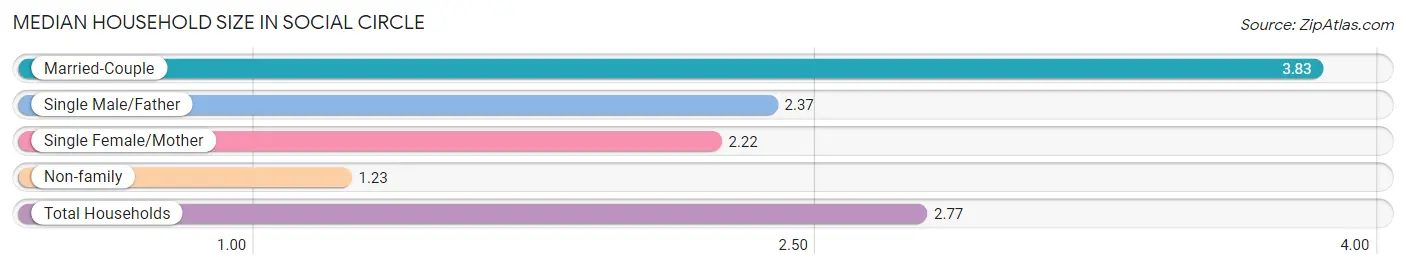
Median Household Size in Social Circle
The median household size in Social Circle is 2.77 persons per household, with married-couple households (960 | 53.8%) accounting for the largest median household size of 3.83 persons per household. non-family households (600 | 33.6%) represent the smallest median household size with 1.23 persons per household.
| Household Type | # Households | Household Size |
| Married-Couple | 960 (53.8%) | 3.83 |
| Single Male/Father | 166 (9.3%) | 2.37 |
| Single Female/Mother | 58 (3.3%) | 2.22 |
| Non-family | 600 (33.6%) | 1.23 |
| Total Households | 1,784 (100.0%) | 2.77 |
Household Size by Marriage Status in Social Circle
Out of a total of 1,784 households in Social Circle, 1,184 (66.4%) are family households, while 600 (33.6%) are nonfamily households. The most numerous type of family households are 2-person households, comprising 517, and the most common type of nonfamily households are 1-person households, comprising 489.
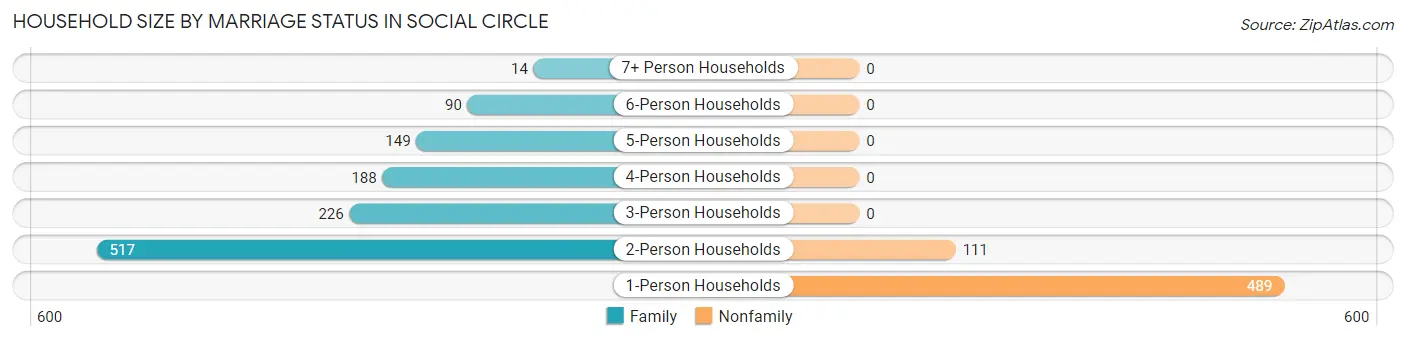
| Household Size | Family Households | Nonfamily Households |
| 1-Person Households | - | 489 (27.4%) |
| 2-Person Households | 517 (29.0%) | 111 (6.2%) |
| 3-Person Households | 226 (12.7%) | 0 (0.0%) |
| 4-Person Households | 188 (10.5%) | 0 (0.0%) |
| 5-Person Households | 149 (8.4%) | 0 (0.0%) |
| 6-Person Households | 90 (5.0%) | 0 (0.0%) |
| 7+ Person Households | 14 (0.8%) | 0 (0.0%) |
| Total | 1,184 (66.4%) | 600 (33.6%) |
Female Fertility in Social Circle
Fertility by Age in Social Circle
Average fertility rate in Social Circle is 100.0 births per 1,000 women. Women in the age bracket of 20 to 34 years have the highest fertility rate with 174.0 births per 1,000 women. Women in the age bracket of 20 to 34 years acount for 100.0% of all women with births.
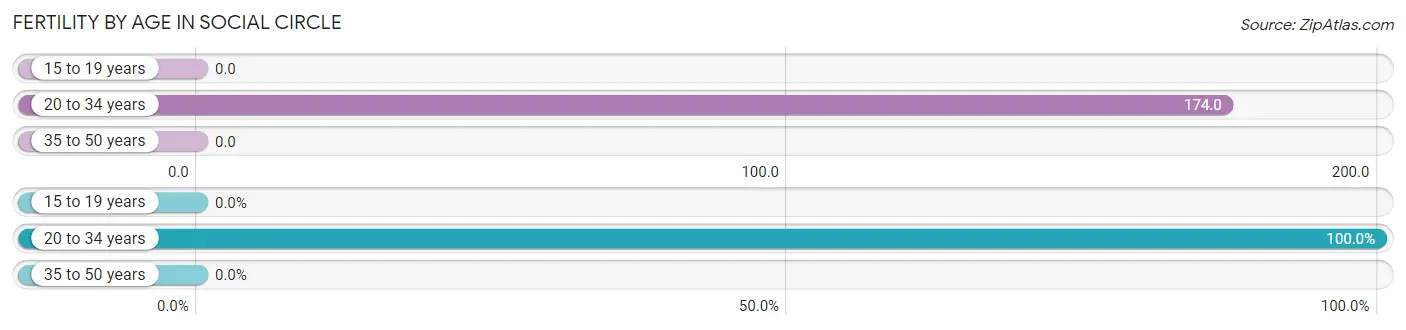
| Age Bracket | Women with Births | Births / 1,000 Women |
| 15 to 19 years | 0 (0.0%) | 0.0 |
| 20 to 34 years | 101 (100.0%) | 174.0 |
| 35 to 50 years | 0 (0.0%) | 0.0 |
| Total | 101 (100.0%) | 100.0 |
Fertility by Age by Marriage Status in Social Circle
27.7% of women with births (101) in Social Circle are married. The highest percentage of unmarried women with births falls into 20 to 34 years age bracket with 72.3% of them unmarried at the time of birth, while the lowest percentage of unmarried women with births belong to 20 to 34 years age bracket with 72.3% of them unmarried.
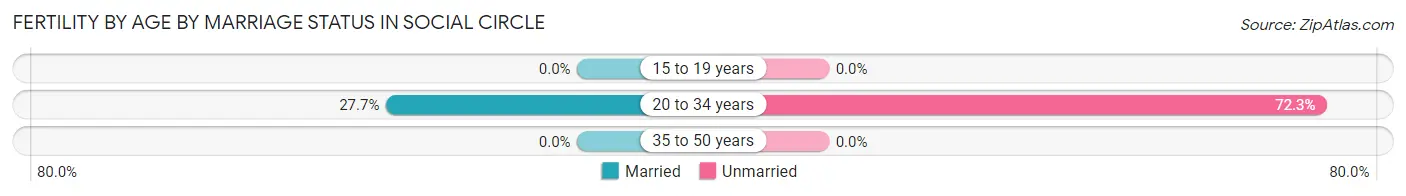
| Age Bracket | Married | Unmarried |
| 15 to 19 years | 0 (0.0%) | 0 (0.0%) |
| 20 to 34 years | 28 (27.7%) | 73 (72.3%) |
| 35 to 50 years | 0 (0.0%) | 0 (0.0%) |
| Total | 28 (27.7%) | 73 (72.3%) |
Fertility by Education in Social Circle
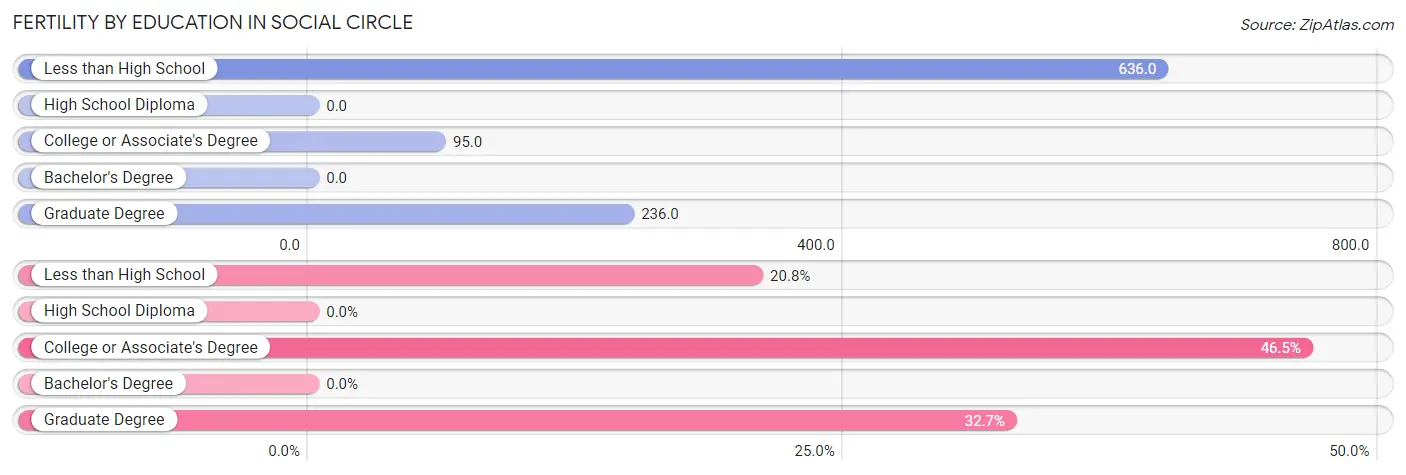
| Educational Attainment | Women with Births | Births / 1,000 Women |
| Less than High School | 21 (20.8%) | 636.0 |
| High School Diploma | 0 (0.0%) | 0.0 |
| College or Associate's Degree | 47 (46.5%) | 95.0 |
| Bachelor's Degree | 0 (0.0%) | 0.0 |
| Graduate Degree | 33 (32.7%) | 236.0 |
| Total | 101 (100.0%) | 100.0 |
Fertility by Education by Marriage Status in Social Circle
72.3% of women with births in Social Circle are unmarried. Women with the educational attainment of less than high school are most likely to be married with 100.0% of them married at childbirth, while women with the educational attainment of graduate degree are least likely to be married with 100.0% of them unmarried at childbirth.
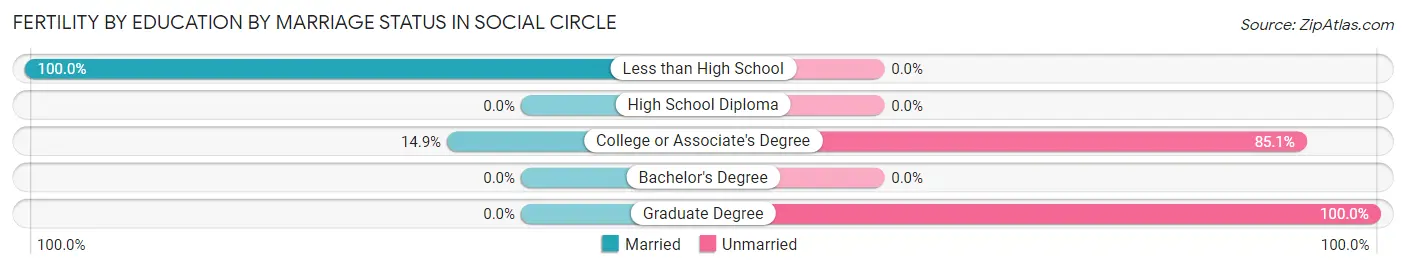
| Educational Attainment | Married | Unmarried |
| Less than High School | 21 (100.0%) | 0 (0.0%) |
| High School Diploma | 0 (0.0%) | 0 (0.0%) |
| College or Associate's Degree | 7 (14.9%) | 40 (85.1%) |
| Bachelor's Degree | 0 (0.0%) | 0 (0.0%) |
| Graduate Degree | 0 (0.0%) | 33 (100.0%) |
| Total | 28 (27.7%) | 73 (72.3%) |
Employment Characteristics in Social Circle
Employment by Class of Employer in Social Circle
Among the 2,444 employed individuals in Social Circle, private company employees (1,548 | 63.3%), local government employees (363 | 14.8%), and self-employed (incorporated) (165 | 6.8%) make up the most common classes of employment.
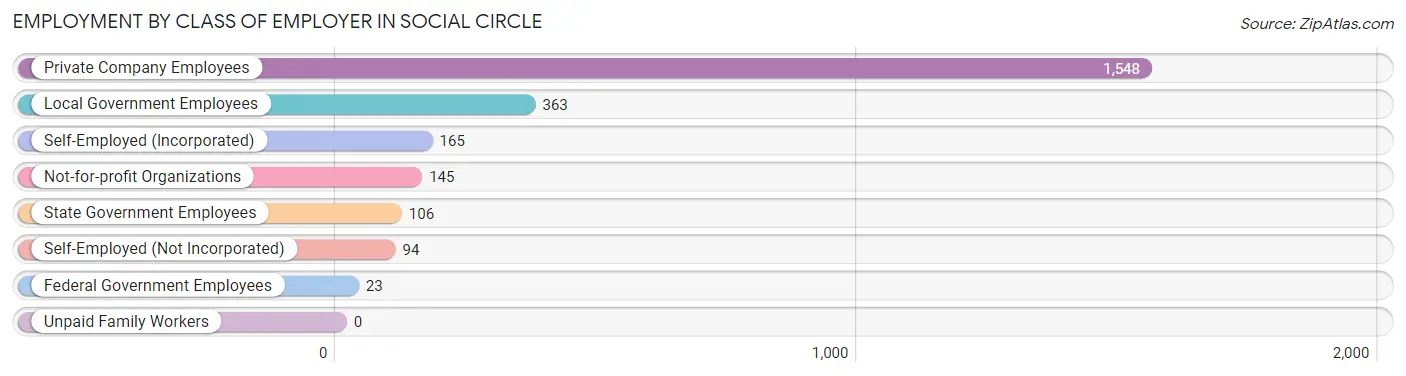
| Employer Class | # Employees | % Employees |
| Private Company Employees | 1,548 | 63.3% |
| Self-Employed (Incorporated) | 165 | 6.8% |
| Self-Employed (Not Incorporated) | 94 | 3.8% |
| Not-for-profit Organizations | 145 | 5.9% |
| Local Government Employees | 363 | 14.8% |
| State Government Employees | 106 | 4.3% |
| Federal Government Employees | 23 | 0.9% |
| Unpaid Family Workers | 0 | 0.0% |
| Total | 2,444 | 100.0% |
Employment Status by Age in Social Circle
According to the labor force statistics for Social Circle, out of the total population over 16 years of age (4,034), 64.8% or 2,614 individuals are in the labor force, with 6.6% or 173 of them unemployed. The age group with the highest labor force participation rate is 45 to 54 years, with 100.0% or 563 individuals in the labor force. Within the labor force, the 30 to 34 years age range has the highest percentage of unemployed individuals, with 45.2% or 84 of them being unemployed.
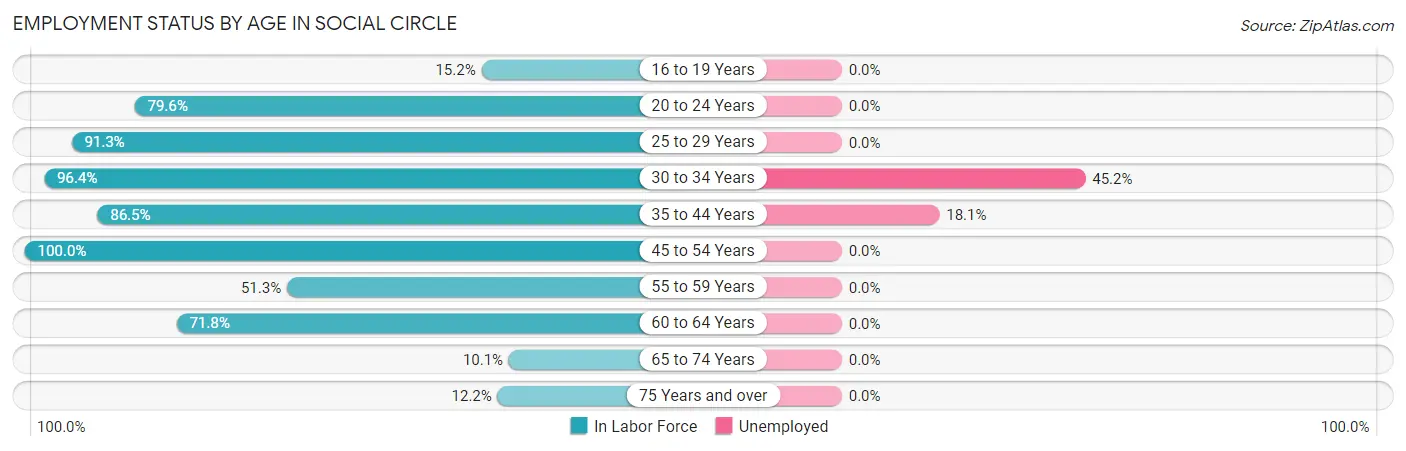
| Age Bracket | In Labor Force | Unemployed |
| 16 to 19 Years | 39 (15.2%) | 0 (0.0%) |
| 20 to 24 Years | 308 (79.6%) | 0 (0.0%) |
| 25 to 29 Years | 564 (91.3%) | 0 (0.0%) |
| 30 to 34 Years | 186 (96.4%) | 84 (45.2%) |
| 35 to 44 Years | 487 (86.5%) | 88 (18.1%) |
| 45 to 54 Years | 563 (100.0%) | 0 (0.0%) |
| 55 to 59 Years | 304 (51.3%) | 0 (0.0%) |
| 60 to 64 Years | 84 (71.8%) | 0 (0.0%) |
| 65 to 74 Years | 47 (10.1%) | 0 (0.0%) |
| 75 Years and over | 34 (12.2%) | 0 (0.0%) |
| Total | 2,614 (64.8%) | 173 (6.6%) |
Employment Status by Educational Attainment in Social Circle
According to labor force statistics for Social Circle, 82.7% of individuals (2,189) out of the total population between 25 and 64 years of age (2,647) are in the labor force, with 7.9% or 173 of them being unemployed. The group with the highest labor force participation rate are those with the educational attainment of less than high school, with 100.0% or 139 individuals in the labor force. Within the labor force, individuals with high school diploma education have the highest percentage of unemployment, with 25.5% or 172 of them being unemployed.
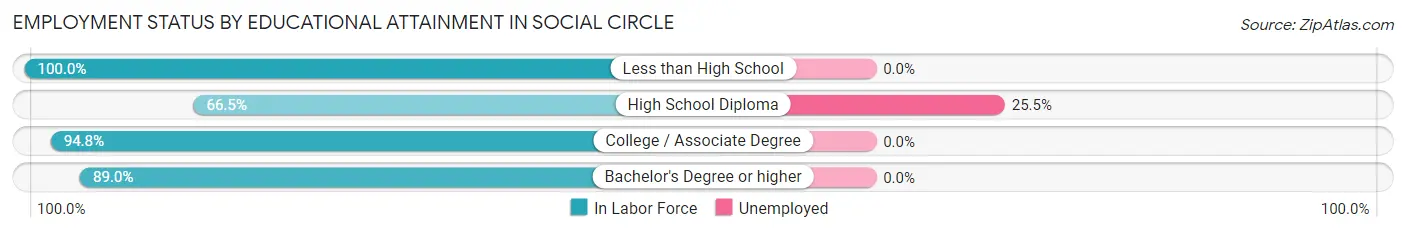
| Educational Attainment | In Labor Force | Unemployed |
| Less than High School | 139 (100.0%) | 0 (0.0%) |
| High School Diploma | 674 (66.5%) | 259 (25.5%) |
| College / Associate Degree | 736 (94.8%) | 0 (0.0%) |
| Bachelor's Degree or higher | 639 (89.0%) | 0 (0.0%) |
| Total | 2,189 (82.7%) | 209 (7.9%) |
Employment Occupations by Sex in Social Circle
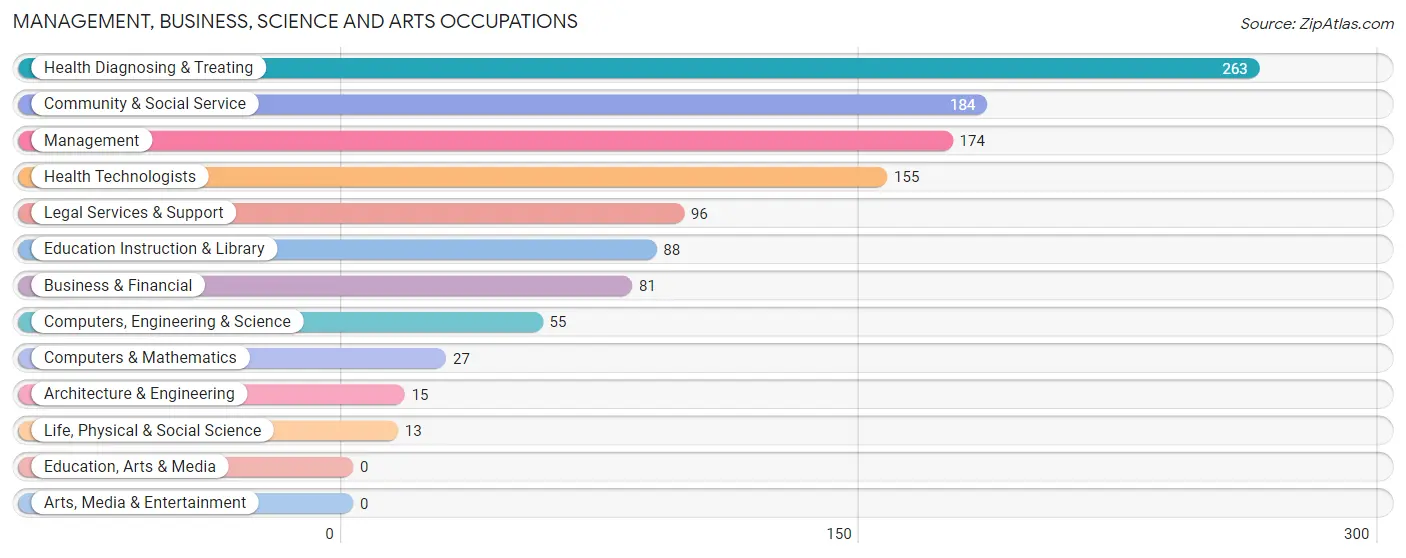
Management, Business, Science and Arts Occupations
The most common Management, Business, Science and Arts occupations in Social Circle are Health Diagnosing & Treating (263 | 10.8%), Community & Social Service (184 | 7.5%), Management (174 | 7.1%), Health Technologists (155 | 6.3%), and Legal Services & Support (96 | 3.9%).
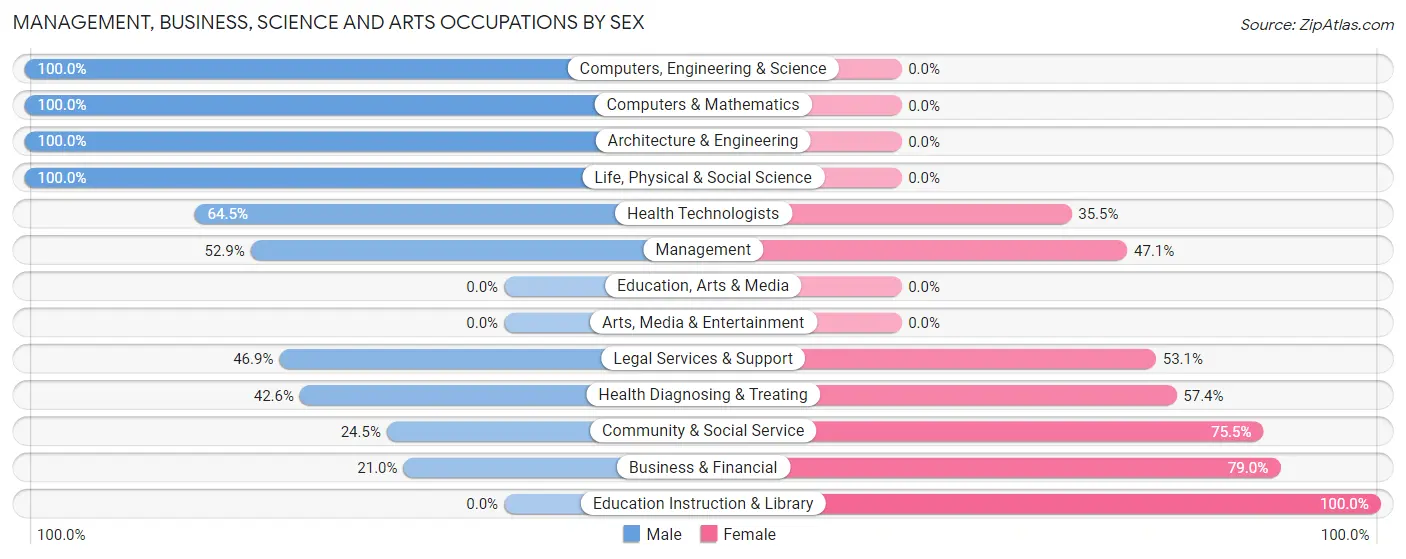
Management, Business, Science and Arts Occupations by Sex
Within the Management, Business, Science and Arts occupations in Social Circle, the most male-oriented occupations are Computers, Engineering & Science (100.0%), Computers & Mathematics (100.0%), and Architecture & Engineering (100.0%), while the most female-oriented occupations are Education Instruction & Library (100.0%), Business & Financial (79.0%), and Community & Social Service (75.5%).
| Occupation | Male | Female |
| Management | 92 (52.9%) | 82 (47.1%) |
| Business & Financial | 17 (21.0%) | 64 (79.0%) |
| Computers, Engineering & Science | 55 (100.0%) | 0 (0.0%) |
| Computers & Mathematics | 27 (100.0%) | 0 (0.0%) |
| Architecture & Engineering | 15 (100.0%) | 0 (0.0%) |
| Life, Physical & Social Science | 13 (100.0%) | 0 (0.0%) |
| Community & Social Service | 45 (24.5%) | 139 (75.5%) |
| Education, Arts & Media | 0 (0.0%) | 0 (0.0%) |
| Legal Services & Support | 45 (46.9%) | 51 (53.1%) |
| Education Instruction & Library | 0 (0.0%) | 88 (100.0%) |
| Arts, Media & Entertainment | 0 (0.0%) | 0 (0.0%) |
| Health Diagnosing & Treating | 112 (42.6%) | 151 (57.4%) |
| Health Technologists | 100 (64.5%) | 55 (35.5%) |
| Total (Category) | 321 (42.4%) | 436 (57.6%) |
| Total (Overall) | 1,151 (47.1%) | 1,293 (52.9%) |
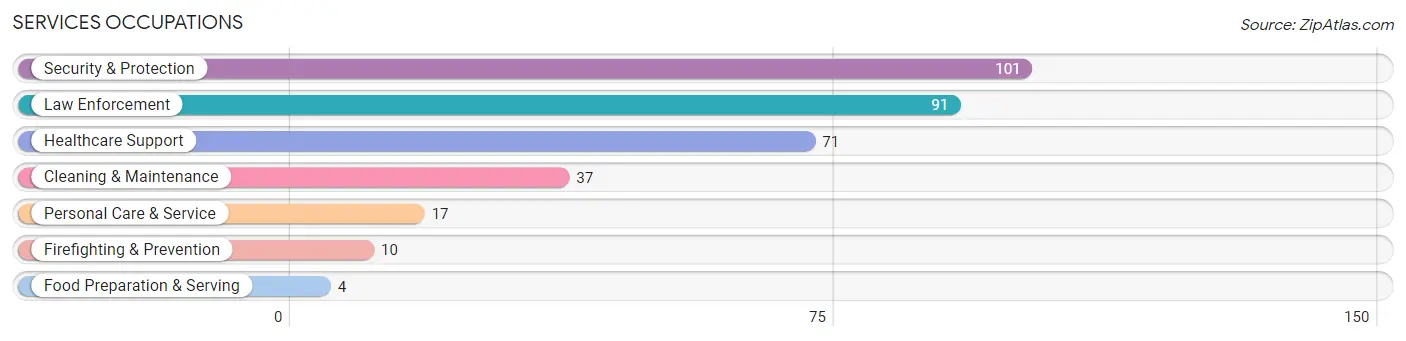
Services Occupations
The most common Services occupations in Social Circle are Security & Protection (101 | 4.1%), Law Enforcement (91 | 3.7%), Healthcare Support (71 | 2.9%), Cleaning & Maintenance (37 | 1.5%), and Personal Care & Service (17 | 0.7%).
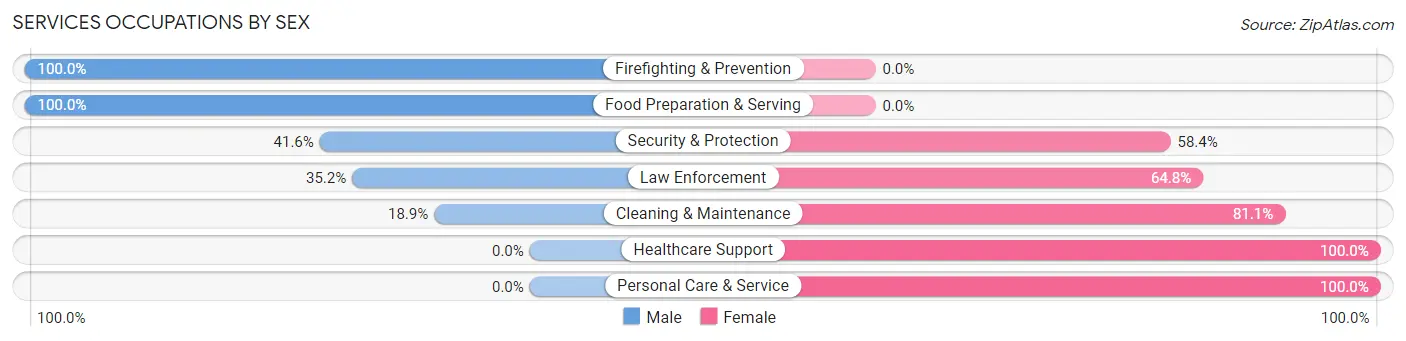
Services Occupations by Sex
Within the Services occupations in Social Circle, the most male-oriented occupations are Firefighting & Prevention (100.0%), Food Preparation & Serving (100.0%), and Security & Protection (41.6%), while the most female-oriented occupations are Healthcare Support (100.0%), Personal Care & Service (100.0%), and Cleaning & Maintenance (81.1%).
| Occupation | Male | Female |
| Healthcare Support | 0 (0.0%) | 71 (100.0%) |
| Security & Protection | 42 (41.6%) | 59 (58.4%) |
| Firefighting & Prevention | 10 (100.0%) | 0 (0.0%) |
| Law Enforcement | 32 (35.2%) | 59 (64.8%) |
| Food Preparation & Serving | 4 (100.0%) | 0 (0.0%) |
| Cleaning & Maintenance | 7 (18.9%) | 30 (81.1%) |
| Personal Care & Service | 0 (0.0%) | 17 (100.0%) |
| Total (Category) | 53 (23.0%) | 177 (77.0%) |
| Total (Overall) | 1,151 (47.1%) | 1,293 (52.9%) |
Sales and Office Occupations
The most common Sales and Office occupations in Social Circle are Office & Administration (625 | 25.6%), and Sales & Related (326 | 13.3%).
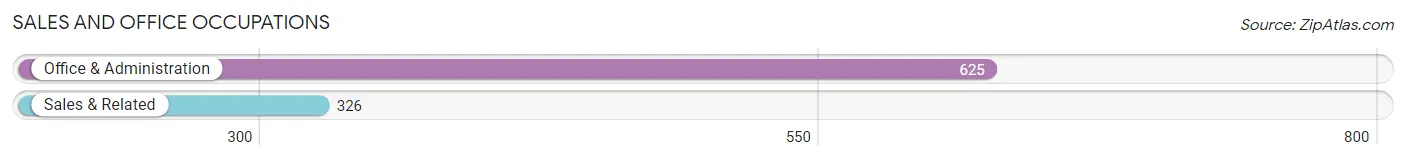
Sales and Office Occupations by Sex
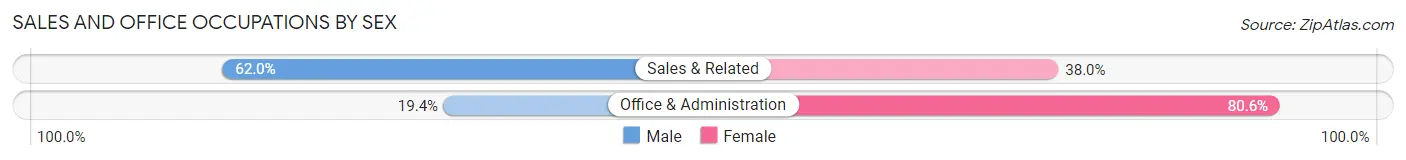
| Occupation | Male | Female |
| Sales & Related | 202 (62.0%) | 124 (38.0%) |
| Office & Administration | 121 (19.4%) | 504 (80.6%) |
| Total (Category) | 323 (34.0%) | 628 (66.0%) |
| Total (Overall) | 1,151 (47.1%) | 1,293 (52.9%) |
Natural Resources, Construction and Maintenance Occupations
The most common Natural Resources, Construction and Maintenance occupations in Social Circle are Construction & Extraction (182 | 7.4%), Installation, Maintenance & Repair (24 | 1.0%), and Farming, Fishing & Forestry (11 | 0.4%).
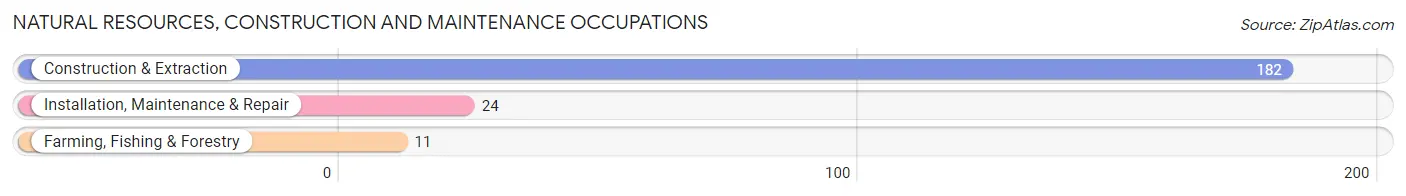
Natural Resources, Construction and Maintenance Occupations by Sex
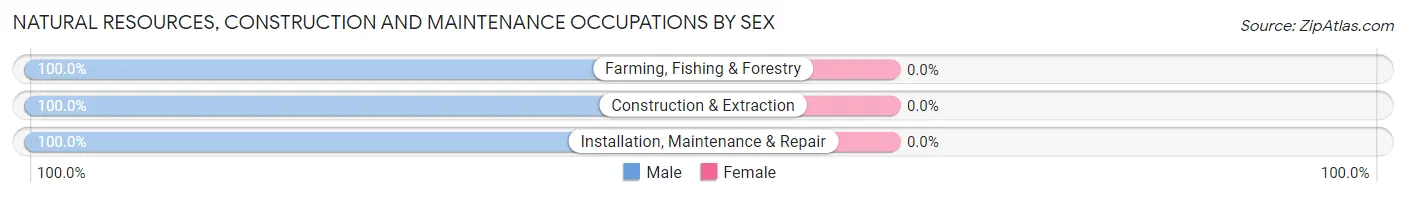
| Occupation | Male | Female |
| Farming, Fishing & Forestry | 11 (100.0%) | 0 (0.0%) |
| Construction & Extraction | 182 (100.0%) | 0 (0.0%) |
| Installation, Maintenance & Repair | 24 (100.0%) | 0 (0.0%) |
| Total (Category) | 217 (100.0%) | 0 (0.0%) |
| Total (Overall) | 1,151 (47.1%) | 1,293 (52.9%) |
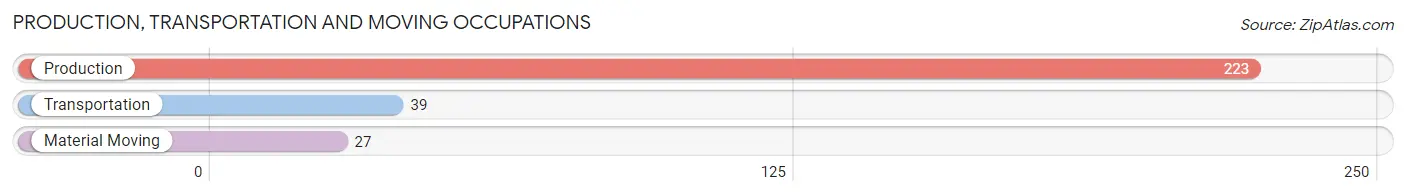
Production, Transportation and Moving Occupations
The most common Production, Transportation and Moving occupations in Social Circle are Production (223 | 9.1%), Transportation (39 | 1.6%), and Material Moving (27 | 1.1%).
Production, Transportation and Moving Occupations by Sex
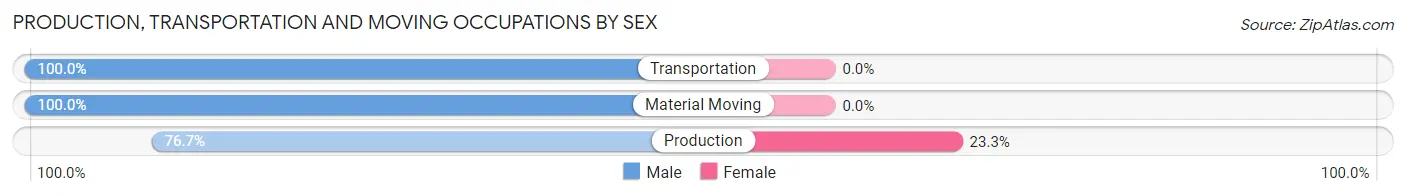
| Occupation | Male | Female |
| Production | 171 (76.7%) | 52 (23.3%) |
| Transportation | 39 (100.0%) | 0 (0.0%) |
| Material Moving | 27 (100.0%) | 0 (0.0%) |
| Total (Category) | 237 (82.0%) | 52 (18.0%) |
| Total (Overall) | 1,151 (47.1%) | 1,293 (52.9%) |
Employment Industries by Sex in Social Circle
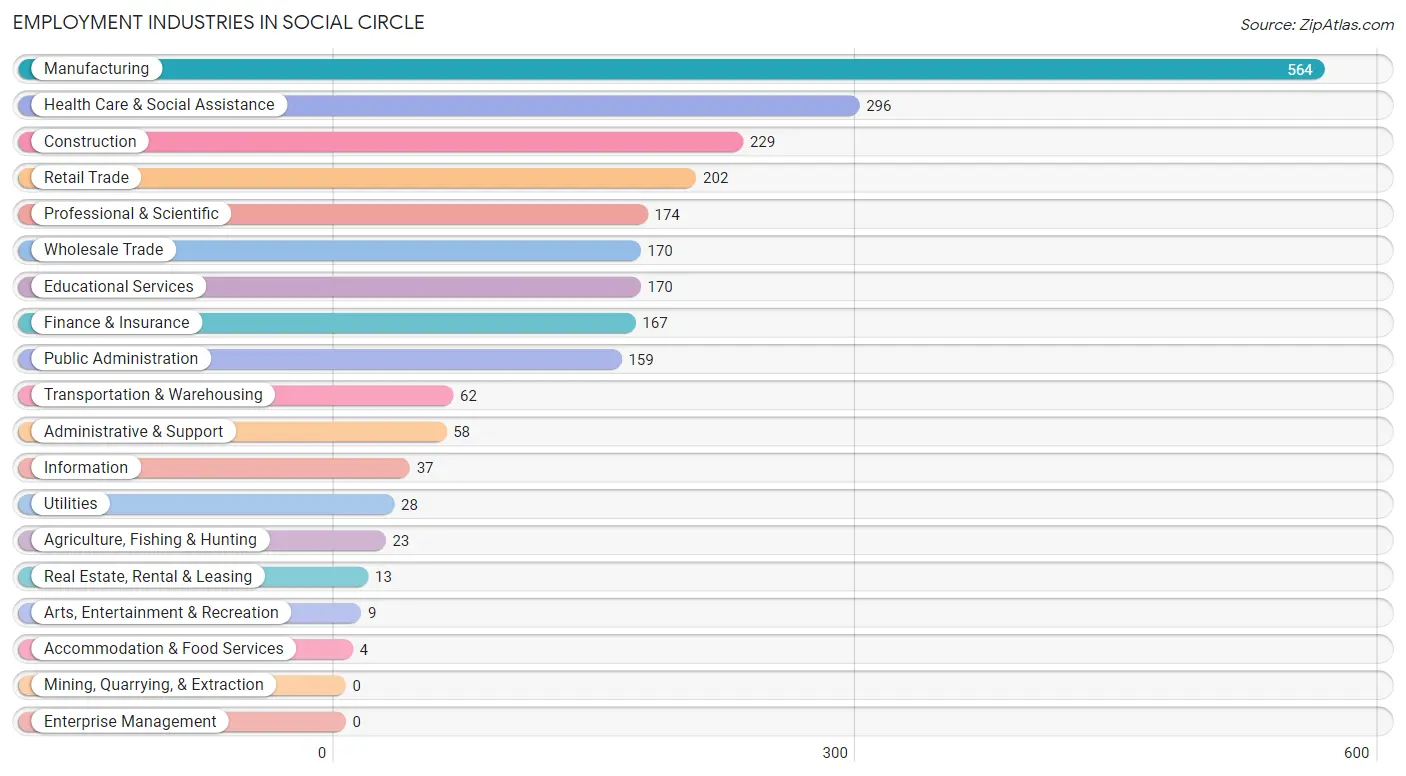
Employment Industries in Social Circle
The major employment industries in Social Circle include Manufacturing (564 | 23.1%), Health Care & Social Assistance (296 | 12.1%), Construction (229 | 9.4%), Retail Trade (202 | 8.3%), and Professional & Scientific (174 | 7.1%).
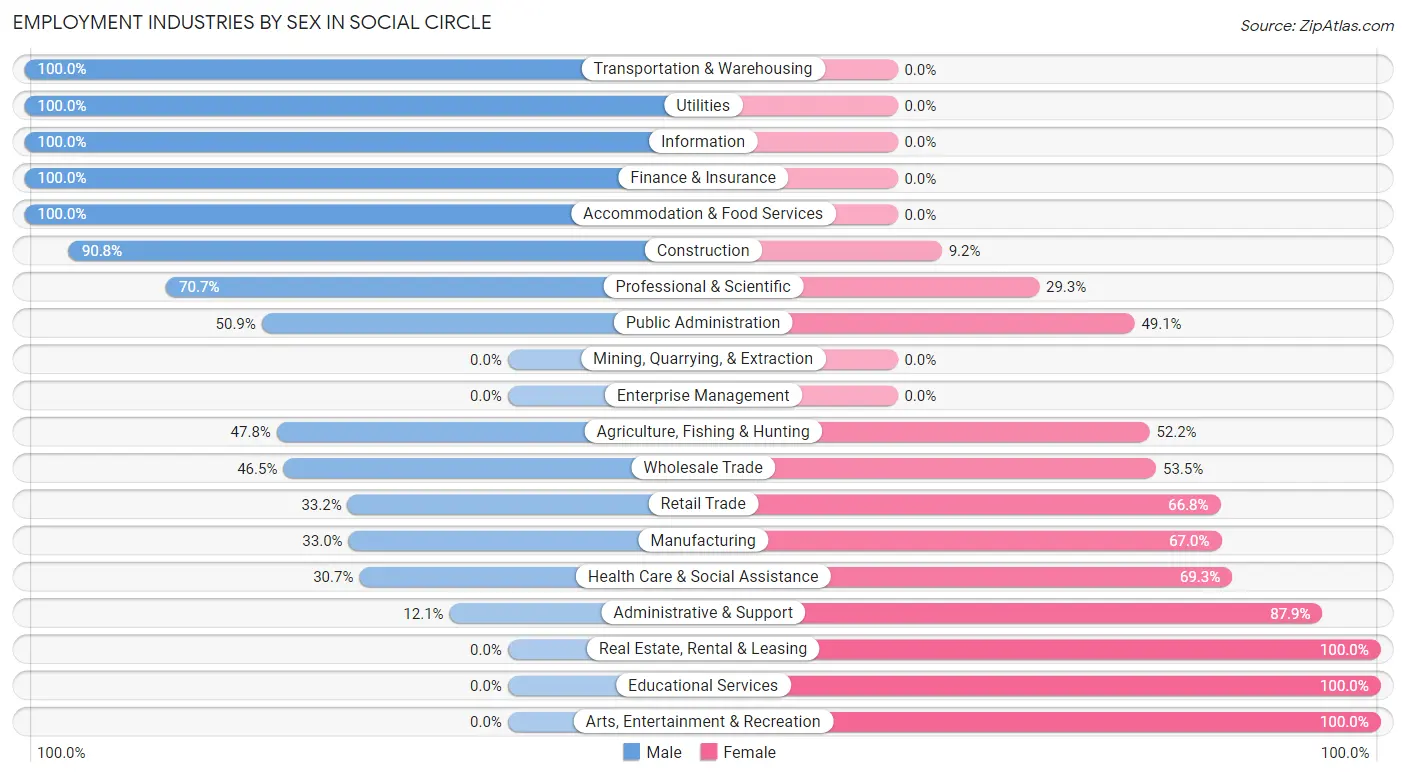
Employment Industries by Sex in Social Circle
The Social Circle industries that see more men than women are Transportation & Warehousing (100.0%), Utilities (100.0%), and Information (100.0%), whereas the industries that tend to have a higher number of women are Real Estate, Rental & Leasing (100.0%), Educational Services (100.0%), and Arts, Entertainment & Recreation (100.0%).
| Industry | Male | Female |
| Agriculture, Fishing & Hunting | 11 (47.8%) | 12 (52.2%) |
| Mining, Quarrying, & Extraction | 0 (0.0%) | 0 (0.0%) |
| Construction | 208 (90.8%) | 21 (9.2%) |
| Manufacturing | 186 (33.0%) | 378 (67.0%) |
| Wholesale Trade | 79 (46.5%) | 91 (53.5%) |
| Retail Trade | 67 (33.2%) | 135 (66.8%) |
| Transportation & Warehousing | 62 (100.0%) | 0 (0.0%) |
| Utilities | 28 (100.0%) | 0 (0.0%) |
| Information | 37 (100.0%) | 0 (0.0%) |
| Finance & Insurance | 167 (100.0%) | 0 (0.0%) |
| Real Estate, Rental & Leasing | 0 (0.0%) | 13 (100.0%) |
| Professional & Scientific | 123 (70.7%) | 51 (29.3%) |
| Enterprise Management | 0 (0.0%) | 0 (0.0%) |
| Administrative & Support | 7 (12.1%) | 51 (87.9%) |
| Educational Services | 0 (0.0%) | 170 (100.0%) |
| Health Care & Social Assistance | 91 (30.7%) | 205 (69.3%) |
| Arts, Entertainment & Recreation | 0 (0.0%) | 9 (100.0%) |
| Accommodation & Food Services | 4 (100.0%) | 0 (0.0%) |
| Public Administration | 81 (50.9%) | 78 (49.1%) |
| Total | 1,151 (47.1%) | 1,293 (52.9%) |
Education in Social Circle
School Enrollment in Social Circle
The most common levels of schooling among the 1,321 students in Social Circle are middle school (389 | 29.4%), high school (347 | 26.3%), and college / undergraduate (290 | 22.0%).
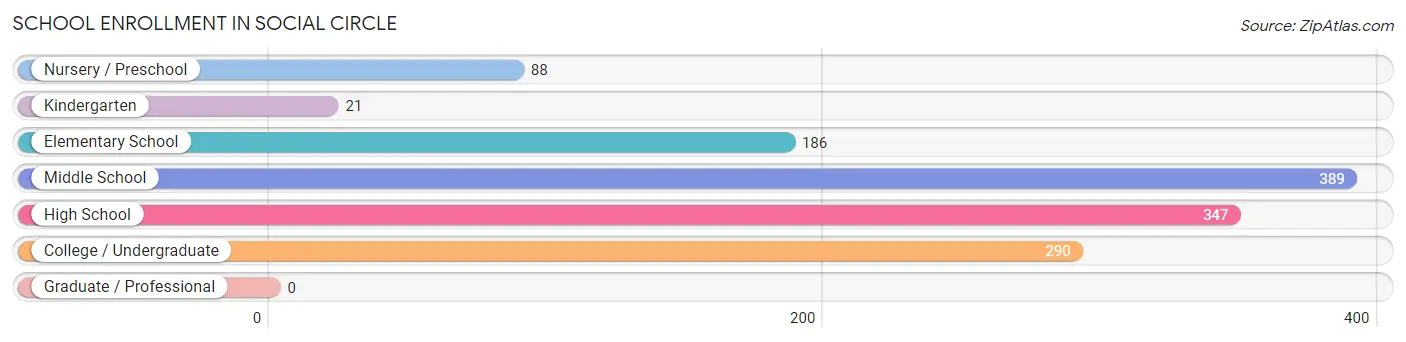
| School Level | # Students | % Students |
| Nursery / Preschool | 88 | 6.7% |
| Kindergarten | 21 | 1.6% |
| Elementary School | 186 | 14.1% |
| Middle School | 389 | 29.4% |
| High School | 347 | 26.3% |
| College / Undergraduate | 290 | 22.0% |
| Graduate / Professional | 0 | 0.0% |
| Total | 1,321 | 100.0% |
School Enrollment by Age by Funding Source in Social Circle
Out of a total of 1,321 students who are enrolled in schools in Social Circle, 361 (27.3%) attend a private institution, while the remaining 960 (72.7%) are enrolled in public schools. The age group of 3 to 4 year olds has the highest likelihood of being enrolled in private schools, with 44 (100.0% in the age bracket) enrolled. Conversely, the age group of 18 to 19 year olds has the lowest likelihood of being enrolled in a private school, with 12 (100.0% in the age bracket) attending a public institution.
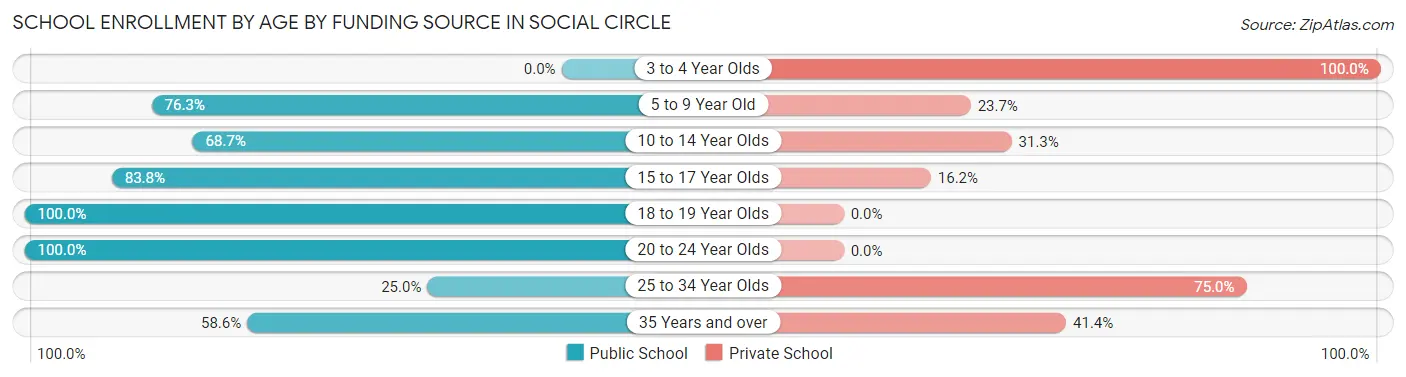
| Age Bracket | Public School | Private School |
| 3 to 4 Year Olds | 0 (0.0%) | 44 (100.0%) |
| 5 to 9 Year Old | 142 (76.3%) | 44 (23.7%) |
| 10 to 14 Year Olds | 301 (68.7%) | 137 (31.3%) |
| 15 to 17 Year Olds | 294 (83.8%) | 57 (16.2%) |
| 18 to 19 Year Olds | 12 (100.0%) | 0 (0.0%) |
| 20 to 24 Year Olds | 122 (100.0%) | 0 (0.0%) |
| 25 to 34 Year Olds | 7 (25.0%) | 21 (75.0%) |
| 35 Years and over | 82 (58.6%) | 58 (41.4%) |
| Total | 960 (72.7%) | 361 (27.3%) |
Educational Attainment by Field of Study in Social Circle
Business (403 | 38.7%), science & technology (112 | 10.7%), physical & health sciences (99 | 9.5%), visual & performing arts (89 | 8.5%), and liberal arts & history (68 | 6.5%) are the most common fields of study among 1,042 individuals in Social Circle who have obtained a bachelor's degree or higher.
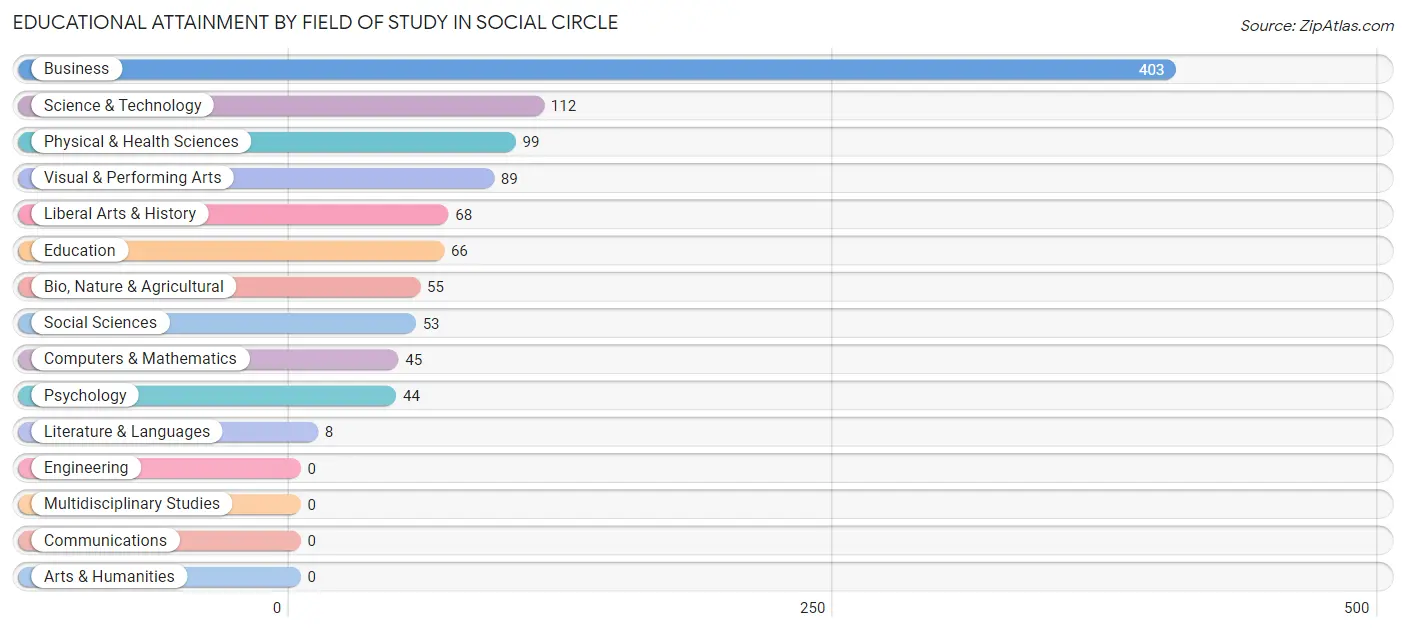
| Field of Study | # Graduates | % Graduates |
| Computers & Mathematics | 45 | 4.3% |
| Bio, Nature & Agricultural | 55 | 5.3% |
| Physical & Health Sciences | 99 | 9.5% |
| Psychology | 44 | 4.2% |
| Social Sciences | 53 | 5.1% |
| Engineering | 0 | 0.0% |
| Multidisciplinary Studies | 0 | 0.0% |
| Science & Technology | 112 | 10.7% |
| Business | 403 | 38.7% |
| Education | 66 | 6.3% |
| Literature & Languages | 8 | 0.8% |
| Liberal Arts & History | 68 | 6.5% |
| Visual & Performing Arts | 89 | 8.5% |
| Communications | 0 | 0.0% |
| Arts & Humanities | 0 | 0.0% |
| Total | 1,042 | 100.0% |
Transportation & Commute in Social Circle
Vehicle Availability by Sex in Social Circle
The most prevalent vehicle ownership categories in Social Circle are males with 2 vehicles (585, accounting for 50.8%) and females with 2 vehicles (434, making up 45.2%).
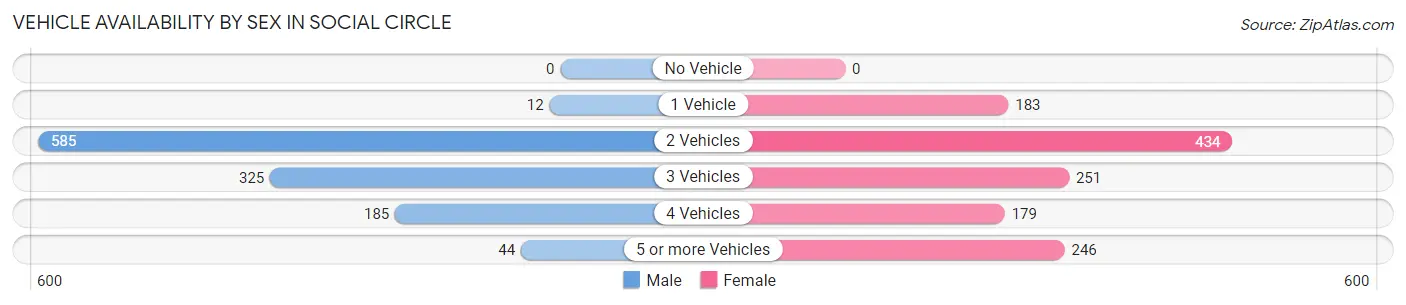
| Vehicles Available | Male | Female |
| No Vehicle | 0 (0.0%) | 0 (0.0%) |
| 1 Vehicle | 12 (1.0%) | 183 (14.1%) |
| 2 Vehicles | 585 (50.8%) | 434 (33.6%) |
| 3 Vehicles | 325 (28.2%) | 251 (19.4%) |
| 4 Vehicles | 185 (16.1%) | 179 (13.8%) |
| 5 or more Vehicles | 44 (3.8%) | 246 (19.0%) |
| Total | 1,151 (100.0%) | 1,293 (100.0%) |
Commute Time in Social Circle
The most frequently occuring commute durations in Social Circle are 20 to 24 minutes (491 commuters, 25.6%), 90 or more minutes (268 commuters, 14.0%), and less than 5 minutes (195 commuters, 10.2%).
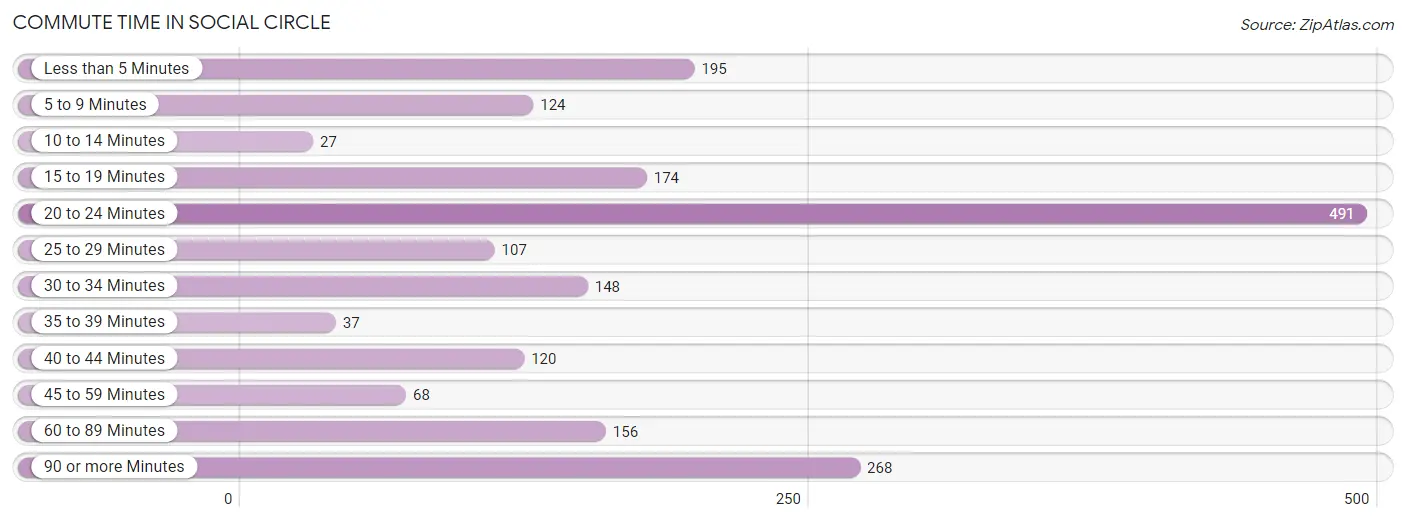
| Commute Time | # Commuters | % Commuters |
| Less than 5 Minutes | 195 | 10.2% |
| 5 to 9 Minutes | 124 | 6.5% |
| 10 to 14 Minutes | 27 | 1.4% |
| 15 to 19 Minutes | 174 | 9.1% |
| 20 to 24 Minutes | 491 | 25.6% |
| 25 to 29 Minutes | 107 | 5.6% |
| 30 to 34 Minutes | 148 | 7.7% |
| 35 to 39 Minutes | 37 | 1.9% |
| 40 to 44 Minutes | 120 | 6.3% |
| 45 to 59 Minutes | 68 | 3.5% |
| 60 to 89 Minutes | 156 | 8.2% |
| 90 or more Minutes | 268 | 14.0% |
Commute Time by Sex in Social Circle
The most common commute times in Social Circle are 20 to 24 minutes (230 commuters, 27.7%) for males and 20 to 24 minutes (261 commuters, 24.1%) for females.
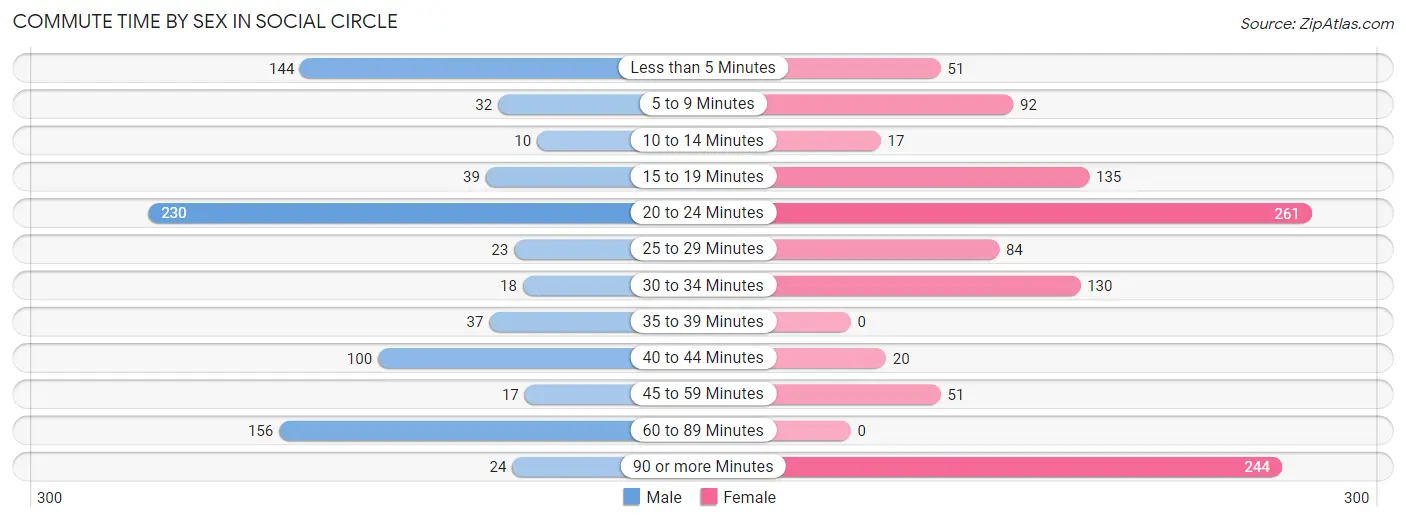
| Commute Time | Male | Female |
| Less than 5 Minutes | 144 (17.3%) | 51 (4.7%) |
| 5 to 9 Minutes | 32 (3.9%) | 92 (8.5%) |
| 10 to 14 Minutes | 10 (1.2%) | 17 (1.6%) |
| 15 to 19 Minutes | 39 (4.7%) | 135 (12.4%) |
| 20 to 24 Minutes | 230 (27.7%) | 261 (24.1%) |
| 25 to 29 Minutes | 23 (2.8%) | 84 (7.7%) |
| 30 to 34 Minutes | 18 (2.2%) | 130 (12.0%) |
| 35 to 39 Minutes | 37 (4.5%) | 0 (0.0%) |
| 40 to 44 Minutes | 100 (12.0%) | 20 (1.8%) |
| 45 to 59 Minutes | 17 (2.1%) | 51 (4.7%) |
| 60 to 89 Minutes | 156 (18.8%) | 0 (0.0%) |
| 90 or more Minutes | 24 (2.9%) | 244 (22.5%) |
Time of Departure to Work by Sex in Social Circle
The most frequent times of departure to work in Social Circle are 7:30 AM to 7:59 AM (255, 30.7%) for males and 4:00 PM to 11:59 PM (207, 19.1%) for females.
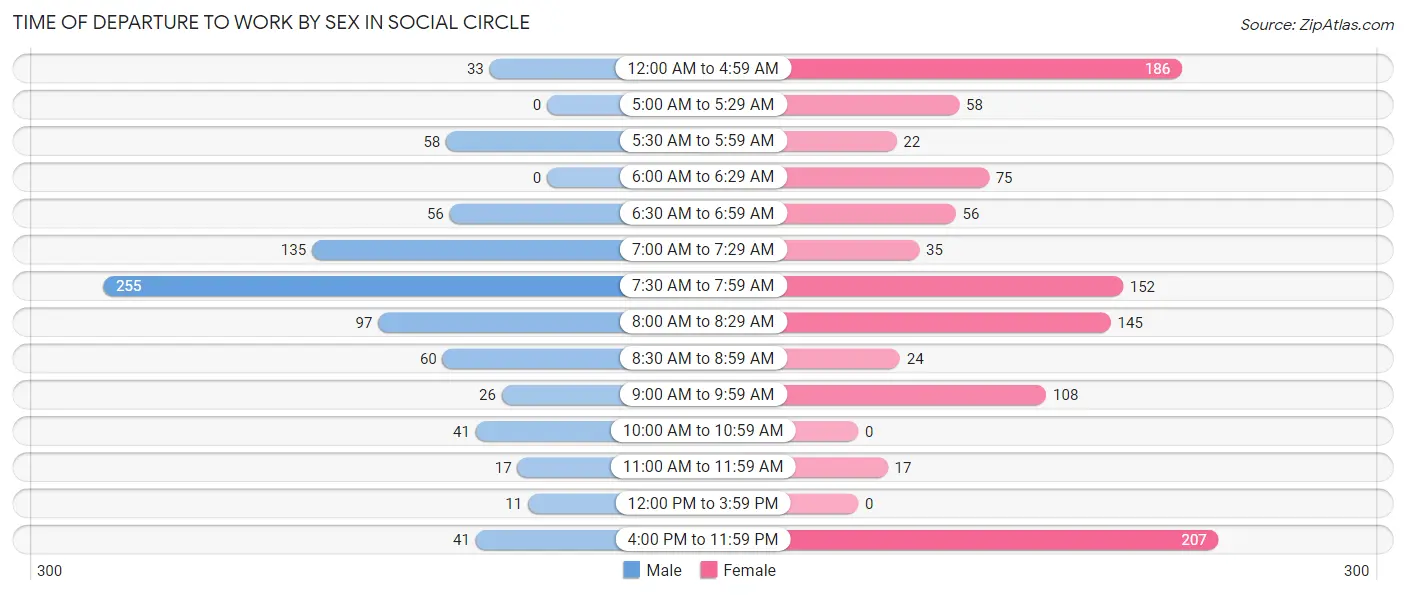
| Time of Departure | Male | Female |
| 12:00 AM to 4:59 AM | 33 (4.0%) | 186 (17.1%) |
| 5:00 AM to 5:29 AM | 0 (0.0%) | 58 (5.3%) |
| 5:30 AM to 5:59 AM | 58 (7.0%) | 22 (2.0%) |
| 6:00 AM to 6:29 AM | 0 (0.0%) | 75 (6.9%) |
| 6:30 AM to 6:59 AM | 56 (6.8%) | 56 (5.2%) |
| 7:00 AM to 7:29 AM | 135 (16.3%) | 35 (3.2%) |
| 7:30 AM to 7:59 AM | 255 (30.7%) | 152 (14.0%) |
| 8:00 AM to 8:29 AM | 97 (11.7%) | 145 (13.4%) |
| 8:30 AM to 8:59 AM | 60 (7.2%) | 24 (2.2%) |
| 9:00 AM to 9:59 AM | 26 (3.1%) | 108 (10.0%) |
| 10:00 AM to 10:59 AM | 41 (4.9%) | 0 (0.0%) |
| 11:00 AM to 11:59 AM | 17 (2.1%) | 17 (1.6%) |
| 12:00 PM to 3:59 PM | 11 (1.3%) | 0 (0.0%) |
| 4:00 PM to 11:59 PM | 41 (4.9%) | 207 (19.1%) |
| Total | 830 (100.0%) | 1,085 (100.0%) |
Housing Occupancy in Social Circle
Occupancy by Ownership in Social Circle
Of the total 1,784 dwellings in Social Circle, owner-occupied units account for 1,419 (79.5%), while renter-occupied units make up 365 (20.5%).
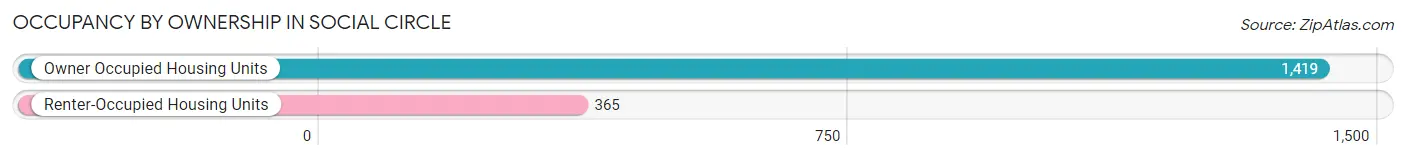
| Occupancy | # Housing Units | % Housing Units |
| Owner Occupied Housing Units | 1,419 | 79.5% |
| Renter-Occupied Housing Units | 365 | 20.5% |
| Total Occupied Housing Units | 1,784 | 100.0% |
Occupancy by Household Size in Social Circle
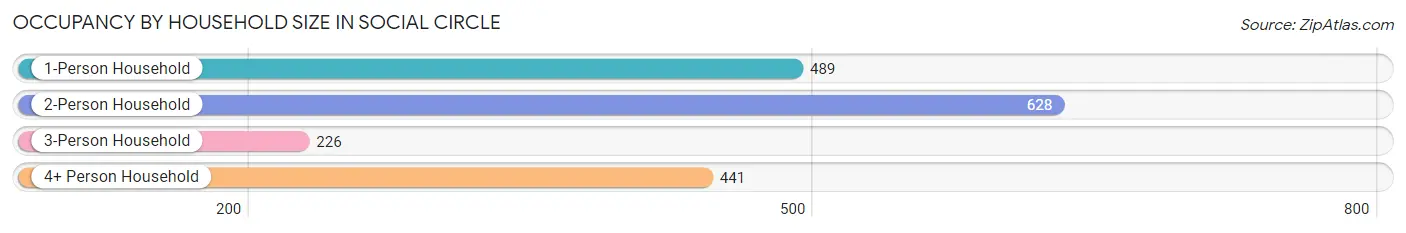
| Household Size | # Housing Units | % Housing Units |
| 1-Person Household | 489 | 27.4% |
| 2-Person Household | 628 | 35.2% |
| 3-Person Household | 226 | 12.7% |
| 4+ Person Household | 441 | 24.7% |
| Total Housing Units | 1,784 | 100.0% |
Occupancy by Ownership by Household Size in Social Circle
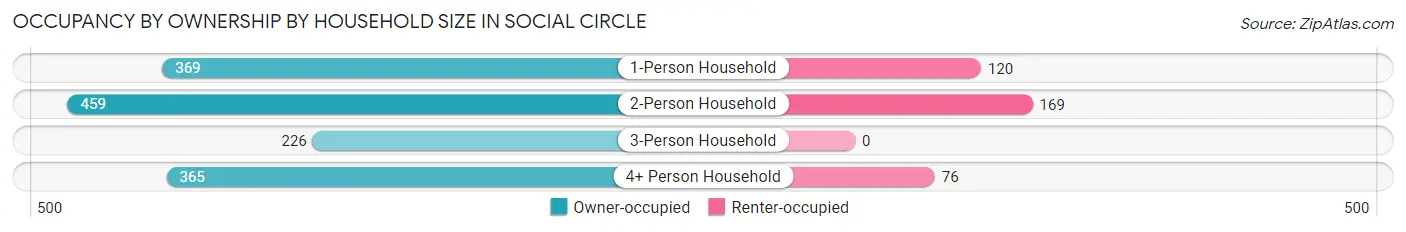
| Household Size | Owner-occupied | Renter-occupied |
| 1-Person Household | 369 (75.5%) | 120 (24.5%) |
| 2-Person Household | 459 (73.1%) | 169 (26.9%) |
| 3-Person Household | 226 (100.0%) | 0 (0.0%) |
| 4+ Person Household | 365 (82.8%) | 76 (17.2%) |
| Total Housing Units | 1,419 (79.5%) | 365 (20.5%) |
Occupancy by Educational Attainment in Social Circle
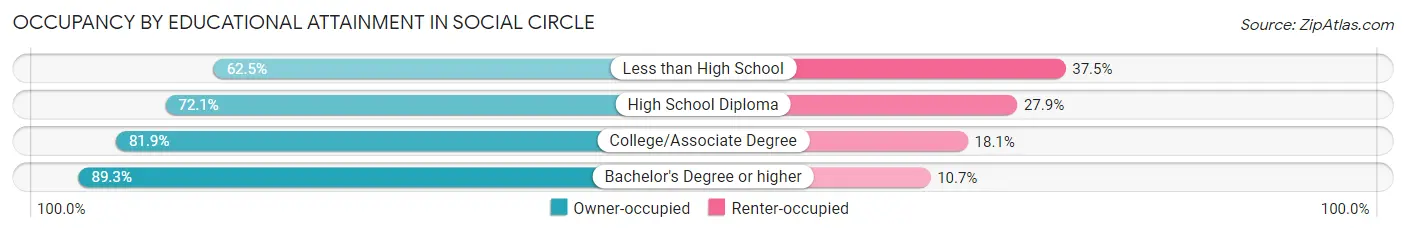
| Household Size | Owner-occupied | Renter-occupied |
| Less than High School | 95 (62.5%) | 57 (37.5%) |
| High School Diploma | 395 (72.1%) | 153 (27.9%) |
| College/Associate Degree | 429 (81.9%) | 95 (18.1%) |
| Bachelor's Degree or higher | 500 (89.3%) | 60 (10.7%) |
Occupancy by Age of Householder in Social Circle
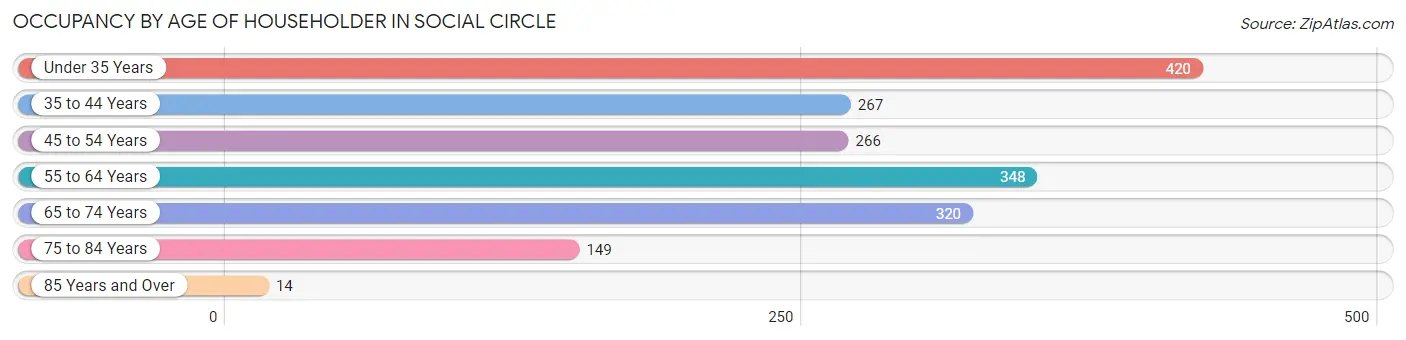
| Age Bracket | # Households | % Households |
| Under 35 Years | 420 | 23.5% |
| 35 to 44 Years | 267 | 15.0% |
| 45 to 54 Years | 266 | 14.9% |
| 55 to 64 Years | 348 | 19.5% |
| 65 to 74 Years | 320 | 17.9% |
| 75 to 84 Years | 149 | 8.4% |
| 85 Years and Over | 14 | 0.8% |
| Total | 1,784 | 100.0% |
Housing Finances in Social Circle
Median Income by Occupancy in Social Circle
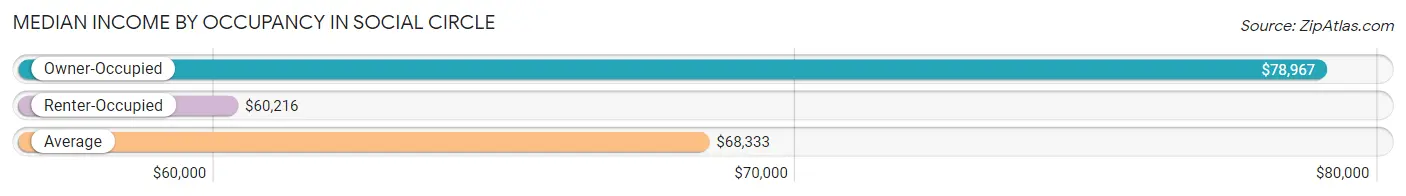
| Occupancy Type | # Households | Median Income |
| Owner-Occupied | 1,419 (79.5%) | $78,967 |
| Renter-Occupied | 365 (20.5%) | $60,216 |
| Average | 1,784 (100.0%) | $68,333 |
Occupancy by Householder Income Bracket in Social Circle
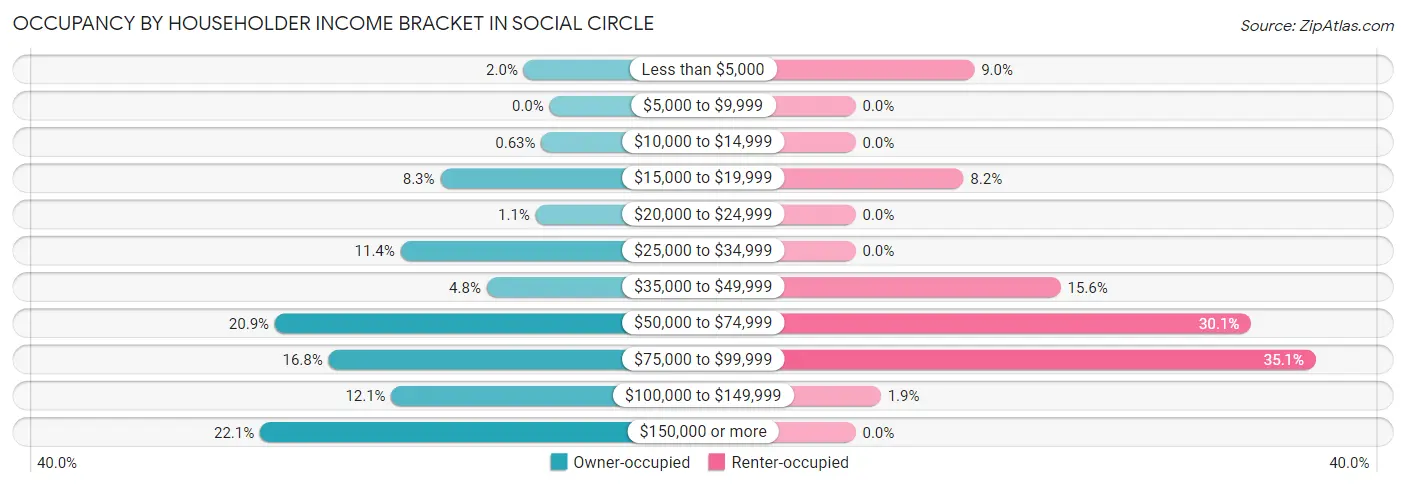
| Income Bracket | Owner-occupied | Renter-occupied |
| Less than $5,000 | 28 (2.0%) | 33 (9.0%) |
| $5,000 to $9,999 | 0 (0.0%) | 0 (0.0%) |
| $10,000 to $14,999 | 9 (0.6%) | 0 (0.0%) |
| $15,000 to $19,999 | 118 (8.3%) | 30 (8.2%) |
| $20,000 to $24,999 | 15 (1.1%) | 0 (0.0%) |
| $25,000 to $34,999 | 161 (11.4%) | 0 (0.0%) |
| $35,000 to $49,999 | 68 (4.8%) | 57 (15.6%) |
| $50,000 to $74,999 | 297 (20.9%) | 110 (30.1%) |
| $75,000 to $99,999 | 239 (16.8%) | 128 (35.1%) |
| $100,000 to $149,999 | 171 (12.0%) | 7 (1.9%) |
| $150,000 or more | 313 (22.1%) | 0 (0.0%) |
| Total | 1,419 (100.0%) | 365 (100.0%) |
Monthly Housing Cost Tiers in Social Circle
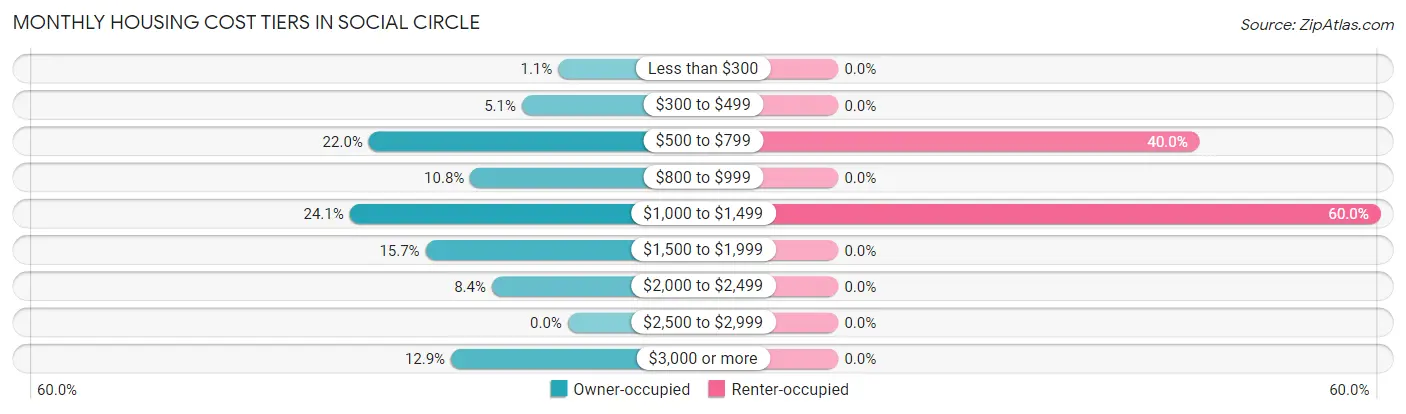
| Monthly Cost | Owner-occupied | Renter-occupied |
| Less than $300 | 15 (1.1%) | 0 (0.0%) |
| $300 to $499 | 72 (5.1%) | 0 (0.0%) |
| $500 to $799 | 312 (22.0%) | 146 (40.0%) |
| $800 to $999 | 153 (10.8%) | 0 (0.0%) |
| $1,000 to $1,499 | 342 (24.1%) | 219 (60.0%) |
| $1,500 to $1,999 | 223 (15.7%) | 0 (0.0%) |
| $2,000 to $2,499 | 119 (8.4%) | 0 (0.0%) |
| $2,500 to $2,999 | 0 (0.0%) | 0 (0.0%) |
| $3,000 or more | 183 (12.9%) | 0 (0.0%) |
| Total | 1,419 (100.0%) | 365 (100.0%) |
Physical Housing Characteristics in Social Circle
Housing Structures in Social Circle
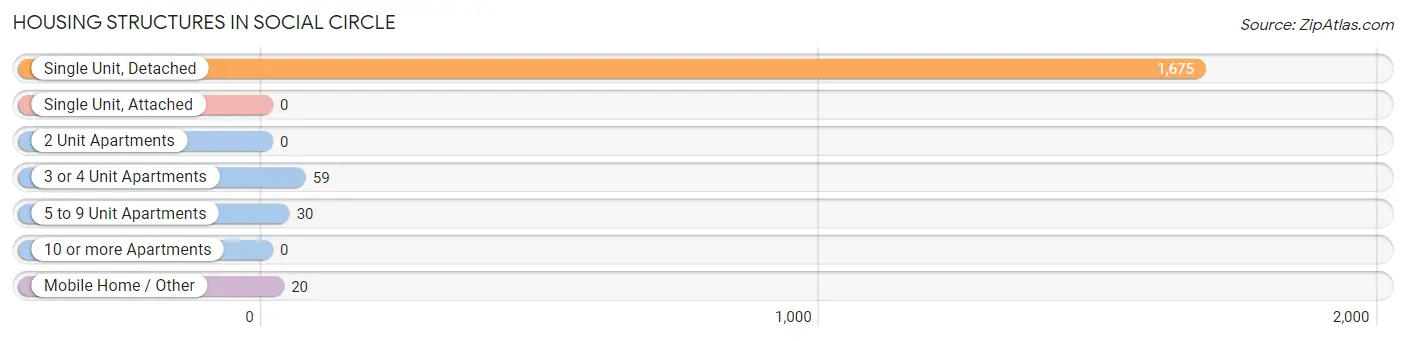
| Structure Type | # Housing Units | % Housing Units |
| Single Unit, Detached | 1,675 | 93.9% |
| Single Unit, Attached | 0 | 0.0% |
| 2 Unit Apartments | 0 | 0.0% |
| 3 or 4 Unit Apartments | 59 | 3.3% |
| 5 to 9 Unit Apartments | 30 | 1.7% |
| 10 or more Apartments | 0 | 0.0% |
| Mobile Home / Other | 20 | 1.1% |
| Total | 1,784 | 100.0% |
Housing Structures by Occupancy in Social Circle
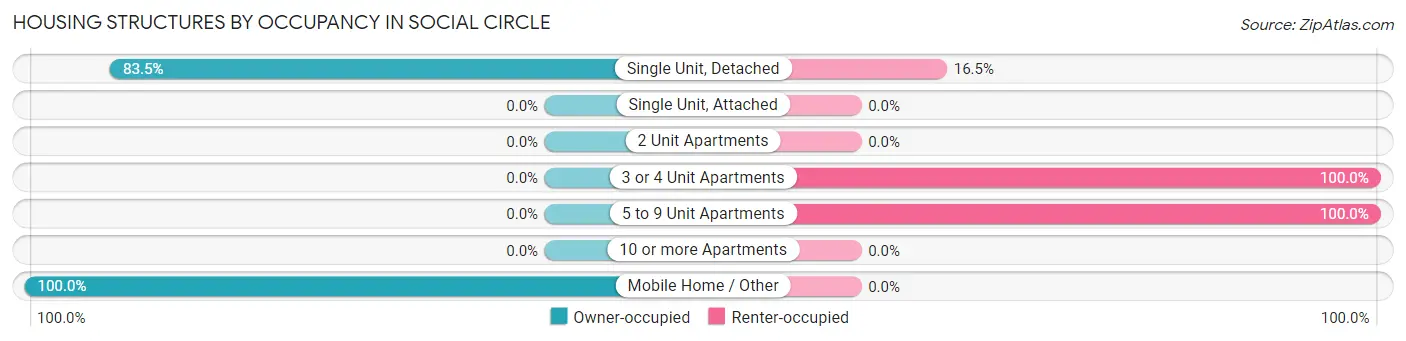
| Structure Type | Owner-occupied | Renter-occupied |
| Single Unit, Detached | 1,399 (83.5%) | 276 (16.5%) |
| Single Unit, Attached | 0 (0.0%) | 0 (0.0%) |
| 2 Unit Apartments | 0 (0.0%) | 0 (0.0%) |
| 3 or 4 Unit Apartments | 0 (0.0%) | 59 (100.0%) |
| 5 to 9 Unit Apartments | 0 (0.0%) | 30 (100.0%) |
| 10 or more Apartments | 0 (0.0%) | 0 (0.0%) |
| Mobile Home / Other | 20 (100.0%) | 0 (0.0%) |
| Total | 1,419 (79.5%) | 365 (20.5%) |
Housing Structures by Number of Rooms in Social Circle
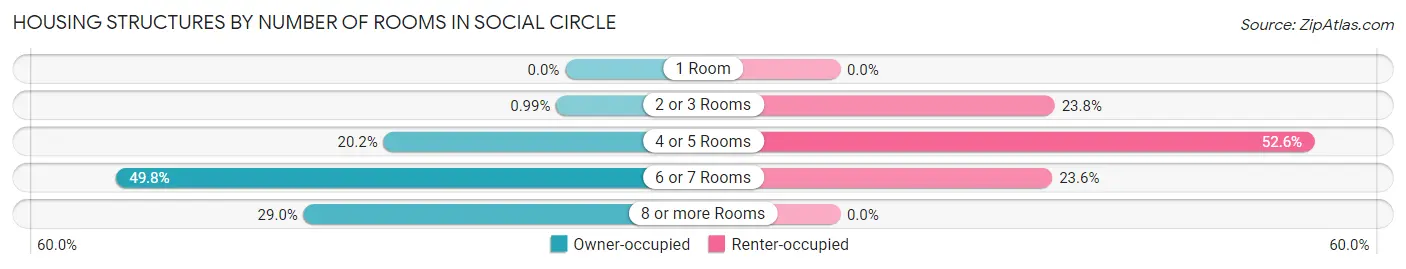
| Number of Rooms | Owner-occupied | Renter-occupied |
| 1 Room | 0 (0.0%) | 0 (0.0%) |
| 2 or 3 Rooms | 14 (1.0%) | 87 (23.8%) |
| 4 or 5 Rooms | 286 (20.2%) | 192 (52.6%) |
| 6 or 7 Rooms | 707 (49.8%) | 86 (23.6%) |
| 8 or more Rooms | 412 (29.0%) | 0 (0.0%) |
| Total | 1,419 (100.0%) | 365 (100.0%) |
Housing Structure by Heating Type in Social Circle
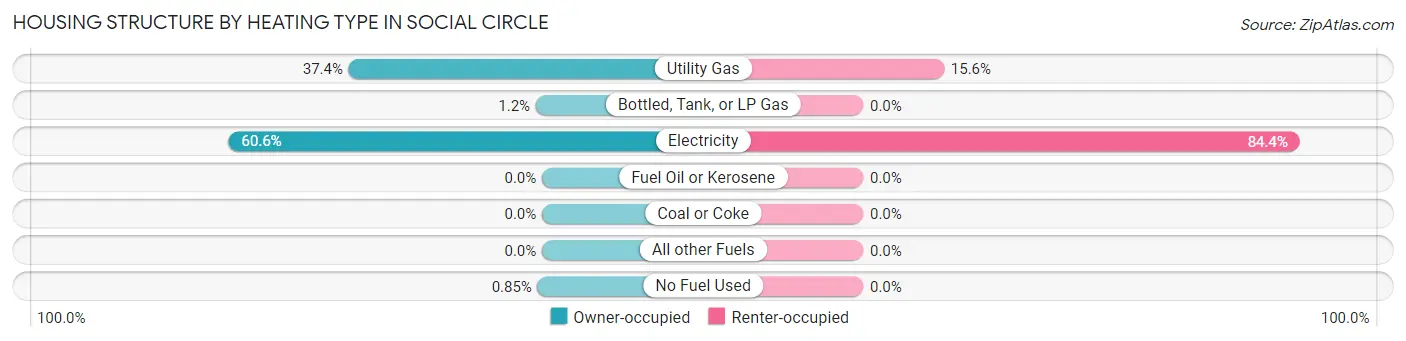
| Heating Type | Owner-occupied | Renter-occupied |
| Utility Gas | 530 (37.3%) | 57 (15.6%) |
| Bottled, Tank, or LP Gas | 17 (1.2%) | 0 (0.0%) |
| Electricity | 860 (60.6%) | 308 (84.4%) |
| Fuel Oil or Kerosene | 0 (0.0%) | 0 (0.0%) |
| Coal or Coke | 0 (0.0%) | 0 (0.0%) |
| All other Fuels | 0 (0.0%) | 0 (0.0%) |
| No Fuel Used | 12 (0.9%) | 0 (0.0%) |
| Total | 1,419 (100.0%) | 365 (100.0%) |
Household Vehicle Usage in Social Circle
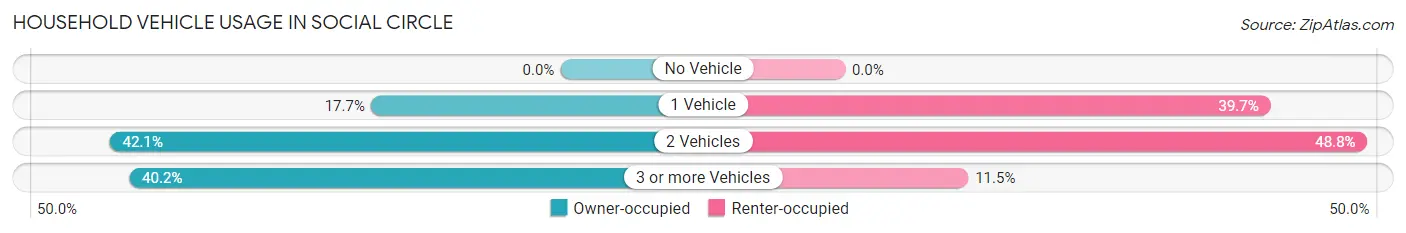
| Vehicles per Household | Owner-occupied | Renter-occupied |
| No Vehicle | 0 (0.0%) | 0 (0.0%) |
| 1 Vehicle | 251 (17.7%) | 145 (39.7%) |
| 2 Vehicles | 597 (42.1%) | 178 (48.8%) |
| 3 or more Vehicles | 571 (40.2%) | 42 (11.5%) |
| Total | 1,419 (100.0%) | 365 (100.0%) |
Real Estate & Mortgages in Social Circle
Real Estate and Mortgage Overview in Social Circle
| Characteristic | Without Mortgage | With Mortgage |
| Housing Units | 295 | 1,124 |
| Median Property Value | $205,200 | $227,000 |
| Median Household Income | $81,157 | $277 |
| Monthly Housing Costs | $595 | $183 |
| Real Estate Taxes | $1,843 | $62 |
Property Value by Mortgage Status in Social Circle
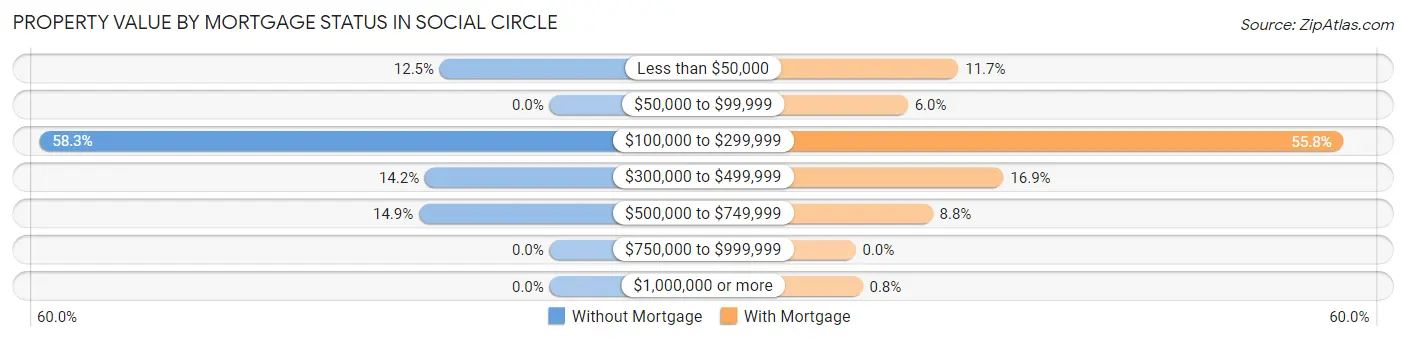
| Property Value | Without Mortgage | With Mortgage |
| Less than $50,000 | 37 (12.5%) | 132 (11.7%) |
| $50,000 to $99,999 | 0 (0.0%) | 67 (6.0%) |
| $100,000 to $299,999 | 172 (58.3%) | 627 (55.8%) |
| $300,000 to $499,999 | 42 (14.2%) | 190 (16.9%) |
| $500,000 to $749,999 | 44 (14.9%) | 99 (8.8%) |
| $750,000 to $999,999 | 0 (0.0%) | 0 (0.0%) |
| $1,000,000 or more | 0 (0.0%) | 9 (0.8%) |
| Total | 295 (100.0%) | 1,124 (100.0%) |
Household Income by Mortgage Status in Social Circle
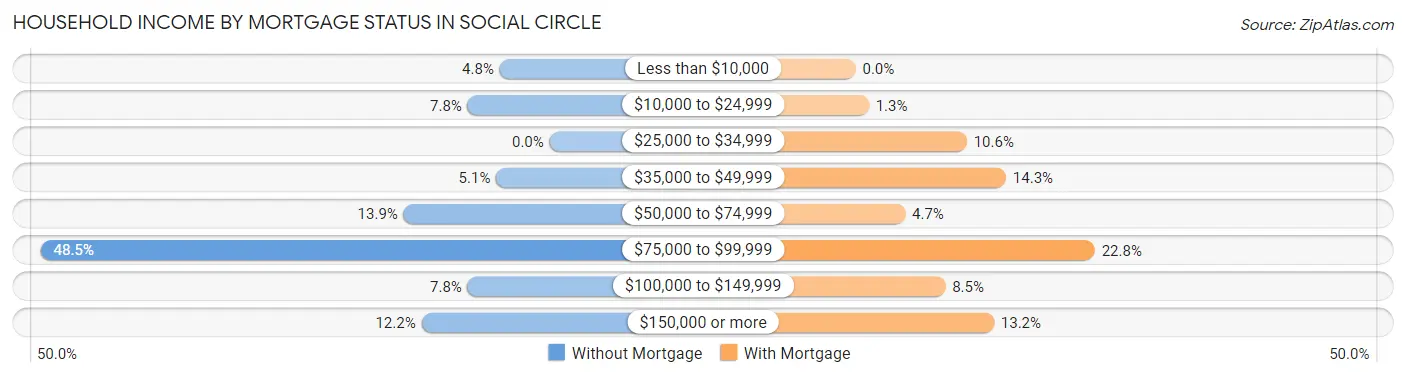
| Household Income | Without Mortgage | With Mortgage |
| Less than $10,000 | 14 (4.8%) | 0 (0.0%) |
| $10,000 to $24,999 | 23 (7.8%) | 14 (1.3%) |
| $25,000 to $34,999 | 0 (0.0%) | 119 (10.6%) |
| $35,000 to $49,999 | 15 (5.1%) | 161 (14.3%) |
| $50,000 to $74,999 | 41 (13.9%) | 53 (4.7%) |
| $75,000 to $99,999 | 143 (48.5%) | 256 (22.8%) |
| $100,000 to $149,999 | 23 (7.8%) | 96 (8.5%) |
| $150,000 or more | 36 (12.2%) | 148 (13.2%) |
| Total | 295 (100.0%) | 1,124 (100.0%) |
Property Value to Household Income Ratio in Social Circle
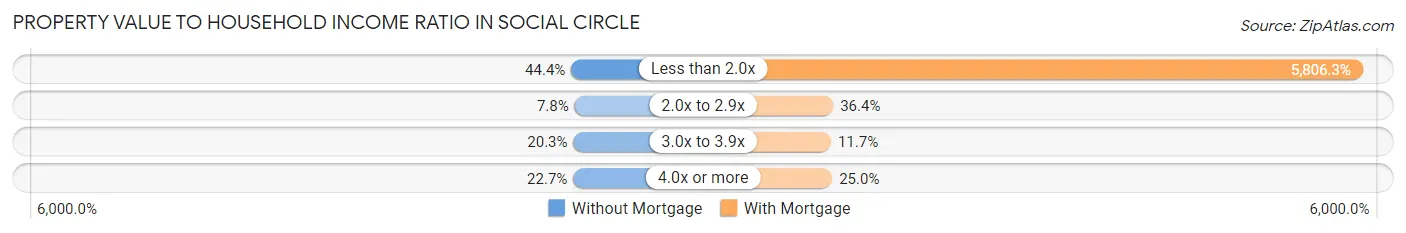
| Value-to-Income Ratio | Without Mortgage | With Mortgage |
| Less than 2.0x | 131 (44.4%) | 65,263 (5,806.3%) |
| 2.0x to 2.9x | 23 (7.8%) | 409 (36.4%) |
| 3.0x to 3.9x | 60 (20.3%) | 131 (11.7%) |
| 4.0x or more | 67 (22.7%) | 281 (25.0%) |
| Total | 295 (100.0%) | 1,124 (100.0%) |
Real Estate Taxes by Mortgage Status in Social Circle
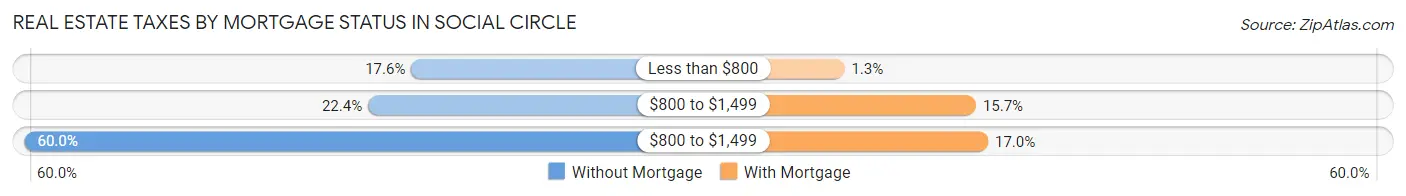
| Property Taxes | Without Mortgage | With Mortgage |
| Less than $800 | 52 (17.6%) | 14 (1.3%) |
| $800 to $1,499 | 66 (22.4%) | 176 (15.7%) |
| $800 to $1,499 | 177 (60.0%) | 191 (17.0%) |
| Total | 295 (100.0%) | 1,124 (100.0%) |
Health & Disability in Social Circle
Health Insurance Coverage by Age in Social Circle
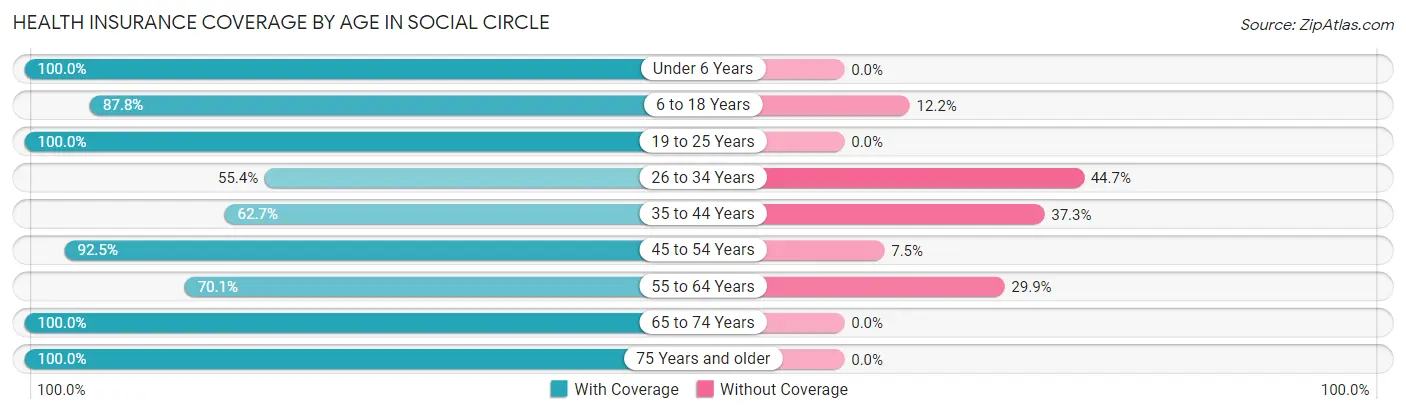
| Age Bracket | With Coverage | Without Coverage |
| Under 6 Years | 273 (100.0%) | 0 (0.0%) |
| 6 to 18 Years | 843 (87.8%) | 117 (12.2%) |
| 19 to 25 Years | 403 (100.0%) | 0 (0.0%) |
| 26 to 34 Years | 440 (55.3%) | 355 (44.7%) |
| 35 to 44 Years | 353 (62.7%) | 210 (37.3%) |
| 45 to 54 Years | 521 (92.5%) | 42 (7.5%) |
| 55 to 64 Years | 498 (70.1%) | 212 (29.9%) |
| 65 to 74 Years | 447 (100.0%) | 0 (0.0%) |
| 75 Years and older | 219 (100.0%) | 0 (0.0%) |
| Total | 3,997 (81.0%) | 936 (19.0%) |
Health Insurance Coverage by Citizenship Status in Social Circle
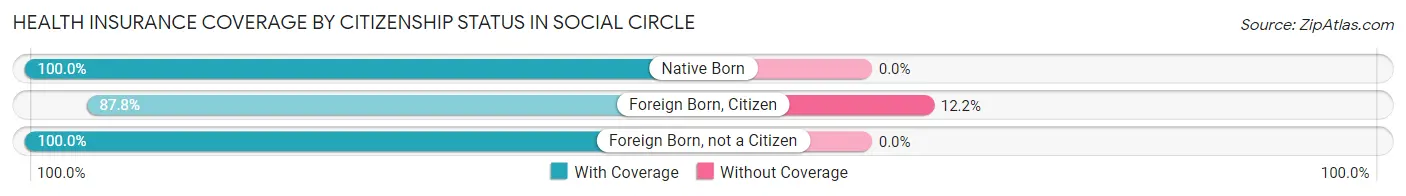
| Citizenship Status | With Coverage | Without Coverage |
| Native Born | 273 (100.0%) | 0 (0.0%) |
| Foreign Born, Citizen | 843 (87.8%) | 117 (12.2%) |
| Foreign Born, not a Citizen | 403 (100.0%) | 0 (0.0%) |
Health Insurance Coverage by Household Income in Social Circle
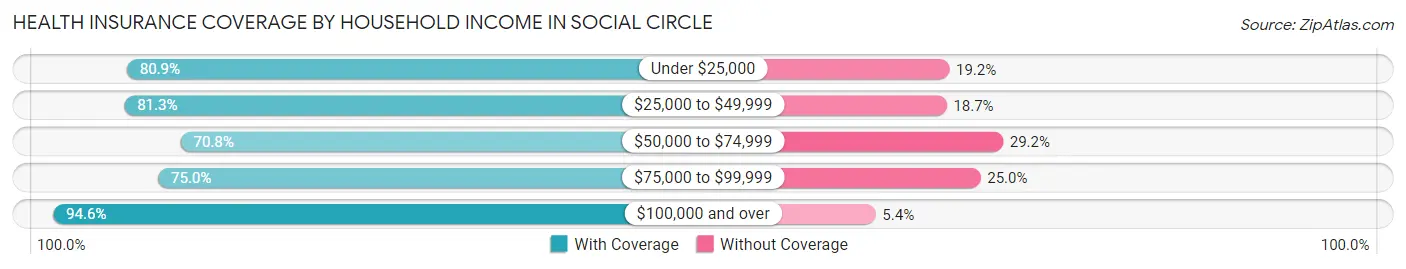
| Household Income | With Coverage | Without Coverage |
| Under $25,000 | 287 (80.8%) | 68 (19.2%) |
| $25,000 to $49,999 | 244 (81.3%) | 56 (18.7%) |
| $50,000 to $74,999 | 722 (70.8%) | 298 (29.2%) |
| $75,000 to $99,999 | 1,295 (75.0%) | 432 (25.0%) |
| $100,000 and over | 1,449 (94.6%) | 82 (5.4%) |
Public vs Private Health Insurance Coverage by Age in Social Circle
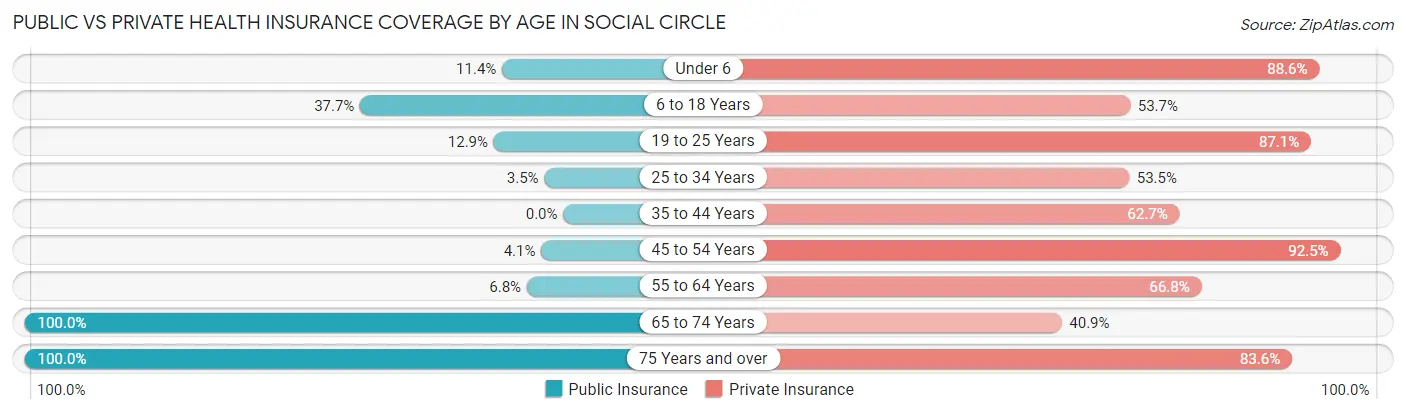
| Age Bracket | Public Insurance | Private Insurance |
| Under 6 | 31 (11.4%) | 242 (88.6%) |
| 6 to 18 Years | 362 (37.7%) | 515 (53.6%) |
| 19 to 25 Years | 52 (12.9%) | 351 (87.1%) |
| 25 to 34 Years | 28 (3.5%) | 425 (53.5%) |
| 35 to 44 Years | 0 (0.0%) | 353 (62.7%) |
| 45 to 54 Years | 23 (4.1%) | 521 (92.5%) |
| 55 to 64 Years | 48 (6.8%) | 474 (66.8%) |
| 65 to 74 Years | 447 (100.0%) | 183 (40.9%) |
| 75 Years and over | 219 (100.0%) | 183 (83.6%) |
| Total | 1,210 (24.5%) | 3,247 (65.8%) |
Disability Status by Sex by Age in Social Circle
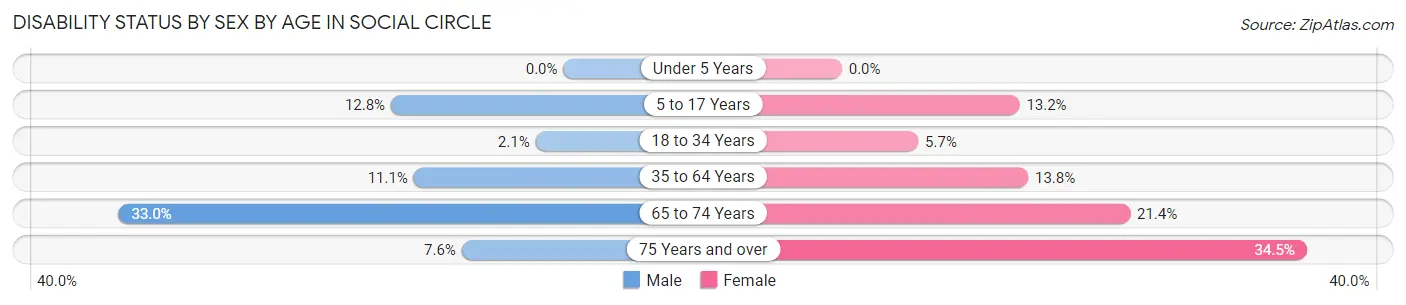
| Age Bracket | Male | Female |
| Under 5 Years | 0 (0.0%) | 0 (0.0%) |
| 5 to 17 Years | 92 (12.8%) | 36 (13.2%) |
| 18 to 34 Years | 13 (2.1%) | 33 (5.7%) |
| 35 to 64 Years | 106 (11.1%) | 122 (13.8%) |
| 65 to 74 Years | 72 (33.0%) | 49 (21.4%) |
| 75 Years and over | 8 (7.5%) | 39 (34.5%) |
Disability Class by Sex by Age in Social Circle
Disability Class: Hearing Difficulty
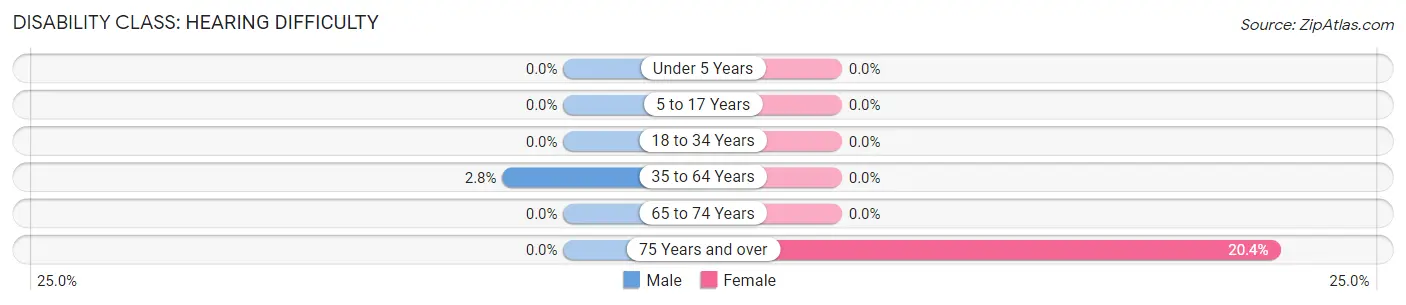
| Age Bracket | Male | Female |
| Under 5 Years | 0 (0.0%) | 0 (0.0%) |
| 5 to 17 Years | 0 (0.0%) | 0 (0.0%) |
| 18 to 34 Years | 0 (0.0%) | 0 (0.0%) |
| 35 to 64 Years | 27 (2.8%) | 0 (0.0%) |
| 65 to 74 Years | 0 (0.0%) | 0 (0.0%) |
| 75 Years and over | 0 (0.0%) | 23 (20.3%) |
Disability Class: Vision Difficulty
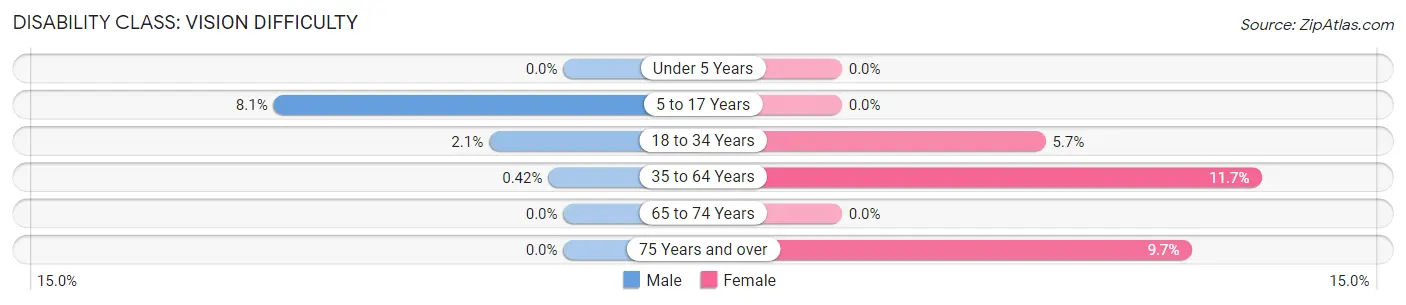
| Age Bracket | Male | Female |
| Under 5 Years | 0 (0.0%) | 0 (0.0%) |
| 5 to 17 Years | 58 (8.1%) | 0 (0.0%) |
| 18 to 34 Years | 13 (2.1%) | 33 (5.7%) |
| 35 to 64 Years | 4 (0.4%) | 103 (11.7%) |
| 65 to 74 Years | 0 (0.0%) | 0 (0.0%) |
| 75 Years and over | 0 (0.0%) | 11 (9.7%) |
Disability Class: Cognitive Difficulty
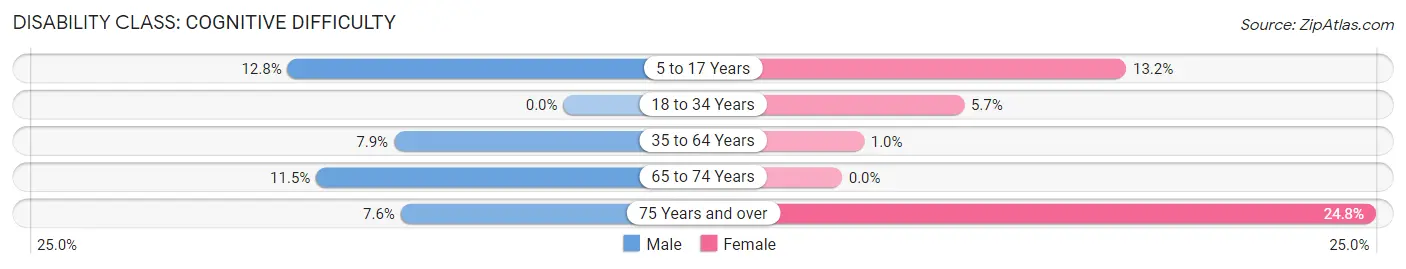
| Age Bracket | Male | Female |
| 5 to 17 Years | 92 (12.8%) | 36 (13.2%) |
| 18 to 34 Years | 0 (0.0%) | 33 (5.7%) |
| 35 to 64 Years | 75 (7.9%) | 9 (1.0%) |
| 65 to 74 Years | 25 (11.5%) | 0 (0.0%) |
| 75 Years and over | 8 (7.5%) | 28 (24.8%) |
Disability Class: Ambulatory Difficulty
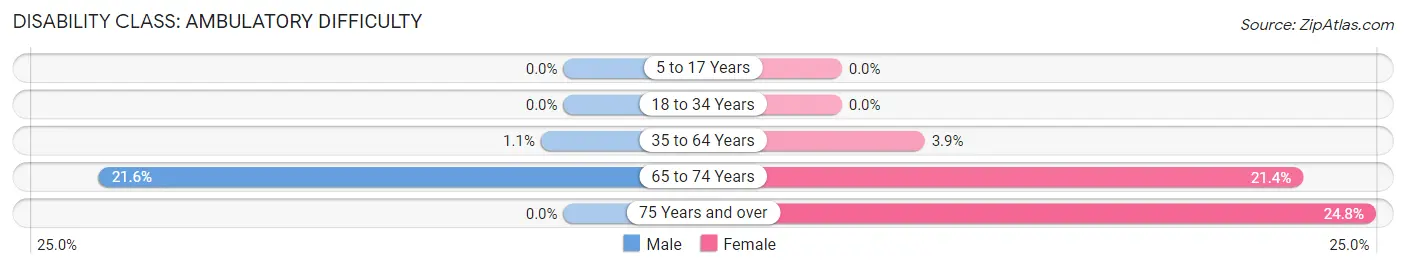
| Age Bracket | Male | Female |
| 5 to 17 Years | 0 (0.0%) | 0 (0.0%) |
| 18 to 34 Years | 0 (0.0%) | 0 (0.0%) |
| 35 to 64 Years | 10 (1.1%) | 34 (3.8%) |
| 65 to 74 Years | 47 (21.6%) | 49 (21.4%) |
| 75 Years and over | 0 (0.0%) | 28 (24.8%) |
Disability Class: Self-Care Difficulty
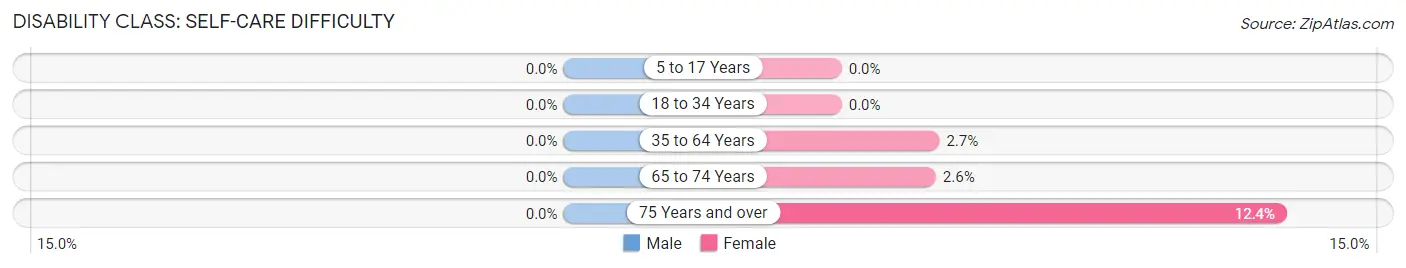
| Age Bracket | Male | Female |
| 5 to 17 Years | 0 (0.0%) | 0 (0.0%) |
| 18 to 34 Years | 0 (0.0%) | 0 (0.0%) |
| 35 to 64 Years | 0 (0.0%) | 24 (2.7%) |
| 65 to 74 Years | 0 (0.0%) | 6 (2.6%) |
| 75 Years and over | 0 (0.0%) | 14 (12.4%) |
Technology Access in Social Circle
Computing Device Access in Social Circle
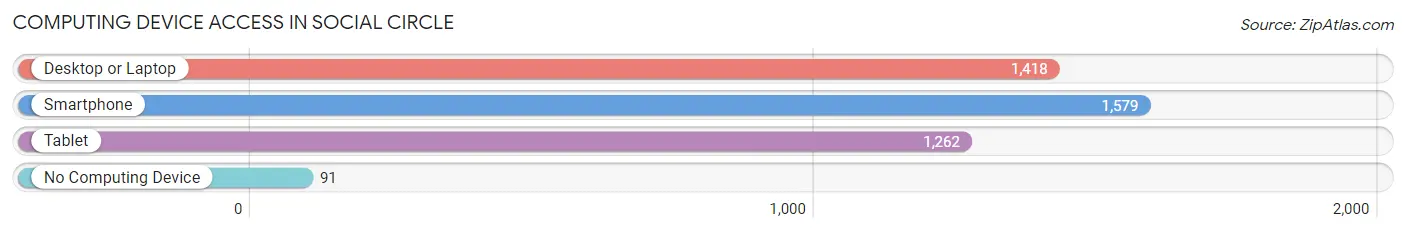
| Device Type | # Households | % Households |
| Desktop or Laptop | 1,418 | 79.5% |
| Smartphone | 1,579 | 88.5% |
| Tablet | 1,262 | 70.7% |
| No Computing Device | 91 | 5.1% |
| Total | 1,784 | 100.0% |
Internet Access in Social Circle
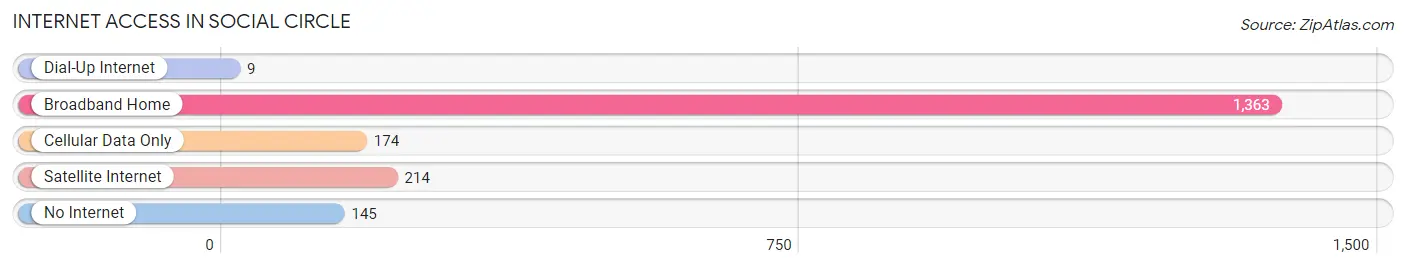
| Internet Type | # Households | % Households |
| Dial-Up Internet | 9 | 0.5% |
| Broadband Home | 1,363 | 76.4% |
| Cellular Data Only | 174 | 9.8% |
| Satellite Internet | 214 | 12.0% |
| No Internet | 145 | 8.1% |
| Total | 1,784 | 100.0% |
Social Circle Summary
History
Social Circle, Georgia is a small city located in Walton County, Georgia. It was founded in 1820 and is the county seat of Walton County. The city was named after the Social Circle, a group of Native Americans who lived in the area. The city was originally known as "The Social Circle" and was later changed to "Social Circle" in 1821.
The city was originally a trading post for the Cherokee Indians and was a popular stop for travelers on the old Federal Road. The city was also a major stop on the railroad line that ran from Atlanta to Augusta. The city was incorporated in 1832 and was the first city in Walton County to be incorporated.
The city has a rich history of industry and agriculture. In the late 1800s, the city was home to several cotton mills, a sawmill, a gristmill, and a brickyard. The city was also home to several farms and orchards. The city was also home to several churches, including the First Baptist Church, which was founded in 1820.
The city was also home to several schools, including the Social Circle High School, which was founded in 1891. The city was also home to several businesses, including a bank, a hotel, a general store, and a post office.
Geography
Social Circle is located in the eastern part of Walton County, Georgia. The city is located about 40 miles east of Atlanta and about 20 miles west of Athens. The city is situated on the banks of the Apalachee River and is surrounded by rolling hills and forests. The city has a total area of 4.2 square miles, all of which is land.
The city has a humid subtropical climate, with hot, humid summers and mild winters. The average temperature in the summer is around 80 degrees Fahrenheit and the average temperature in the winter is around 50 degrees Fahrenheit.
Economy
The economy of Social Circle is largely based on agriculture and manufacturing. The city is home to several farms and orchards, as well as several manufacturing plants. The city is also home to several businesses, including a bank, a hotel, a general store, and a post office.
The city is also home to several educational institutions, including Social Circle High School, Social Circle Middle School, and Social Circle Elementary School. The city is also home to several churches, including the First Baptist Church, which was founded in 1820.
Demographics
As of the 2010 census, the population of Social Circle was 4,912. The racial makeup of the city was 79.3% White, 17.2% African American, 0.3% Native American, 0.7% Asian, 0.1% Pacific Islander, 1.2% from other races, and 1.4% from two or more races. Hispanic or Latino of any race were 3.2% of the population.
The median income for a household in the city was $37,917, and the median income for a family was $45,938. The per capita income for the city was $19,945. About 14.2% of families and 17.3% of the population were below the poverty line, including 25.2% of those under age 18 and 11.2% of those age 65 or over.
Common Questions
What is Per Capita Income in Social Circle?
Per Capita income in Social Circle is $30,414.
What is the Median Family Income in Social Circle?
Median Family Income in Social Circle is $93,245.
What is the Median Household income in Social Circle?
Median Household Income in Social Circle is $68,333.
What is Income or Wage Gap in Social Circle?
Income or Wage Gap in Social Circle is 26.8%.
Women in Social Circle earn 73.2 cents for every dollar earned by a man.
What is Inequality or Gini Index in Social Circle?
Inequality or Gini Index in Social Circle is 0.37.
What is the Total Population of Social Circle?
Total Population of Social Circle is 5,011.
What is the Total Male Population of Social Circle?
Total Male Population of Social Circle is 2,700.
What is the Total Female Population of Social Circle?
Total Female Population of Social Circle is 2,311.
What is the Ratio of Males per 100 Females in Social Circle?
There are 116.83 Males per 100 Females in Social Circle.
What is the Ratio of Females per 100 Males in Social Circle?
There are 85.59 Females per 100 Males in Social Circle.
What is the Median Population Age in Social Circle?
Median Population Age in Social Circle is 36.8 Years.
What is the Average Family Size in Social Circle
Average Family Size in Social Circle is 3.5 People.
What is the Average Household Size in Social Circle
Average Household Size in Social Circle is 2.8 People.
How Large is the Labor Force in Social Circle?
There are 2,614 People in the Labor Forcein in Social Circle.
What is the Percentage of People in the Labor Force in Social Circle?
64.8% of People are in the Labor Force in Social Circle.
What is the Unemployment Rate in Social Circle?
Unemployment Rate in Social Circle is 6.6%.