Martinez, GA Map & Demographics
Martinez Map
Martinez Overview
$42,399
PER CAPITA INCOME
$95,767
AVG FAMILY INCOME
$80,130
AVG HOUSEHOLD INCOME
31.5%
WAGE / INCOME GAP [ % ]
68.5¢/ $1
WAGE / INCOME GAP [ $ ]
$14,309
FAMILY INCOME DEFICIT
0.43
INEQUALITY / GINI INDEX
33,773
TOTAL POPULATION
16,080
MALE POPULATION
17,693
FEMALE POPULATION
90.88
MALES / 100 FEMALES
110.03
FEMALES / 100 MALES
39.1
MEDIAN AGE
3.5
AVG FAMILY SIZE
2.8
AVG HOUSEHOLD SIZE
17,014
LABOR FORCE [ PEOPLE ]
63.4%
PERCENT IN LABOR FORCE
3.9%
UNEMPLOYMENT RATE
Martinez Area Codes
Income in Martinez
Income Overview in Martinez
Per Capita Income in Martinez is $42,399, while median incomes of families and households are $95,767 and $80,130 respectively.
| Characteristic | Number | Measure |
| Per Capita Income | 33,773 | $42,399 |
| Median Family Income | 8,242 | $95,767 |
| Mean Family Income | 8,242 | $125,111 |
| Median Household Income | 11,968 | $80,130 |
| Mean Household Income | 11,968 | $108,571 |
| Income Deficit | 8,242 | $14,309 |
| Wage / Income Gap (%) | 33,773 | 31.54% |
| Wage / Income Gap ($) | 33,773 | 68.46¢ per $1 |
| Gini / Inequality Index | 33,773 | 0.43 |
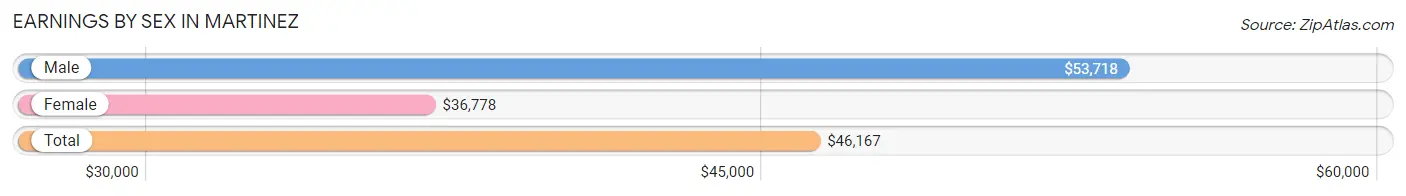
Earnings by Sex in Martinez
Average Earnings in Martinez are $46,167, $53,718 for men and $36,778 for women, a difference of 31.5%.
| Sex | Number | Average Earnings |
| Male | 9,296 (51.9%) | $53,718 |
| Female | 8,607 (48.1%) | $36,778 |
| Total | 17,903 (100.0%) | $46,167 |
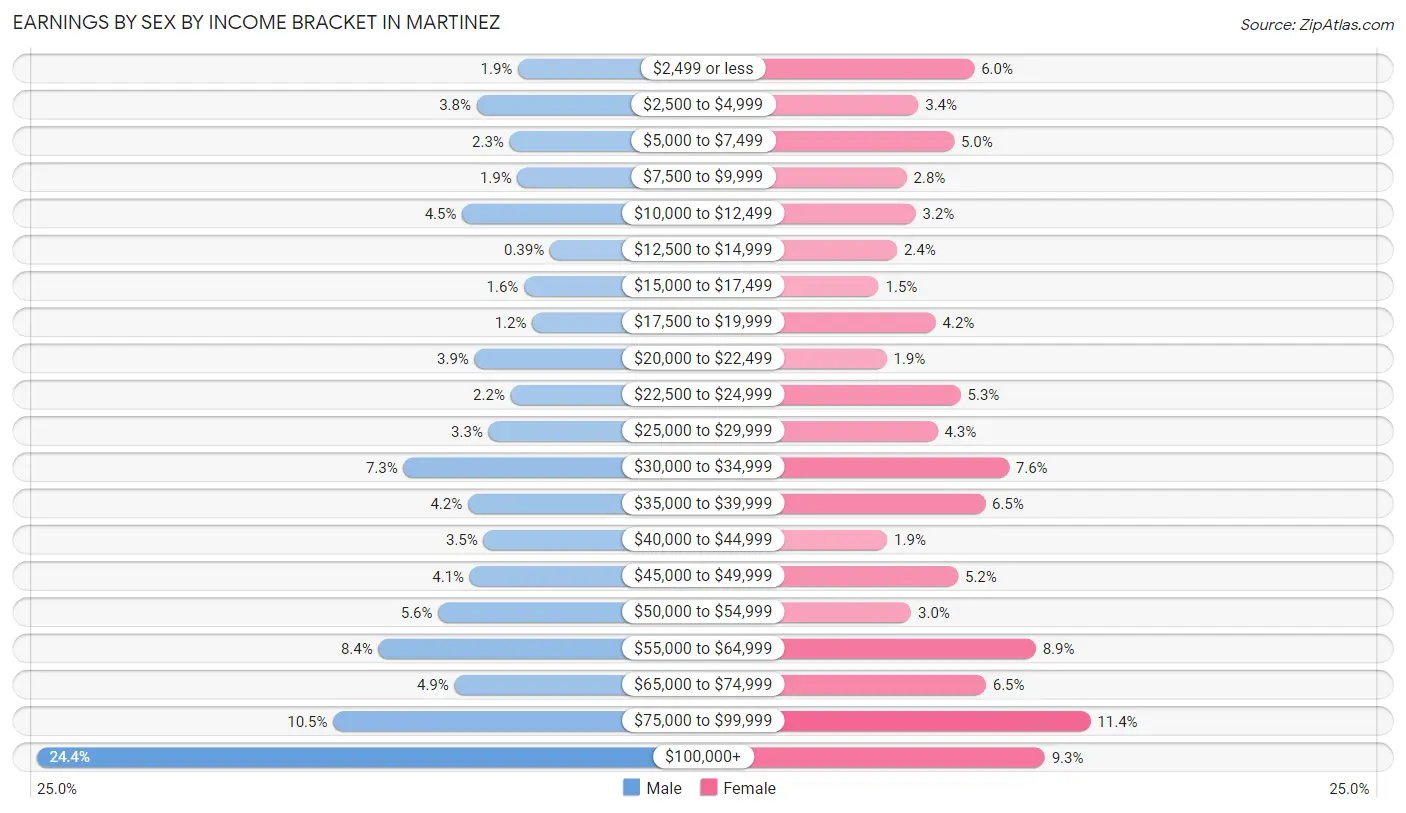
Earnings by Sex by Income Bracket in Martinez
The most common earnings brackets in Martinez are $100,000+ for men (2,272 | 24.4%) and $75,000 to $99,999 for women (982 | 11.4%).
| Income | Male | Female |
| $2,499 or less | 175 (1.9%) | 514 (6.0%) |
| $2,500 to $4,999 | 355 (3.8%) | 288 (3.4%) |
| $5,000 to $7,499 | 212 (2.3%) | 432 (5.0%) |
| $7,500 to $9,999 | 178 (1.9%) | 241 (2.8%) |
| $10,000 to $12,499 | 418 (4.5%) | 277 (3.2%) |
| $12,500 to $14,999 | 36 (0.4%) | 202 (2.4%) |
| $15,000 to $17,499 | 149 (1.6%) | 128 (1.5%) |
| $17,500 to $19,999 | 113 (1.2%) | 358 (4.2%) |
| $20,000 to $22,499 | 364 (3.9%) | 160 (1.9%) |
| $22,500 to $24,999 | 207 (2.2%) | 459 (5.3%) |
| $25,000 to $29,999 | 303 (3.3%) | 366 (4.3%) |
| $30,000 to $34,999 | 674 (7.2%) | 653 (7.6%) |
| $35,000 to $39,999 | 393 (4.2%) | 557 (6.5%) |
| $40,000 to $44,999 | 325 (3.5%) | 163 (1.9%) |
| $45,000 to $49,999 | 385 (4.1%) | 448 (5.2%) |
| $50,000 to $54,999 | 522 (5.6%) | 259 (3.0%) |
| $55,000 to $64,999 | 783 (8.4%) | 762 (8.8%) |
| $65,000 to $74,999 | 452 (4.9%) | 560 (6.5%) |
| $75,000 to $99,999 | 980 (10.5%) | 982 (11.4%) |
| $100,000+ | 2,272 (24.4%) | 798 (9.3%) |
| Total | 9,296 (100.0%) | 8,607 (100.0%) |
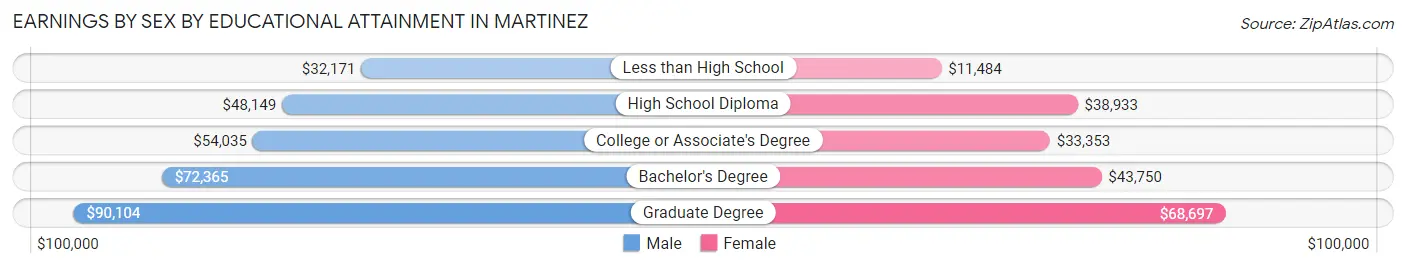
Earnings by Sex by Educational Attainment in Martinez
Average earnings in Martinez are $57,466 for men and $45,318 for women, a difference of 21.1%. Men with an educational attainment of graduate degree enjoy the highest average annual earnings of $90,104, while those with less than high school education earn the least with $32,171. Women with an educational attainment of graduate degree earn the most with the average annual earnings of $68,697, while those with less than high school education have the smallest earnings of $11,484.
| Educational Attainment | Male Income | Female Income |
| Less than High School | $32,171 | $11,484 |
| High School Diploma | $48,149 | $38,933 |
| College or Associate's Degree | $54,035 | $33,353 |
| Bachelor's Degree | $72,365 | $43,750 |
| Graduate Degree | $90,104 | $68,697 |
| Total | $57,466 | $45,318 |
Family Income in Martinez
Family Income Brackets in Martinez
According to the Martinez family income data, there are 1,723 families falling into the $100,000 to $149,999 income range, which is the most common income bracket and makes up 20.9% of all families. Conversely, the $10,000 to $14,999 income bracket is the least frequent group with only 132 families (1.6%) belonging to this category.
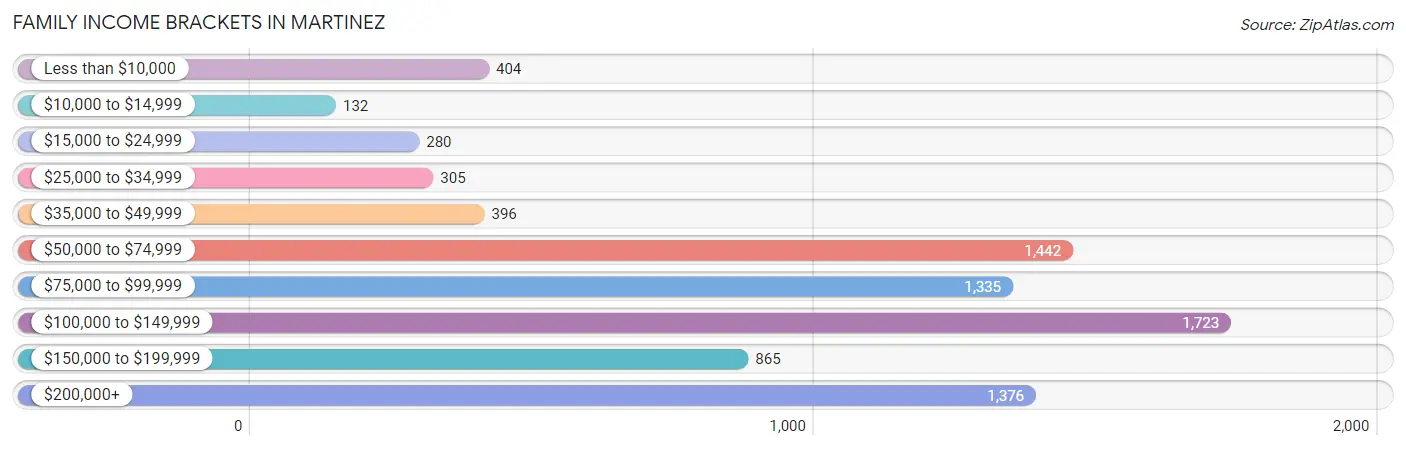
| Income Bracket | # Families | % Families |
| Less than $10,000 | 404 | 4.9% |
| $10,000 to $14,999 | 132 | 1.6% |
| $15,000 to $24,999 | 280 | 3.4% |
| $25,000 to $34,999 | 305 | 3.7% |
| $35,000 to $49,999 | 396 | 4.8% |
| $50,000 to $74,999 | 1,442 | 17.5% |
| $75,000 to $99,999 | 1,335 | 16.2% |
| $100,000 to $149,999 | 1,723 | 20.9% |
| $150,000 to $199,999 | 865 | 10.5% |
| $200,000+ | 1,376 | 16.7% |
Family Income by Famaliy Size in Martinez
5-person families (532 | 6.5%) account for the highest median family income in Martinez with $120,278 per family, while 2-person families (3,755 | 45.6%) have the highest median income of $46,242 per family member.
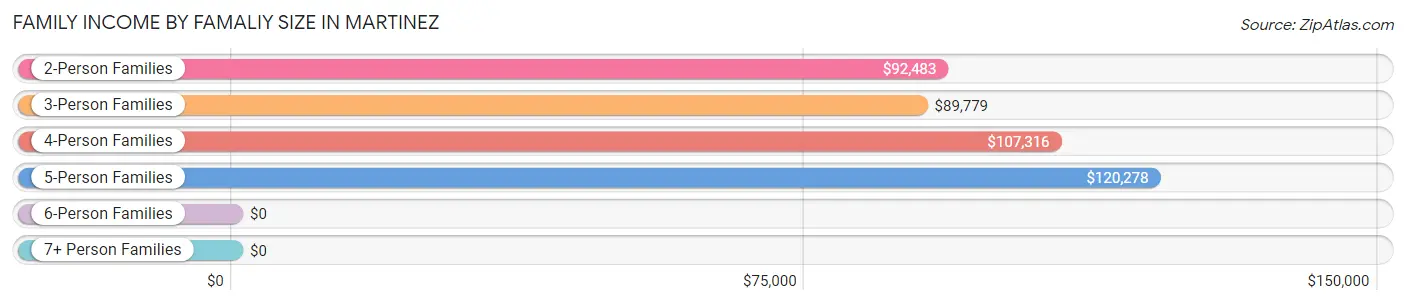
| Income Bracket | # Families | Median Income |
| 2-Person Families | 3,755 (45.6%) | $92,483 |
| 3-Person Families | 2,086 (25.3%) | $89,779 |
| 4-Person Families | 1,571 (19.1%) | $107,316 |
| 5-Person Families | 532 (6.5%) | $120,278 |
| 6-Person Families | 254 (3.1%) | $0 |
| 7+ Person Families | 44 (0.5%) | $0 |
| Total | 8,242 (100.0%) | $95,767 |
Family Income by Number of Earners in Martinez
The median family income in Martinez is $95,767, with families comprising 3+ earners (850) having the highest median family income of $181,215, while families with no earners (1,228) have the lowest median family income of $54,692, accounting for 10.3% and 14.9% of families, respectively.
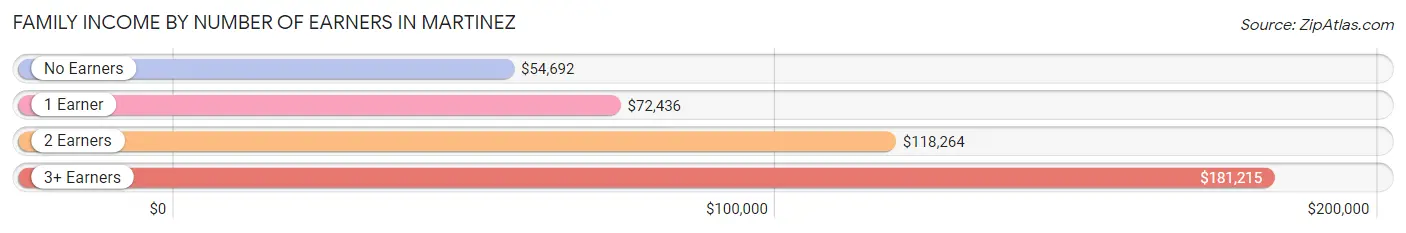
| Number of Earners | # Families | Median Income |
| No Earners | 1,228 (14.9%) | $54,692 |
| 1 Earner | 2,962 (35.9%) | $72,436 |
| 2 Earners | 3,202 (38.9%) | $118,264 |
| 3+ Earners | 850 (10.3%) | $181,215 |
| Total | 8,242 (100.0%) | $95,767 |
Household Income in Martinez
Household Income Brackets in Martinez
With 2,226 households falling in the category, the $50,000 to $74,999 income range is the most frequent in Martinez, accounting for 18.6% of all households. In contrast, only 191 households (1.6%) fall into the $10,000 to $14,999 income bracket, making it the least populous group.
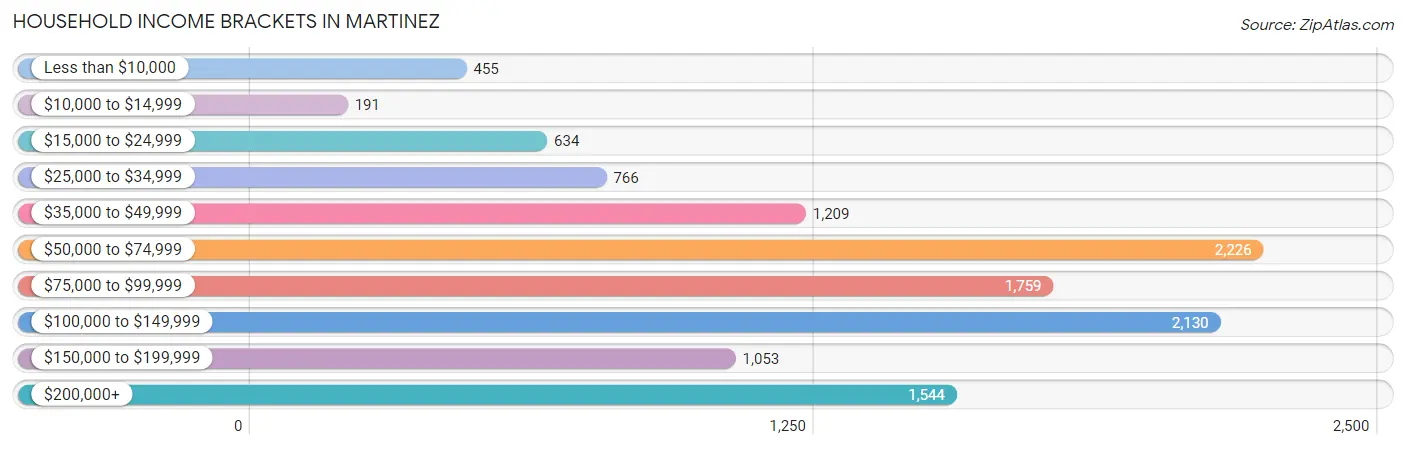
| Income Bracket | # Households | % Households |
| Less than $10,000 | 455 | 3.8% |
| $10,000 to $14,999 | 191 | 1.6% |
| $15,000 to $24,999 | 634 | 5.3% |
| $25,000 to $34,999 | 766 | 6.4% |
| $35,000 to $49,999 | 1,209 | 10.1% |
| $50,000 to $74,999 | 2,226 | 18.6% |
| $75,000 to $99,999 | 1,759 | 14.7% |
| $100,000 to $149,999 | 2,130 | 17.8% |
| $150,000 to $199,999 | 1,053 | 8.8% |
| $200,000+ | 1,544 | 12.9% |
Household Income by Householder Age in Martinez
The median household income in Martinez is $80,130, with the highest median household income of $115,202 found in the 45 to 64 years age bracket for the primary householder. A total of 3,973 households (33.2%) fall into this category. Meanwhile, the 15 to 24 years age bracket for the primary householder has the lowest median household income of $0, with 75 households (0.6%) in this group.
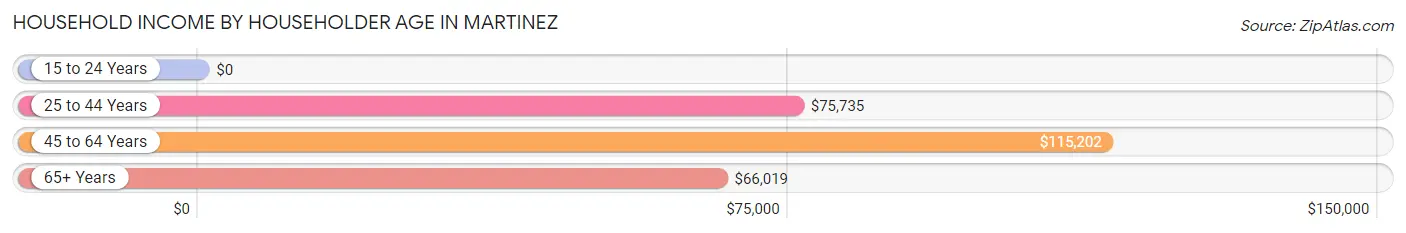
| Income Bracket | # Households | Median Income |
| 15 to 24 Years | 75 (0.6%) | $0 |
| 25 to 44 Years | 4,677 (39.1%) | $75,735 |
| 45 to 64 Years | 3,973 (33.2%) | $115,202 |
| 65+ Years | 3,243 (27.1%) | $66,019 |
| Total | 11,968 (100.0%) | $80,130 |
Poverty in Martinez
Income Below Poverty by Sex and Age in Martinez
With 7.9% poverty level for males and 10.7% for females among the residents of Martinez, 6 to 11 year old males and 16 and 17 year old females are the most vulnerable to poverty, with 328 males (22.9%) and 128 females (27.0%) in their respective age groups living below the poverty level.
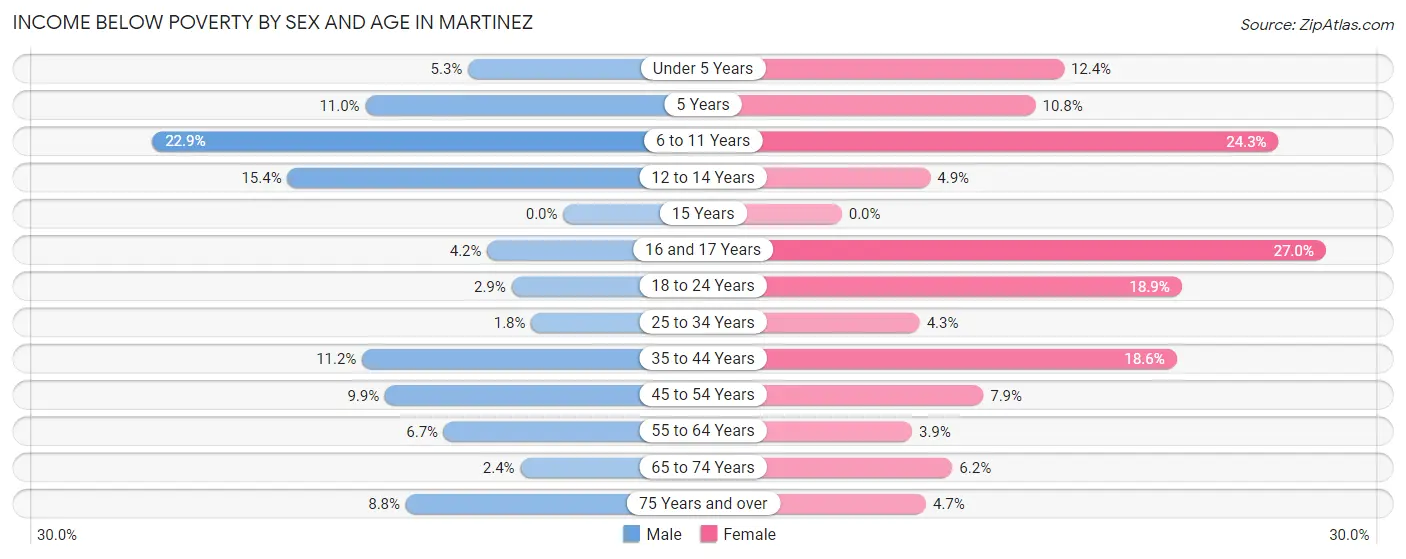
| Age Bracket | Male | Female |
| Under 5 Years | 46 (5.3%) | 142 (12.4%) |
| 5 Years | 27 (11.0%) | 15 (10.8%) |
| 6 to 11 Years | 328 (22.9%) | 291 (24.3%) |
| 12 to 14 Years | 112 (15.4%) | 38 (4.9%) |
| 15 Years | 0 (0.0%) | 0 (0.0%) |
| 16 and 17 Years | 20 (4.2%) | 128 (27.0%) |
| 18 to 24 Years | 33 (2.9%) | 234 (18.9%) |
| 25 to 34 Years | 46 (1.8%) | 99 (4.3%) |
| 35 to 44 Years | 221 (11.2%) | 531 (18.6%) |
| 45 to 54 Years | 193 (9.9%) | 149 (7.9%) |
| 55 to 64 Years | 138 (6.7%) | 92 (3.9%) |
| 65 to 74 Years | 38 (2.4%) | 106 (6.2%) |
| 75 Years and over | 67 (8.8%) | 69 (4.7%) |
| Total | 1,269 (7.9%) | 1,894 (10.7%) |
Income Above Poverty by Sex and Age in Martinez
According to the poverty statistics in Martinez, males aged 15 years and females aged 15 years are the age groups that are most secure financially, with 100.0% of males and 100.0% of females in these age groups living above the poverty line.
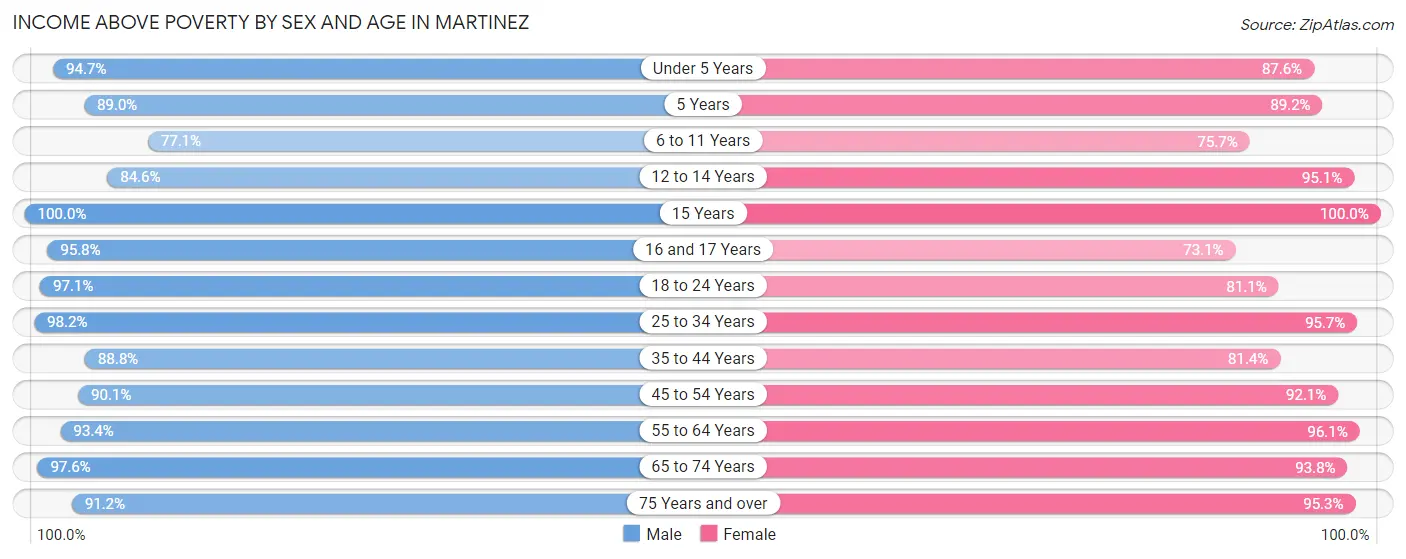
| Age Bracket | Male | Female |
| Under 5 Years | 822 (94.7%) | 1,006 (87.6%) |
| 5 Years | 218 (89.0%) | 124 (89.2%) |
| 6 to 11 Years | 1,105 (77.1%) | 906 (75.7%) |
| 12 to 14 Years | 617 (84.6%) | 733 (95.1%) |
| 15 Years | 247 (100.0%) | 113 (100.0%) |
| 16 and 17 Years | 453 (95.8%) | 347 (73.1%) |
| 18 to 24 Years | 1,112 (97.1%) | 1,003 (81.1%) |
| 25 to 34 Years | 2,541 (98.2%) | 2,183 (95.7%) |
| 35 to 44 Years | 1,753 (88.8%) | 2,318 (81.4%) |
| 45 to 54 Years | 1,750 (90.1%) | 1,741 (92.1%) |
| 55 to 64 Years | 1,936 (93.3%) | 2,260 (96.1%) |
| 65 to 74 Years | 1,549 (97.6%) | 1,614 (93.8%) |
| 75 Years and over | 697 (91.2%) | 1,403 (95.3%) |
| Total | 14,800 (92.1%) | 15,751 (89.3%) |
Income Below Poverty Among Married-Couple Families in Martinez
The poverty statistics for married-couple families in Martinez show that 4.0% or 243 of the total 6,109 families live below the poverty line. Families with no children have the highest poverty rate of 4.5%, comprising of 163 families. On the other hand, families with 3 or 4 children have the lowest poverty rate of 0.0%, which includes 0 families.
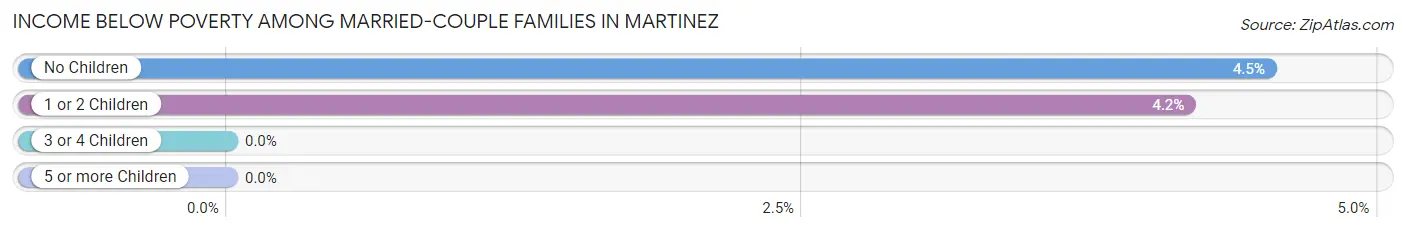
| Children | Above Poverty | Below Poverty |
| No Children | 3,445 (95.5%) | 163 (4.5%) |
| 1 or 2 Children | 1,838 (95.8%) | 80 (4.2%) |
| 3 or 4 Children | 550 (100.0%) | 0 (0.0%) |
| 5 or more Children | 33 (100.0%) | 0 (0.0%) |
| Total | 5,866 (96.0%) | 243 (4.0%) |
Income Below Poverty Among Single-Parent Households in Martinez
According to the poverty data in Martinez, 31.5% or 132 single-father households and 20.1% or 344 single-mother households are living below the poverty line. Among single-father households, those with 3 or 4 children have the highest poverty rate, with 94 households (79.0%) experiencing poverty. Likewise, among single-mother households, those with 3 or 4 children have the highest poverty rate, with 90 households (65.2%) falling below the poverty line.
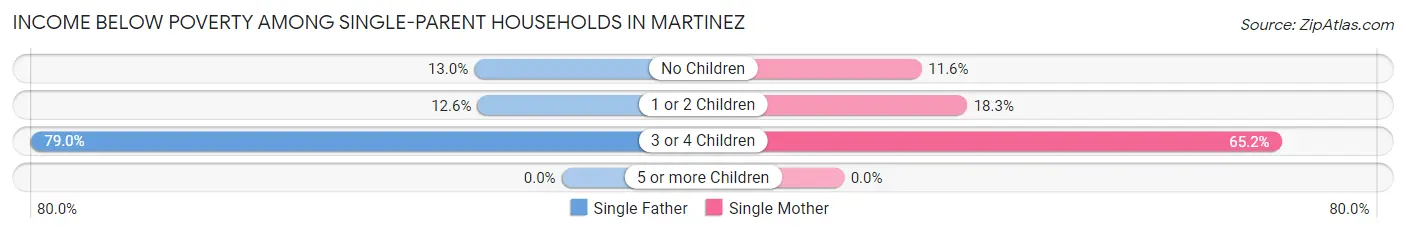
| Children | Single Father | Single Mother |
| No Children | 9 (13.0%) | 60 (11.6%) |
| 1 or 2 Children | 29 (12.6%) | 194 (18.3%) |
| 3 or 4 Children | 94 (79.0%) | 90 (65.2%) |
| 5 or more Children | 0 (0.0%) | 0 (0.0%) |
| Total | 132 (31.5%) | 344 (20.1%) |
Income Below Poverty Among Married-Couple vs Single-Parent Households in Martinez
The poverty data for Martinez shows that 243 of the married-couple family households (4.0%) and 476 of the single-parent households (22.3%) are living below the poverty level. Within the married-couple family households, those with no children have the highest poverty rate, with 163 households (4.5%) falling below the poverty line. Among the single-parent households, those with 3 or 4 children have the highest poverty rate, with 184 household (71.6%) living below poverty.
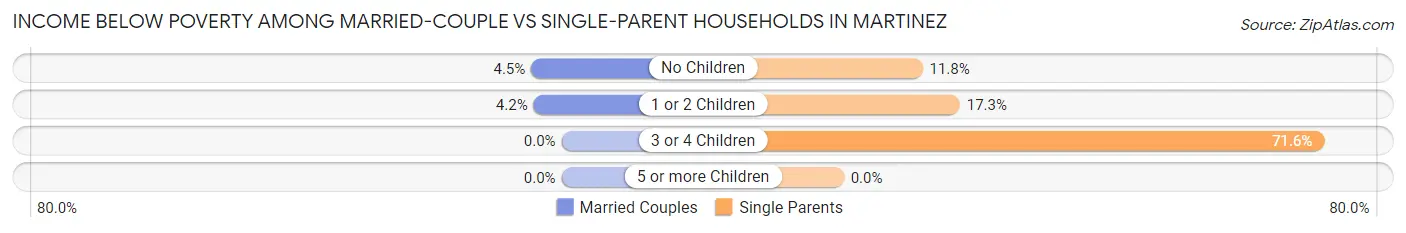
| Children | Married-Couple Families | Single-Parent Households |
| No Children | 163 (4.5%) | 69 (11.7%) |
| 1 or 2 Children | 80 (4.2%) | 223 (17.3%) |
| 3 or 4 Children | 0 (0.0%) | 184 (71.6%) |
| 5 or more Children | 0 (0.0%) | 0 (0.0%) |
| Total | 243 (4.0%) | 476 (22.3%) |
Race in Martinez
The most populous races in Martinez are White / Caucasian (24,976 | 74.0%), Black / African American (3,961 | 11.7%), and Asian (2,251 | 6.7%).
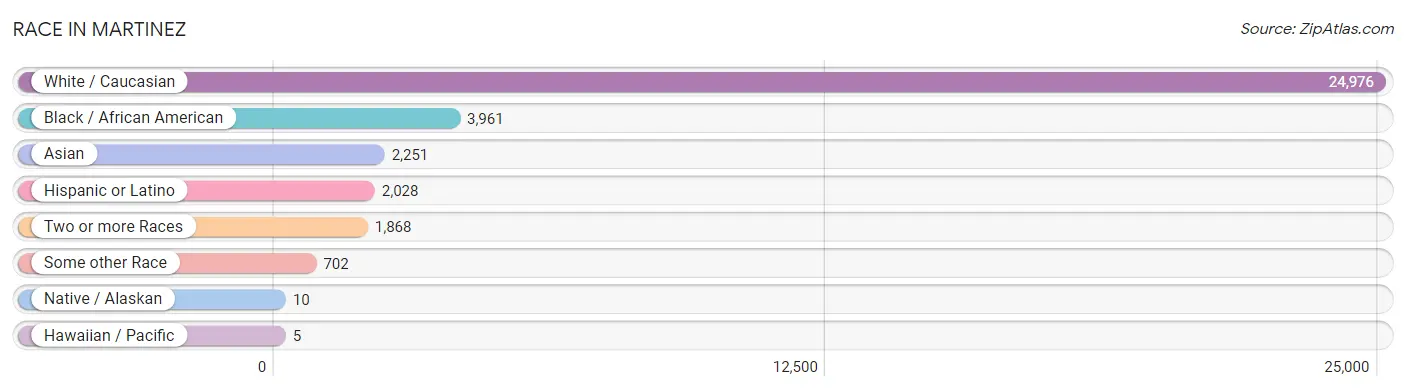
| Race | # Population | % Population |
| Asian | 2,251 | 6.7% |
| Black / African American | 3,961 | 11.7% |
| Hawaiian / Pacific | 5 | 0.0% |
| Hispanic or Latino | 2,028 | 6.0% |
| Native / Alaskan | 10 | 0.0% |
| White / Caucasian | 24,976 | 74.0% |
| Two or more Races | 1,868 | 5.5% |
| Some other Race | 702 | 2.1% |
| Total | 33,773 | 100.0% |
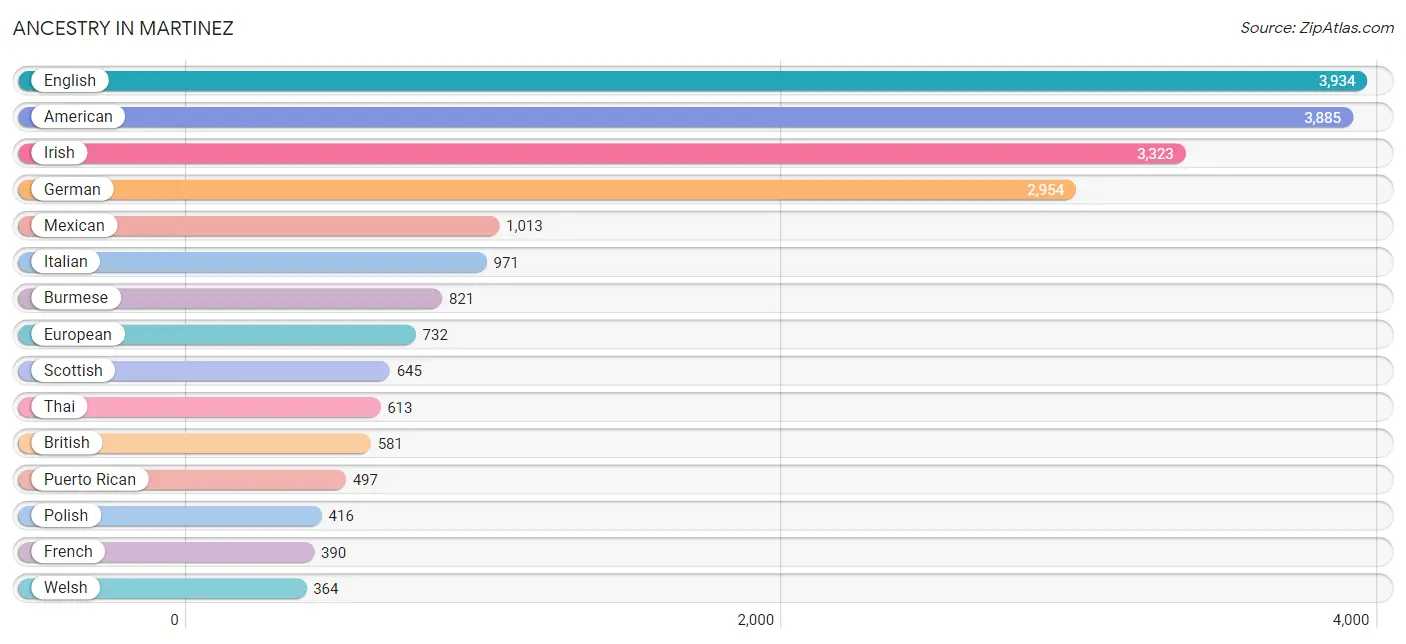
Ancestry in Martinez
The most populous ancestries reported in Martinez are English (3,934 | 11.7%), American (3,885 | 11.5%), Irish (3,323 | 9.8%), German (2,954 | 8.7%), and Mexican (1,013 | 3.0%), together accounting for 44.7% of all Martinez residents.
| Ancestry | # Population | % Population |
| Afghan | 54 | 0.2% |
| African | 28 | 0.1% |
| American | 3,885 | 11.5% |
| Arab | 288 | 0.9% |
| Armenian | 18 | 0.1% |
| Austrian | 39 | 0.1% |
| Belizean | 16 | 0.1% |
| Bhutanese | 129 | 0.4% |
| British | 581 | 1.7% |
| British West Indian | 6 | 0.0% |
| Burmese | 821 | 2.4% |
| Cajun | 14 | 0.0% |
| Canadian | 170 | 0.5% |
| Central American | 188 | 0.6% |
| Central American Indian | 8 | 0.0% |
| Cherokee | 159 | 0.5% |
| Chinese | 18 | 0.1% |
| Choctaw | 30 | 0.1% |
| Colombian | 96 | 0.3% |
| Croatian | 32 | 0.1% |
| Cuban | 41 | 0.1% |
| Czech | 41 | 0.1% |
| Danish | 118 | 0.4% |
| Dutch | 339 | 1.0% |
| Eastern European | 63 | 0.2% |
| Egyptian | 245 | 0.7% |
| English | 3,934 | 11.7% |
| European | 732 | 2.2% |
| Filipino | 32 | 0.1% |
| Finnish | 10 | 0.0% |
| French | 390 | 1.1% |
| French Canadian | 107 | 0.3% |
| German | 2,954 | 8.7% |
| Greek | 97 | 0.3% |
| Guamanian / Chamorro | 17 | 0.1% |
| Guatemalan | 14 | 0.0% |
| Haitian | 72 | 0.2% |
| Honduran | 1 | 0.0% |
| Hungarian | 129 | 0.4% |
| Indian (Asian) | 303 | 0.9% |
| Iranian | 82 | 0.2% |
| Irish | 3,323 | 9.8% |
| Italian | 971 | 2.9% |
| Jamaican | 21 | 0.1% |
| Korean | 86 | 0.3% |
| Lebanese | 30 | 0.1% |
| Lithuanian | 30 | 0.1% |
| Mexican | 1,013 | 3.0% |
| Mexican American Indian | 8 | 0.0% |
| Native Hawaiian | 20 | 0.1% |
| Navajo | 8 | 0.0% |
| Nigerian | 9 | 0.0% |
| Northern European | 9 | 0.0% |
| Norwegian | 208 | 0.6% |
| Pakistani | 89 | 0.3% |
| Palestinian | 13 | 0.0% |
| Panamanian | 51 | 0.2% |
| Pennsylvania German | 19 | 0.1% |
| Polish | 416 | 1.2% |
| Portuguese | 20 | 0.1% |
| Puerto Rican | 497 | 1.5% |
| Russian | 83 | 0.3% |
| Salvadoran | 122 | 0.4% |
| Samoan | 90 | 0.3% |
| Scotch-Irish | 288 | 0.9% |
| Scottish | 645 | 1.9% |
| Serbian | 10 | 0.0% |
| Slovak | 20 | 0.1% |
| Slovene | 17 | 0.1% |
| South American | 127 | 0.4% |
| Spaniard | 11 | 0.0% |
| Spanish | 30 | 0.1% |
| Sri Lankan | 291 | 0.9% |
| Subsaharan African | 200 | 0.6% |
| Sudanese | 163 | 0.5% |
| Swedish | 104 | 0.3% |
| Swiss | 103 | 0.3% |
| Thai | 613 | 1.8% |
| Trinidadian and Tobagonian | 17 | 0.1% |
| Turkish | 9 | 0.0% |
| Ukrainian | 33 | 0.1% |
| Venezuelan | 31 | 0.1% |
| Vietnamese | 92 | 0.3% |
| Welsh | 364 | 1.1% |
| West Indian | 8 | 0.0% |
| Yugoslavian | 7 | 0.0% | View All 86 Rows |
Immigrants in Martinez
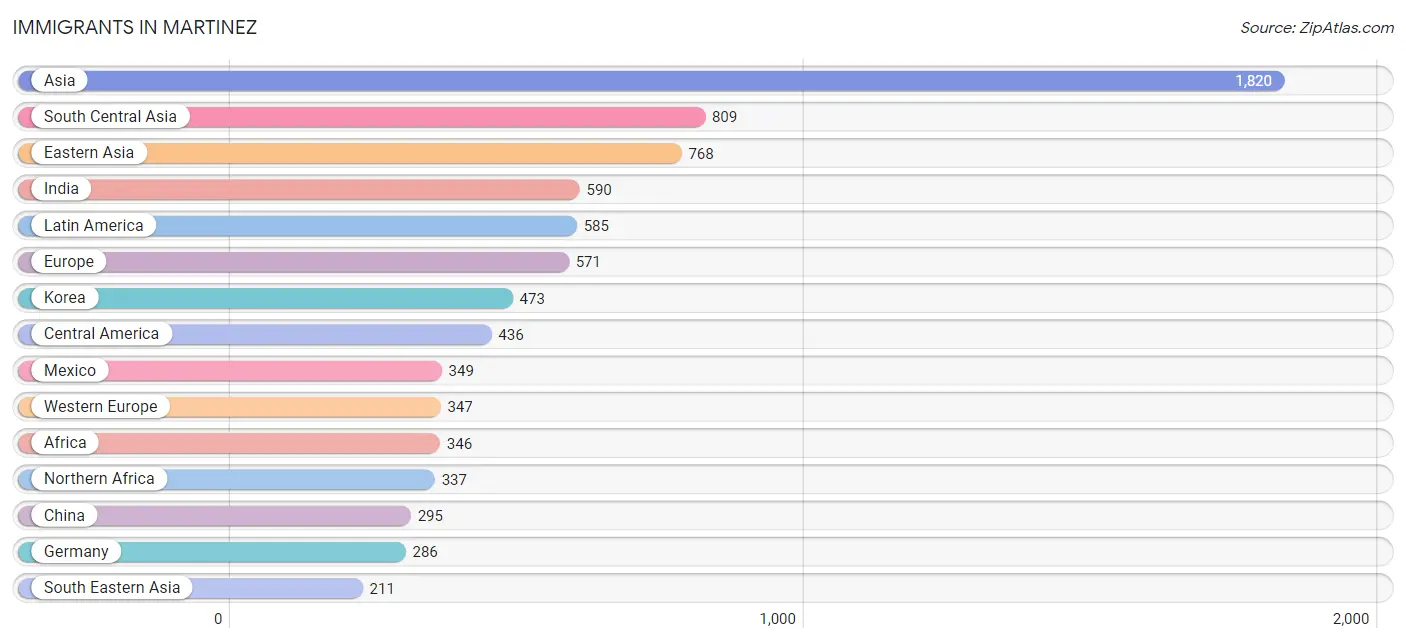
The most numerous immigrant groups reported in Martinez came from Asia (1,820 | 5.4%), South Central Asia (809 | 2.4%), Eastern Asia (768 | 2.3%), India (590 | 1.8%), and Latin America (585 | 1.7%), together accounting for 13.5% of all Martinez residents.
| Immigration Origin | # Population | % Population |
| Afghanistan | 16 | 0.1% |
| Africa | 346 | 1.0% |
| Asia | 1,820 | 5.4% |
| Australia | 15 | 0.0% |
| Austria | 20 | 0.1% |
| Bangladesh | 92 | 0.3% |
| Bosnia and Herzegovina | 10 | 0.0% |
| Canada | 144 | 0.4% |
| Caribbean | 75 | 0.2% |
| Central America | 436 | 1.3% |
| China | 295 | 0.9% |
| Colombia | 43 | 0.1% |
| Cuba | 14 | 0.0% |
| Eastern Asia | 768 | 2.3% |
| Eastern Europe | 176 | 0.5% |
| Egypt | 197 | 0.6% |
| England | 15 | 0.0% |
| Europe | 571 | 1.7% |
| France | 41 | 0.1% |
| Germany | 286 | 0.9% |
| Guatemala | 29 | 0.1% |
| Haiti | 38 | 0.1% |
| Honduras | 37 | 0.1% |
| India | 590 | 1.8% |
| Iran | 46 | 0.1% |
| Israel | 19 | 0.1% |
| Italy | 21 | 0.1% |
| Korea | 473 | 1.4% |
| Latin America | 585 | 1.7% |
| Mexico | 349 | 1.0% |
| Nigeria | 9 | 0.0% |
| Northern Africa | 337 | 1.0% |
| Northern Europe | 27 | 0.1% |
| Oceania | 15 | 0.0% |
| Pakistan | 65 | 0.2% |
| Panama | 21 | 0.1% |
| Philippines | 56 | 0.2% |
| Poland | 103 | 0.3% |
| Russia | 30 | 0.1% |
| Scotland | 12 | 0.0% |
| South America | 74 | 0.2% |
| South Central Asia | 809 | 2.4% |
| South Eastern Asia | 211 | 0.6% |
| Southern Europe | 21 | 0.1% |
| Sudan | 93 | 0.3% |
| Taiwan | 169 | 0.5% |
| Thailand | 12 | 0.0% |
| Trinidad and Tobago | 17 | 0.1% |
| Venezuela | 31 | 0.1% |
| Vietnam | 143 | 0.4% |
| Western Africa | 9 | 0.0% |
| Western Asia | 19 | 0.1% |
| Western Europe | 347 | 1.0% | View All 53 Rows |
Sex and Age in Martinez
Sex and Age in Martinez
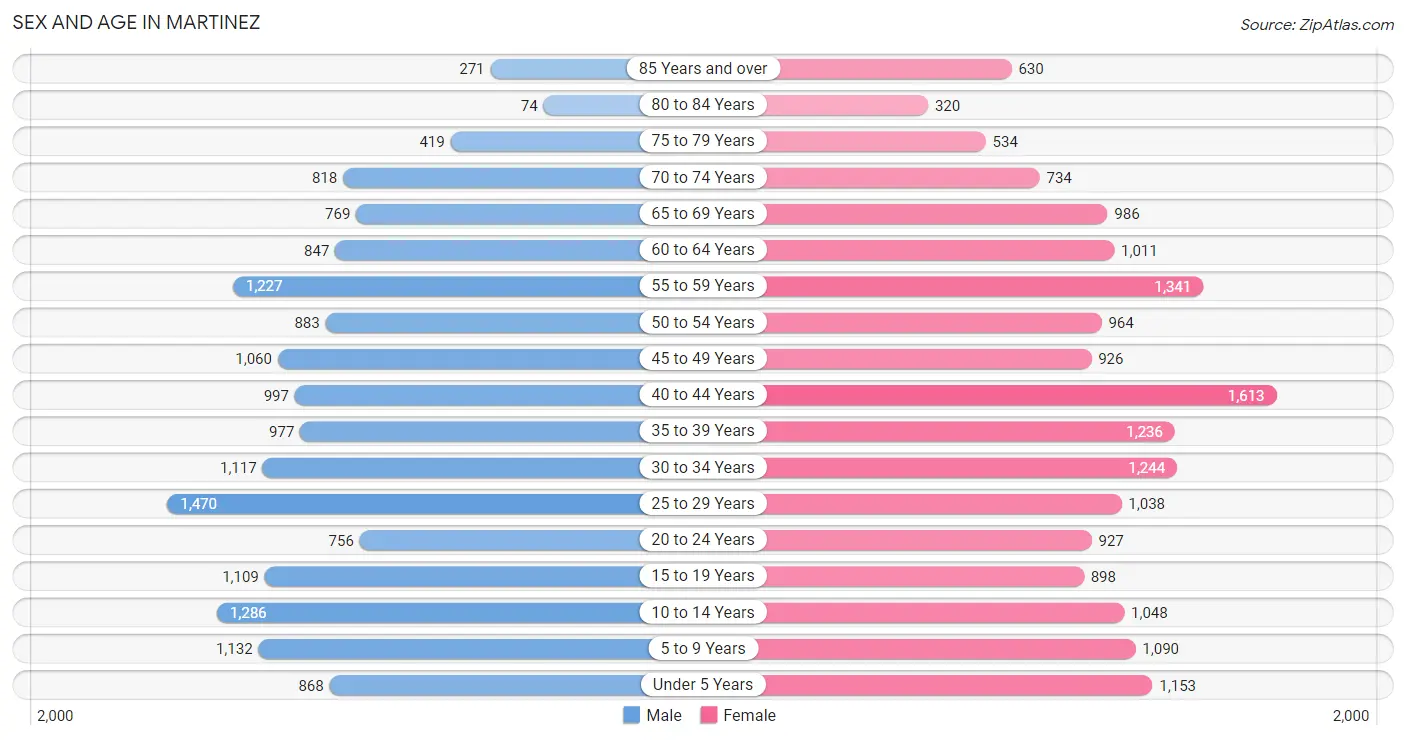
The most populous age groups in Martinez are 25 to 29 Years (1,470 | 9.1%) for men and 40 to 44 Years (1,613 | 9.1%) for women.
| Age Bracket | Male | Female |
| Under 5 Years | 868 (5.4%) | 1,153 (6.5%) |
| 5 to 9 Years | 1,132 (7.0%) | 1,090 (6.2%) |
| 10 to 14 Years | 1,286 (8.0%) | 1,048 (5.9%) |
| 15 to 19 Years | 1,109 (6.9%) | 898 (5.1%) |
| 20 to 24 Years | 756 (4.7%) | 927 (5.2%) |
| 25 to 29 Years | 1,470 (9.1%) | 1,038 (5.9%) |
| 30 to 34 Years | 1,117 (7.0%) | 1,244 (7.0%) |
| 35 to 39 Years | 977 (6.1%) | 1,236 (7.0%) |
| 40 to 44 Years | 997 (6.2%) | 1,613 (9.1%) |
| 45 to 49 Years | 1,060 (6.6%) | 926 (5.2%) |
| 50 to 54 Years | 883 (5.5%) | 964 (5.4%) |
| 55 to 59 Years | 1,227 (7.6%) | 1,341 (7.6%) |
| 60 to 64 Years | 847 (5.3%) | 1,011 (5.7%) |
| 65 to 69 Years | 769 (4.8%) | 986 (5.6%) |
| 70 to 74 Years | 818 (5.1%) | 734 (4.2%) |
| 75 to 79 Years | 419 (2.6%) | 534 (3.0%) |
| 80 to 84 Years | 74 (0.5%) | 320 (1.8%) |
| 85 Years and over | 271 (1.7%) | 630 (3.6%) |
| Total | 16,080 (100.0%) | 17,693 (100.0%) |
Families and Households in Martinez
Median Family Size in Martinez
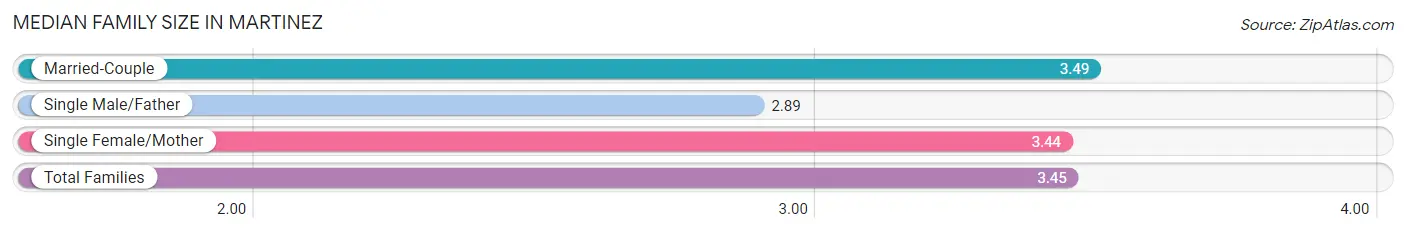
The median family size in Martinez is 3.45 persons per family, with married-couple families (6,109 | 74.1%) accounting for the largest median family size of 3.49 persons per family. On the other hand, single male/father families (419 | 5.1%) represent the smallest median family size with 2.89 persons per family.
| Family Type | # Families | Family Size |
| Married-Couple | 6,109 (74.1%) | 3.49 |
| Single Male/Father | 419 (5.1%) | 2.89 |
| Single Female/Mother | 1,714 (20.8%) | 3.44 |
| Total Families | 8,242 (100.0%) | 3.45 |
Median Household Size in Martinez
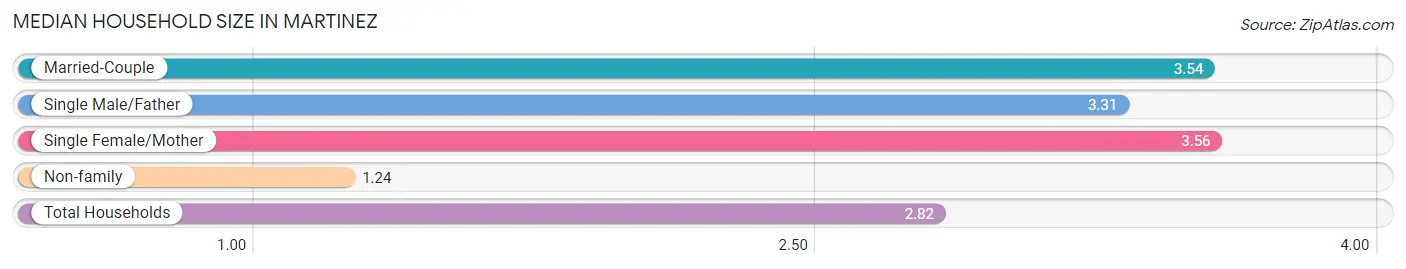
The median household size in Martinez is 2.82 persons per household, with single female/mother households (1,714 | 14.3%) accounting for the largest median household size of 3.56 persons per household. non-family households (3,726 | 31.1%) represent the smallest median household size with 1.24 persons per household.
| Household Type | # Households | Household Size |
| Married-Couple | 6,109 (51.0%) | 3.54 |
| Single Male/Father | 419 (3.5%) | 3.31 |
| Single Female/Mother | 1,714 (14.3%) | 3.56 |
| Non-family | 3,726 (31.1%) | 1.24 |
| Total Households | 11,968 (100.0%) | 2.82 |
Household Size by Marriage Status in Martinez
Out of a total of 11,968 households in Martinez, 8,242 (68.9%) are family households, while 3,726 (31.1%) are nonfamily households. The most numerous type of family households are 2-person households, comprising 3,611, and the most common type of nonfamily households are 1-person households, comprising 3,279.
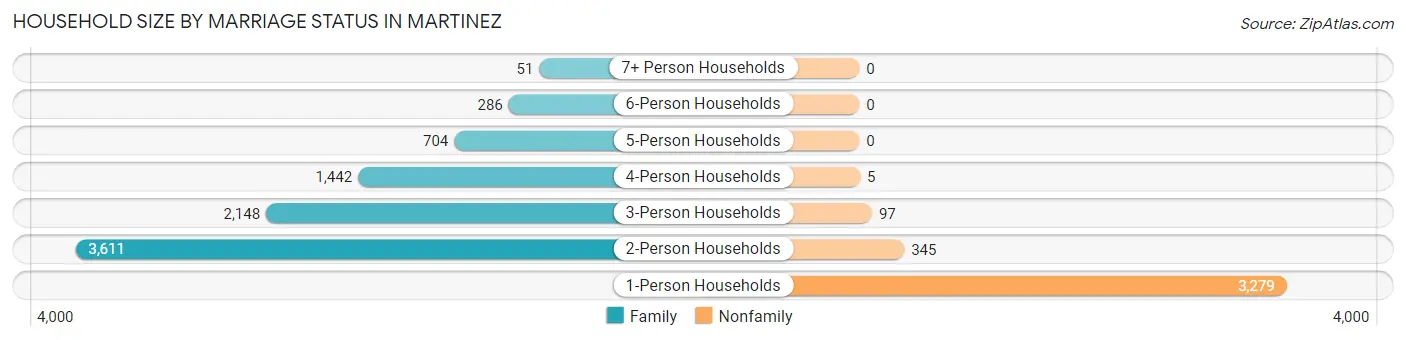
| Household Size | Family Households | Nonfamily Households |
| 1-Person Households | - | 3,279 (27.4%) |
| 2-Person Households | 3,611 (30.2%) | 345 (2.9%) |
| 3-Person Households | 2,148 (17.9%) | 97 (0.8%) |
| 4-Person Households | 1,442 (12.0%) | 5 (0.0%) |
| 5-Person Households | 704 (5.9%) | 0 (0.0%) |
| 6-Person Households | 286 (2.4%) | 0 (0.0%) |
| 7+ Person Households | 51 (0.4%) | 0 (0.0%) |
| Total | 8,242 (68.9%) | 3,726 (31.1%) |
Female Fertility in Martinez
Fertility by Age in Martinez
Average fertility rate in Martinez is 45.0 births per 1,000 women. Women in the age bracket of 20 to 34 years have the highest fertility rate with 69.0 births per 1,000 women. Women in the age bracket of 20 to 34 years acount for 61.6% of all women with births.
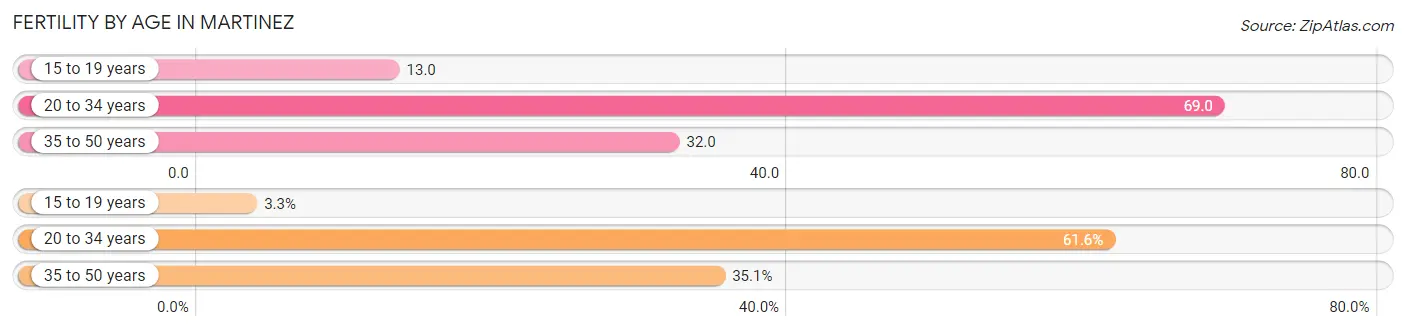
| Age Bracket | Women with Births | Births / 1,000 Women |
| 15 to 19 years | 12 (3.3%) | 13.0 |
| 20 to 34 years | 221 (61.6%) | 69.0 |
| 35 to 50 years | 126 (35.1%) | 32.0 |
| Total | 359 (100.0%) | 45.0 |
Fertility by Age by Marriage Status in Martinez
56.8% of women with births (359) in Martinez are married. The highest percentage of unmarried women with births falls into 15 to 19 years age bracket with 100.0% of them unmarried at the time of birth, while the lowest percentage of unmarried women with births belong to 35 to 50 years age bracket with 35.7% of them unmarried.
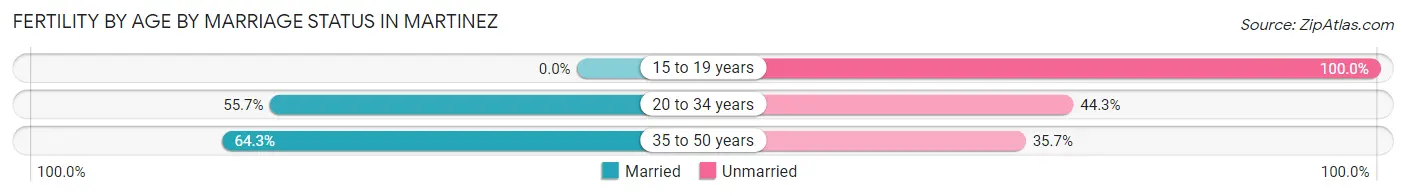
| Age Bracket | Married | Unmarried |
| 15 to 19 years | 0 (0.0%) | 12 (100.0%) |
| 20 to 34 years | 123 (55.7%) | 98 (44.3%) |
| 35 to 50 years | 81 (64.3%) | 45 (35.7%) |
| Total | 204 (56.8%) | 155 (43.2%) |
Fertility by Education in Martinez
Average fertility rate in Martinez is 45.0 births per 1,000 women. Women with the education attainment of graduate degree have the highest fertility rate of 89.0 births per 1,000 women, while women with the education attainment of high school diploma have the lowest fertility at 12.0 births per 1,000 women. Women with the education attainment of college or associate's degree represent 32.9% of all women with births.
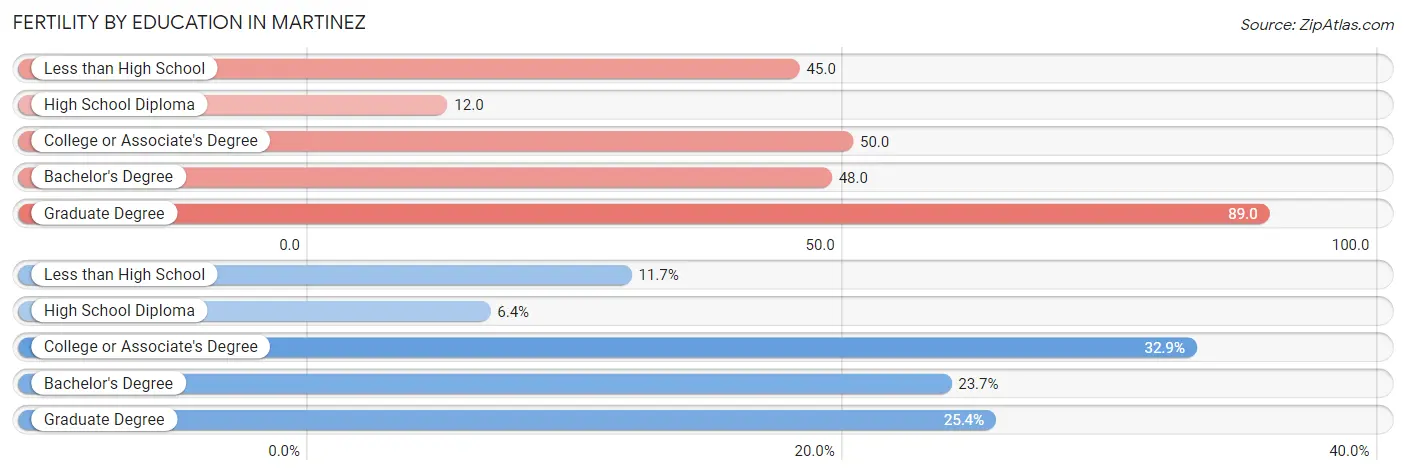
| Educational Attainment | Women with Births | Births / 1,000 Women |
| Less than High School | 42 (11.7%) | 45.0 |
| High School Diploma | 23 (6.4%) | 12.0 |
| College or Associate's Degree | 118 (32.9%) | 50.0 |
| Bachelor's Degree | 85 (23.7%) | 48.0 |
| Graduate Degree | 91 (25.4%) | 89.0 |
| Total | 359 (100.0%) | 45.0 |
Fertility by Education by Marriage Status in Martinez
43.2% of women with births in Martinez are unmarried. Women with the educational attainment of high school diploma are most likely to be married with 100.0% of them married at childbirth, while women with the educational attainment of less than high school are least likely to be married with 88.1% of them unmarried at childbirth.
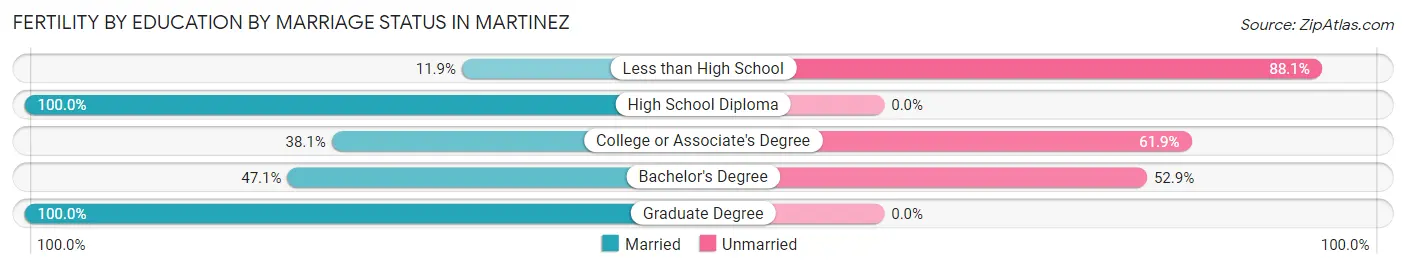
| Educational Attainment | Married | Unmarried |
| Less than High School | 5 (11.9%) | 37 (88.1%) |
| High School Diploma | 23 (100.0%) | 0 (0.0%) |
| College or Associate's Degree | 45 (38.1%) | 73 (61.9%) |
| Bachelor's Degree | 40 (47.1%) | 45 (52.9%) |
| Graduate Degree | 91 (100.0%) | 0 (0.0%) |
| Total | 204 (56.8%) | 155 (43.2%) |
Employment Characteristics in Martinez
Employment by Class of Employer in Martinez
Among the 16,254 employed individuals in Martinez, private company employees (10,364 | 63.8%), local government employees (1,372 | 8.4%), and federal government employees (1,173 | 7.2%) make up the most common classes of employment.
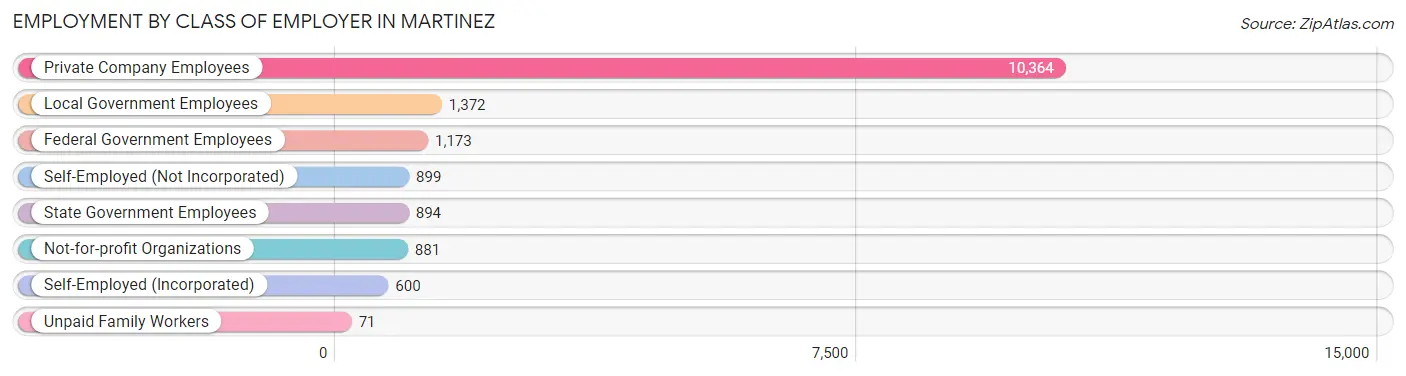
| Employer Class | # Employees | % Employees |
| Private Company Employees | 10,364 | 63.8% |
| Self-Employed (Incorporated) | 600 | 3.7% |
| Self-Employed (Not Incorporated) | 899 | 5.5% |
| Not-for-profit Organizations | 881 | 5.4% |
| Local Government Employees | 1,372 | 8.4% |
| State Government Employees | 894 | 5.5% |
| Federal Government Employees | 1,173 | 7.2% |
| Unpaid Family Workers | 71 | 0.4% |
| Total | 16,254 | 100.0% |
Employment Status by Age in Martinez
According to the labor force statistics for Martinez, out of the total population over 16 years of age (26,836), 63.4% or 17,014 individuals are in the labor force, with 3.9% or 664 of them unemployed. The age group with the highest labor force participation rate is 25 to 29 years, with 93.6% or 2,347 individuals in the labor force. Within the labor force, the 16 to 19 years age range has the highest percentage of unemployed individuals, with 12.0% or 87 of them being unemployed.
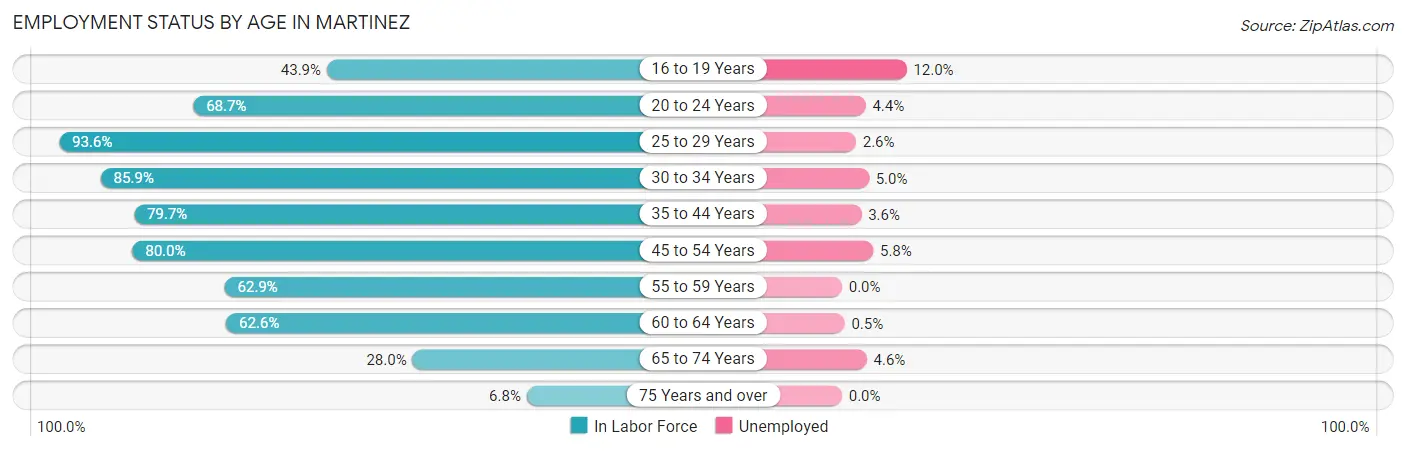
| Age Bracket | In Labor Force | Unemployed |
| 16 to 19 Years | 723 (43.9%) | 87 (12.0%) |
| 20 to 24 Years | 1,156 (68.7%) | 51 (4.4%) |
| 25 to 29 Years | 2,347 (93.6%) | 61 (2.6%) |
| 30 to 34 Years | 2,028 (85.9%) | 101 (5.0%) |
| 35 to 44 Years | 3,844 (79.7%) | 138 (3.6%) |
| 45 to 54 Years | 3,066 (80.0%) | 178 (5.8%) |
| 55 to 59 Years | 1,615 (62.9%) | 0 (0.0%) |
| 60 to 64 Years | 1,163 (62.6%) | 6 (0.5%) |
| 65 to 74 Years | 926 (28.0%) | 43 (4.6%) |
| 75 Years and over | 153 (6.8%) | 0 (0.0%) |
| Total | 17,014 (63.4%) | 664 (3.9%) |
Employment Status by Educational Attainment in Martinez
According to labor force statistics for Martinez, 78.3% of individuals (14,056) out of the total population between 25 and 64 years of age (17,951) are in the labor force, with 3.4% or 478 of them being unemployed. The group with the highest labor force participation rate are those with the educational attainment of bachelor's degree or higher, with 87.0% or 6,233 individuals in the labor force. Within the labor force, individuals with bachelor's degree or higher education have the highest percentage of unemployment, with 6.0% or 374 of them being unemployed.
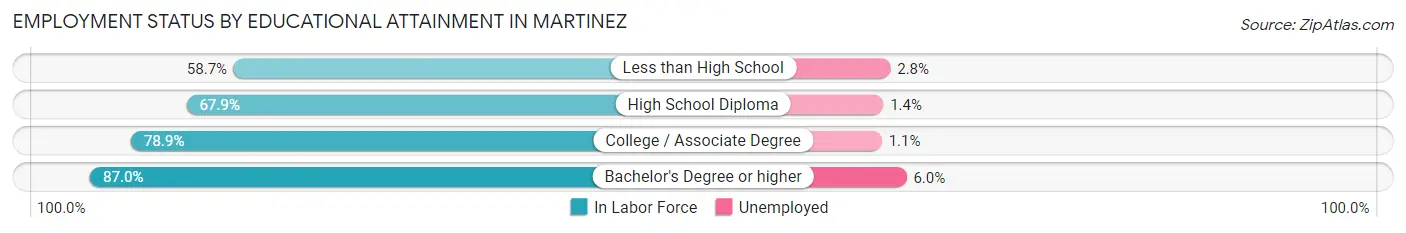
| Educational Attainment | In Labor Force | Unemployed |
| Less than High School | 668 (58.7%) | 32 (2.8%) |
| High School Diploma | 2,793 (67.9%) | 58 (1.4%) |
| College / Associate Degree | 4,368 (78.9%) | 61 (1.1%) |
| Bachelor's Degree or higher | 6,233 (87.0%) | 430 (6.0%) |
| Total | 14,056 (78.3%) | 610 (3.4%) |
Employment Occupations by Sex in Martinez
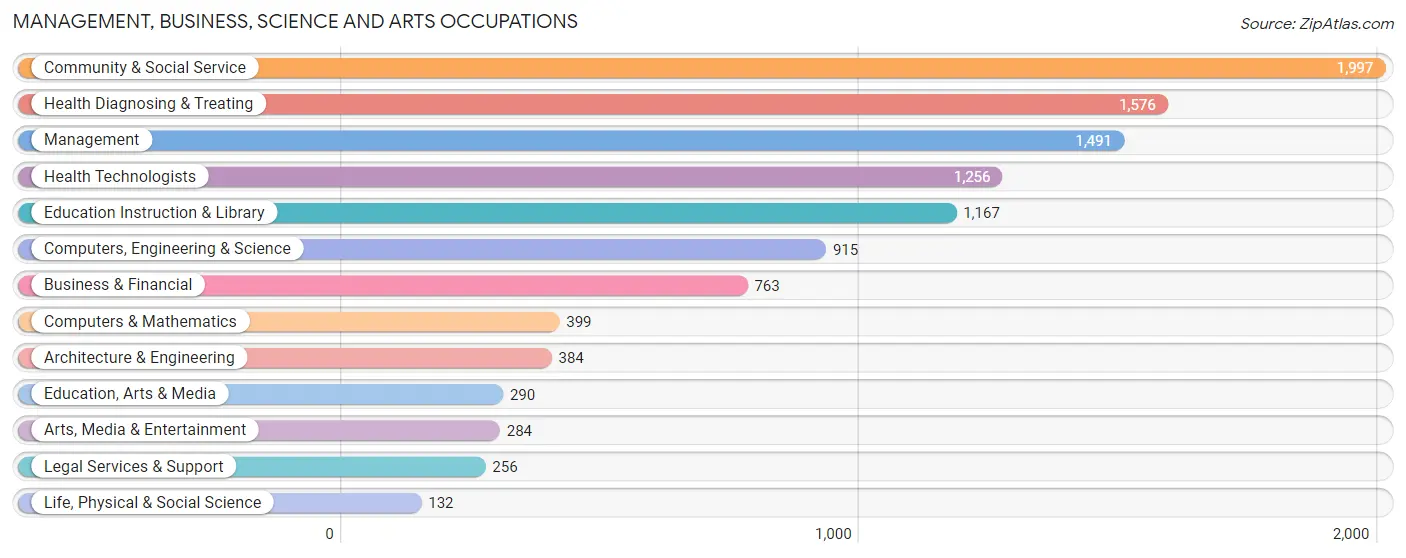
Management, Business, Science and Arts Occupations
The most common Management, Business, Science and Arts occupations in Martinez are Community & Social Service (1,997 | 12.4%), Health Diagnosing & Treating (1,576 | 9.8%), Management (1,491 | 9.2%), Health Technologists (1,256 | 7.8%), and Education Instruction & Library (1,167 | 7.2%).
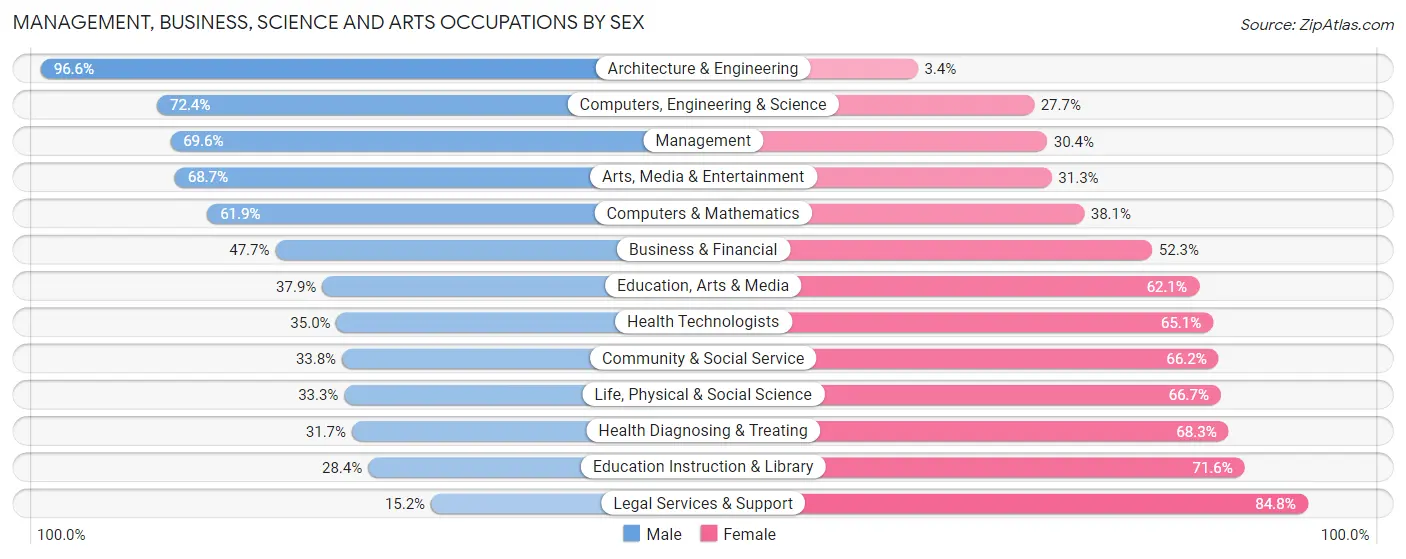
Management, Business, Science and Arts Occupations by Sex
Within the Management, Business, Science and Arts occupations in Martinez, the most male-oriented occupations are Architecture & Engineering (96.6%), Computers, Engineering & Science (72.4%), and Management (69.6%), while the most female-oriented occupations are Legal Services & Support (84.8%), Education Instruction & Library (71.6%), and Health Diagnosing & Treating (68.3%).
| Occupation | Male | Female |
| Management | 1,038 (69.6%) | 453 (30.4%) |
| Business & Financial | 364 (47.7%) | 399 (52.3%) |
| Computers, Engineering & Science | 662 (72.4%) | 253 (27.7%) |
| Computers & Mathematics | 247 (61.9%) | 152 (38.1%) |
| Architecture & Engineering | 371 (96.6%) | 13 (3.4%) |
| Life, Physical & Social Science | 44 (33.3%) | 88 (66.7%) |
| Community & Social Service | 675 (33.8%) | 1,322 (66.2%) |
| Education, Arts & Media | 110 (37.9%) | 180 (62.1%) |
| Legal Services & Support | 39 (15.2%) | 217 (84.8%) |
| Education Instruction & Library | 331 (28.4%) | 836 (71.6%) |
| Arts, Media & Entertainment | 195 (68.7%) | 89 (31.3%) |
| Health Diagnosing & Treating | 500 (31.7%) | 1,076 (68.3%) |
| Health Technologists | 439 (34.9%) | 817 (65.0%) |
| Total (Category) | 3,239 (48.0%) | 3,503 (52.0%) |
| Total (Overall) | 8,221 (51.0%) | 7,902 (49.0%) |
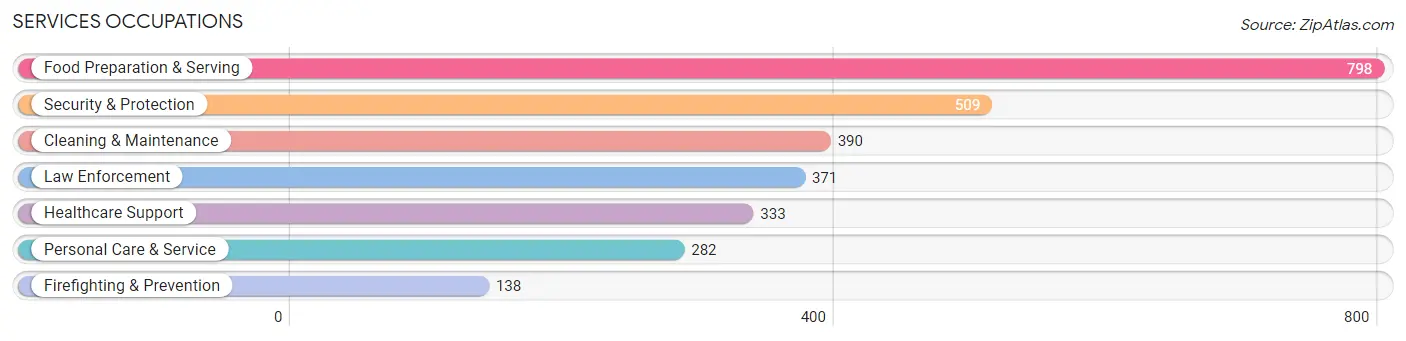
Services Occupations
The most common Services occupations in Martinez are Food Preparation & Serving (798 | 5.0%), Security & Protection (509 | 3.2%), Cleaning & Maintenance (390 | 2.4%), Law Enforcement (371 | 2.3%), and Healthcare Support (333 | 2.1%).
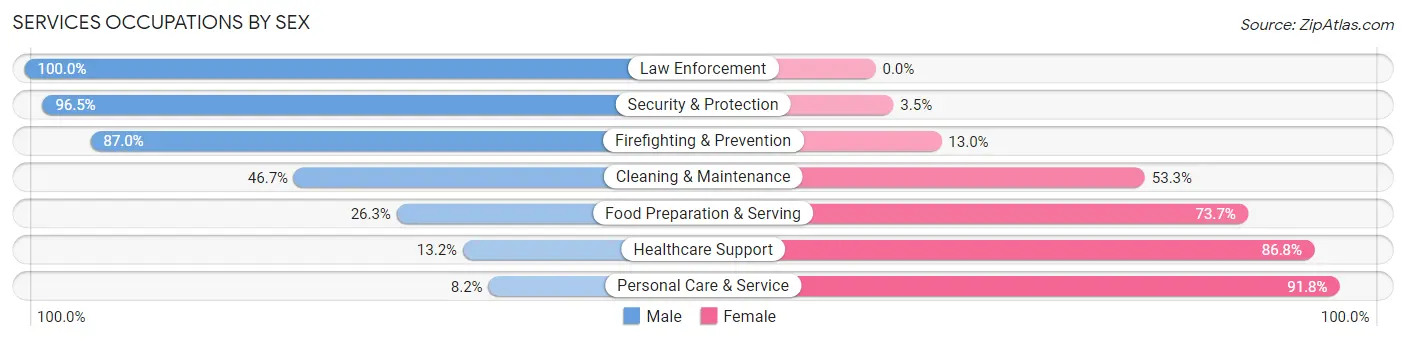
Services Occupations by Sex
Within the Services occupations in Martinez, the most male-oriented occupations are Law Enforcement (100.0%), Security & Protection (96.5%), and Firefighting & Prevention (87.0%), while the most female-oriented occupations are Personal Care & Service (91.8%), Healthcare Support (86.8%), and Food Preparation & Serving (73.7%).
| Occupation | Male | Female |
| Healthcare Support | 44 (13.2%) | 289 (86.8%) |
| Security & Protection | 491 (96.5%) | 18 (3.5%) |
| Firefighting & Prevention | 120 (87.0%) | 18 (13.0%) |
| Law Enforcement | 371 (100.0%) | 0 (0.0%) |
| Food Preparation & Serving | 210 (26.3%) | 588 (73.7%) |
| Cleaning & Maintenance | 182 (46.7%) | 208 (53.3%) |
| Personal Care & Service | 23 (8.2%) | 259 (91.8%) |
| Total (Category) | 950 (41.1%) | 1,362 (58.9%) |
| Total (Overall) | 8,221 (51.0%) | 7,902 (49.0%) |
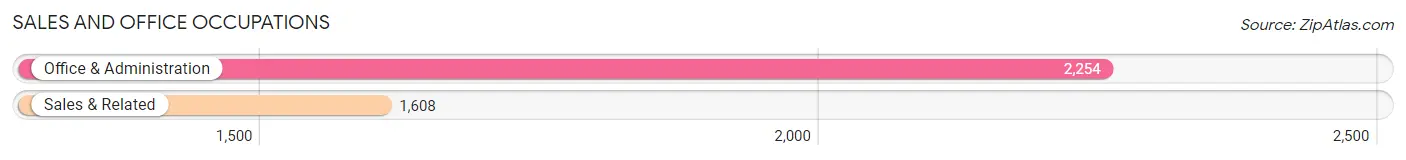
Sales and Office Occupations
The most common Sales and Office occupations in Martinez are Office & Administration (2,254 | 14.0%), and Sales & Related (1,608 | 10.0%).
Sales and Office Occupations by Sex
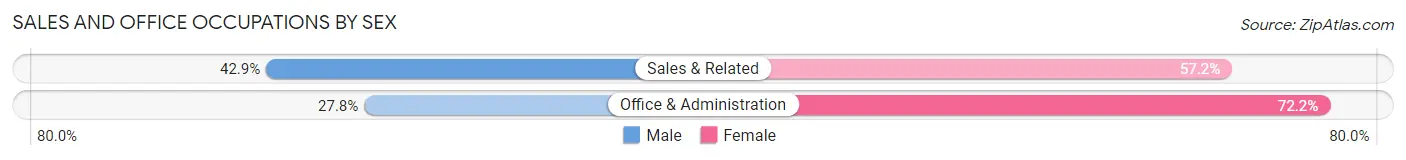
| Occupation | Male | Female |
| Sales & Related | 689 (42.8%) | 919 (57.2%) |
| Office & Administration | 626 (27.8%) | 1,628 (72.2%) |
| Total (Category) | 1,315 (34.1%) | 2,547 (65.9%) |
| Total (Overall) | 8,221 (51.0%) | 7,902 (49.0%) |
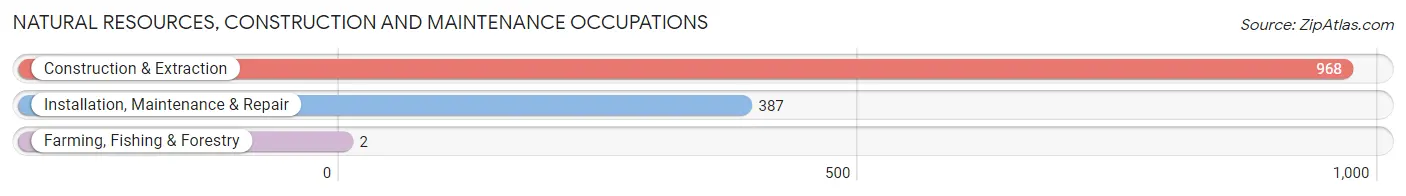
Natural Resources, Construction and Maintenance Occupations
The most common Natural Resources, Construction and Maintenance occupations in Martinez are Construction & Extraction (968 | 6.0%), Installation, Maintenance & Repair (387 | 2.4%), and Farming, Fishing & Forestry (2 | 0.0%).
Natural Resources, Construction and Maintenance Occupations by Sex
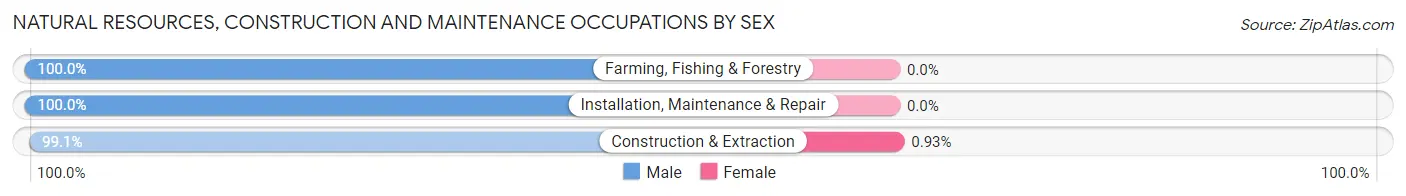
| Occupation | Male | Female |
| Farming, Fishing & Forestry | 2 (100.0%) | 0 (0.0%) |
| Construction & Extraction | 959 (99.1%) | 9 (0.9%) |
| Installation, Maintenance & Repair | 387 (100.0%) | 0 (0.0%) |
| Total (Category) | 1,348 (99.3%) | 9 (0.7%) |
| Total (Overall) | 8,221 (51.0%) | 7,902 (49.0%) |
Production, Transportation and Moving Occupations
The most common Production, Transportation and Moving occupations in Martinez are Transportation (875 | 5.4%), Production (750 | 4.6%), and Material Moving (225 | 1.4%).
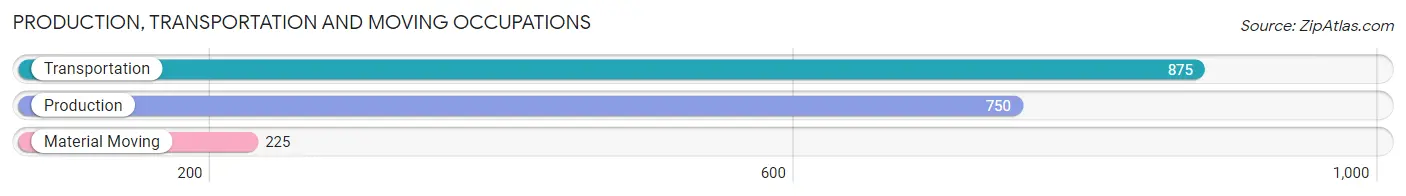
Production, Transportation and Moving Occupations by Sex
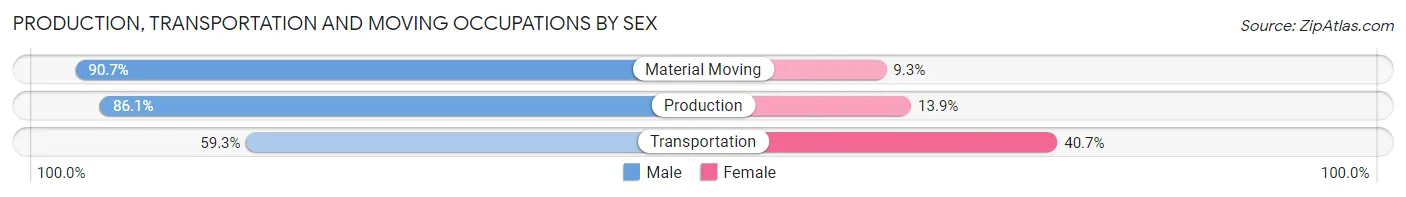
| Occupation | Male | Female |
| Production | 646 (86.1%) | 104 (13.9%) |
| Transportation | 519 (59.3%) | 356 (40.7%) |
| Material Moving | 204 (90.7%) | 21 (9.3%) |
| Total (Category) | 1,369 (74.0%) | 481 (26.0%) |
| Total (Overall) | 8,221 (51.0%) | 7,902 (49.0%) |
Employment Industries by Sex in Martinez
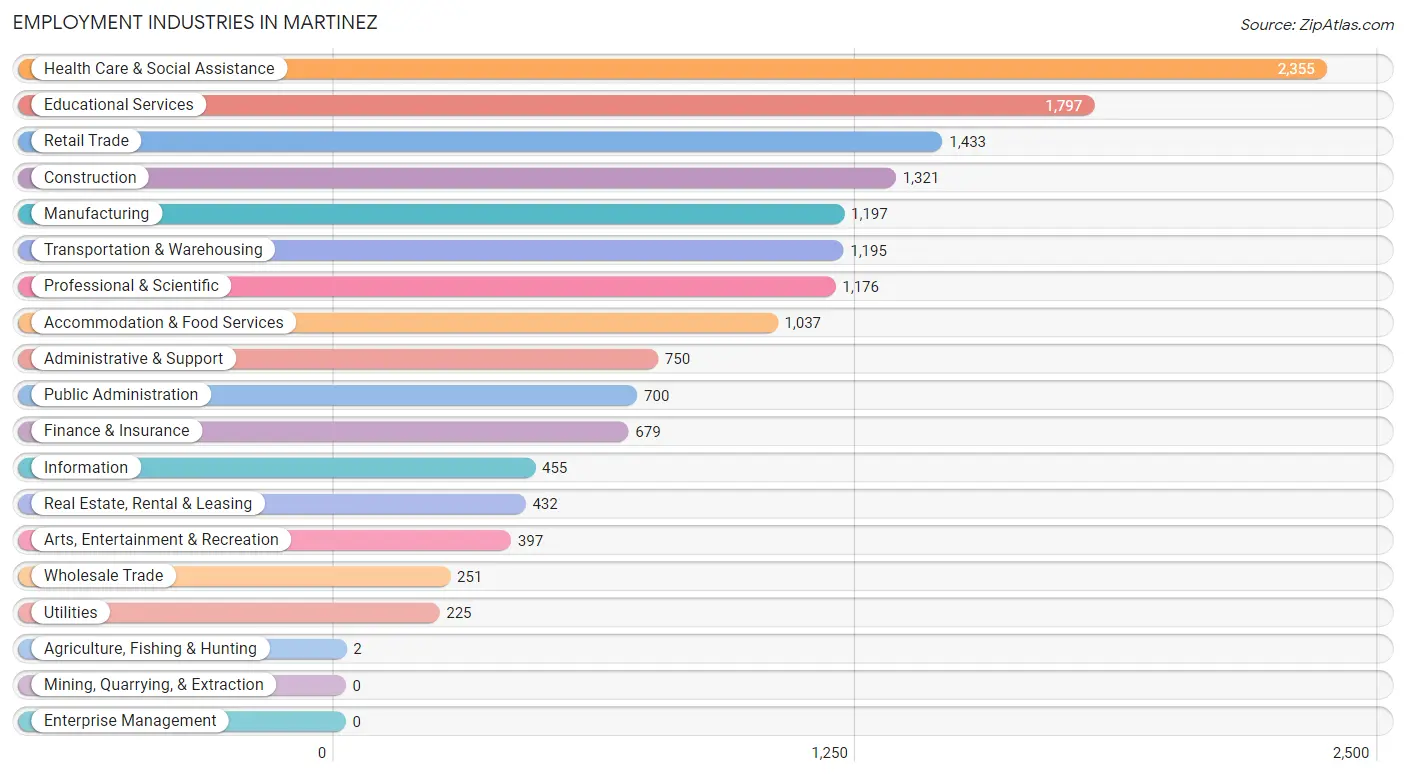
Employment Industries in Martinez
The major employment industries in Martinez include Health Care & Social Assistance (2,355 | 14.6%), Educational Services (1,797 | 11.2%), Retail Trade (1,433 | 8.9%), Construction (1,321 | 8.2%), and Manufacturing (1,197 | 7.4%).
Employment Industries by Sex in Martinez
The Martinez industries that see more men than women are Agriculture, Fishing & Hunting (100.0%), Construction (91.7%), and Utilities (86.2%), whereas the industries that tend to have a higher number of women are Arts, Entertainment & Recreation (77.3%), Health Care & Social Assistance (71.7%), and Accommodation & Food Services (66.1%).
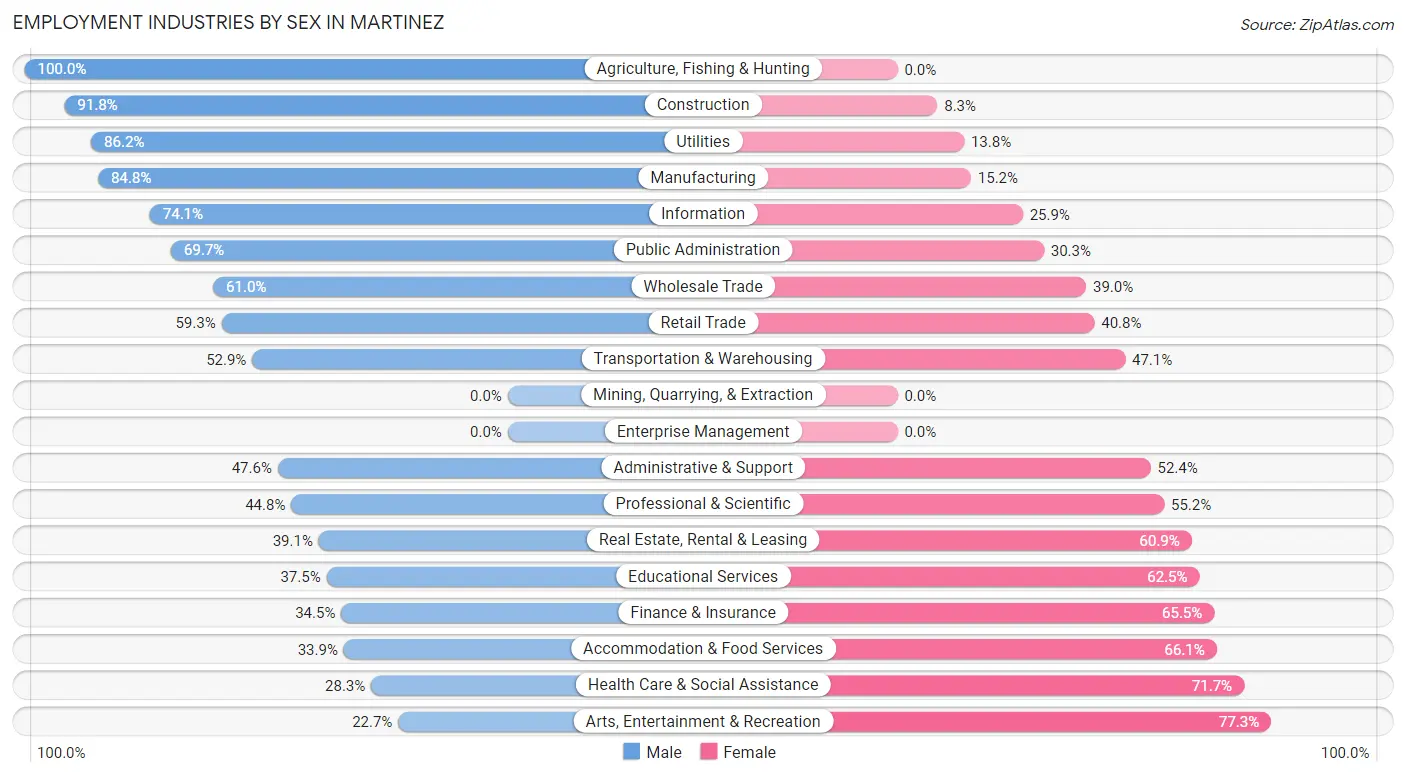
| Industry | Male | Female |
| Agriculture, Fishing & Hunting | 2 (100.0%) | 0 (0.0%) |
| Mining, Quarrying, & Extraction | 0 (0.0%) | 0 (0.0%) |
| Construction | 1,212 (91.7%) | 109 (8.3%) |
| Manufacturing | 1,015 (84.8%) | 182 (15.2%) |
| Wholesale Trade | 153 (61.0%) | 98 (39.0%) |
| Retail Trade | 849 (59.3%) | 584 (40.7%) |
| Transportation & Warehousing | 632 (52.9%) | 563 (47.1%) |
| Utilities | 194 (86.2%) | 31 (13.8%) |
| Information | 337 (74.1%) | 118 (25.9%) |
| Finance & Insurance | 234 (34.5%) | 445 (65.5%) |
| Real Estate, Rental & Leasing | 169 (39.1%) | 263 (60.9%) |
| Professional & Scientific | 527 (44.8%) | 649 (55.2%) |
| Enterprise Management | 0 (0.0%) | 0 (0.0%) |
| Administrative & Support | 357 (47.6%) | 393 (52.4%) |
| Educational Services | 674 (37.5%) | 1,123 (62.5%) |
| Health Care & Social Assistance | 666 (28.3%) | 1,689 (71.7%) |
| Arts, Entertainment & Recreation | 90 (22.7%) | 307 (77.3%) |
| Accommodation & Food Services | 352 (33.9%) | 685 (66.1%) |
| Public Administration | 488 (69.7%) | 212 (30.3%) |
| Total | 8,221 (51.0%) | 7,902 (49.0%) |
Education in Martinez
School Enrollment in Martinez
The most common levels of schooling among the 8,613 students in Martinez are elementary school (1,947 | 22.6%), middle school (1,810 | 21.0%), and high school (1,745 | 20.3%).
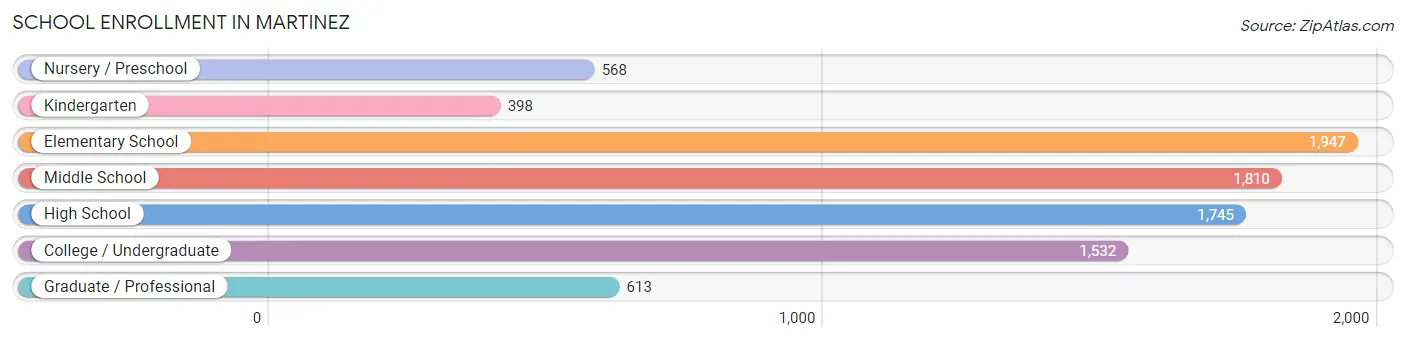
| School Level | # Students | % Students |
| Nursery / Preschool | 568 | 6.6% |
| Kindergarten | 398 | 4.6% |
| Elementary School | 1,947 | 22.6% |
| Middle School | 1,810 | 21.0% |
| High School | 1,745 | 20.3% |
| College / Undergraduate | 1,532 | 17.8% |
| Graduate / Professional | 613 | 7.1% |
| Total | 8,613 | 100.0% |
School Enrollment by Age by Funding Source in Martinez
Out of a total of 8,613 students who are enrolled in schools in Martinez, 1,206 (14.0%) attend a private institution, while the remaining 7,407 (86.0%) are enrolled in public schools. The age group of 35 years and over has the highest likelihood of being enrolled in private schools, with 164 (30.8% in the age bracket) enrolled. Conversely, the age group of 18 to 19 year olds has the lowest likelihood of being enrolled in a private school, with 436 (95.2% in the age bracket) attending a public institution.
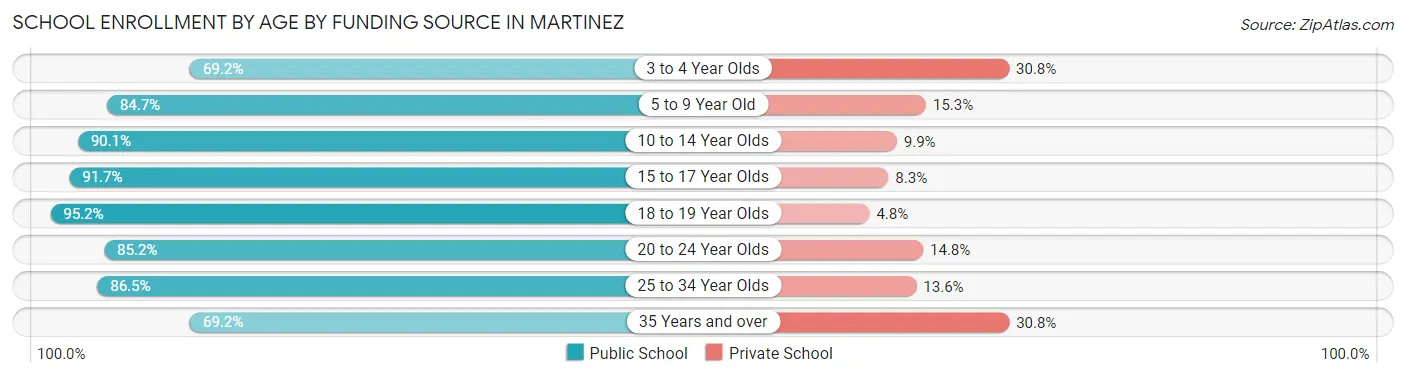
| Age Bracket | Public School | Private School |
| 3 to 4 Year Olds | 375 (69.2%) | 167 (30.8%) |
| 5 to 9 Year Old | 1,805 (84.7%) | 327 (15.3%) |
| 10 to 14 Year Olds | 2,103 (90.1%) | 231 (9.9%) |
| 15 to 17 Year Olds | 1,155 (91.7%) | 105 (8.3%) |
| 18 to 19 Year Olds | 436 (95.2%) | 22 (4.8%) |
| 20 to 24 Year Olds | 708 (85.2%) | 123 (14.8%) |
| 25 to 34 Year Olds | 453 (86.5%) | 71 (13.6%) |
| 35 Years and over | 368 (69.2%) | 164 (30.8%) |
| Total | 7,407 (86.0%) | 1,206 (14.0%) |
Educational Attainment by Field of Study in Martinez
Business (1,858 | 19.4%), science & technology (1,206 | 12.6%), education (984 | 10.3%), engineering (973 | 10.2%), and bio, nature & agricultural (950 | 9.9%) are the most common fields of study among 9,590 individuals in Martinez who have obtained a bachelor's degree or higher.
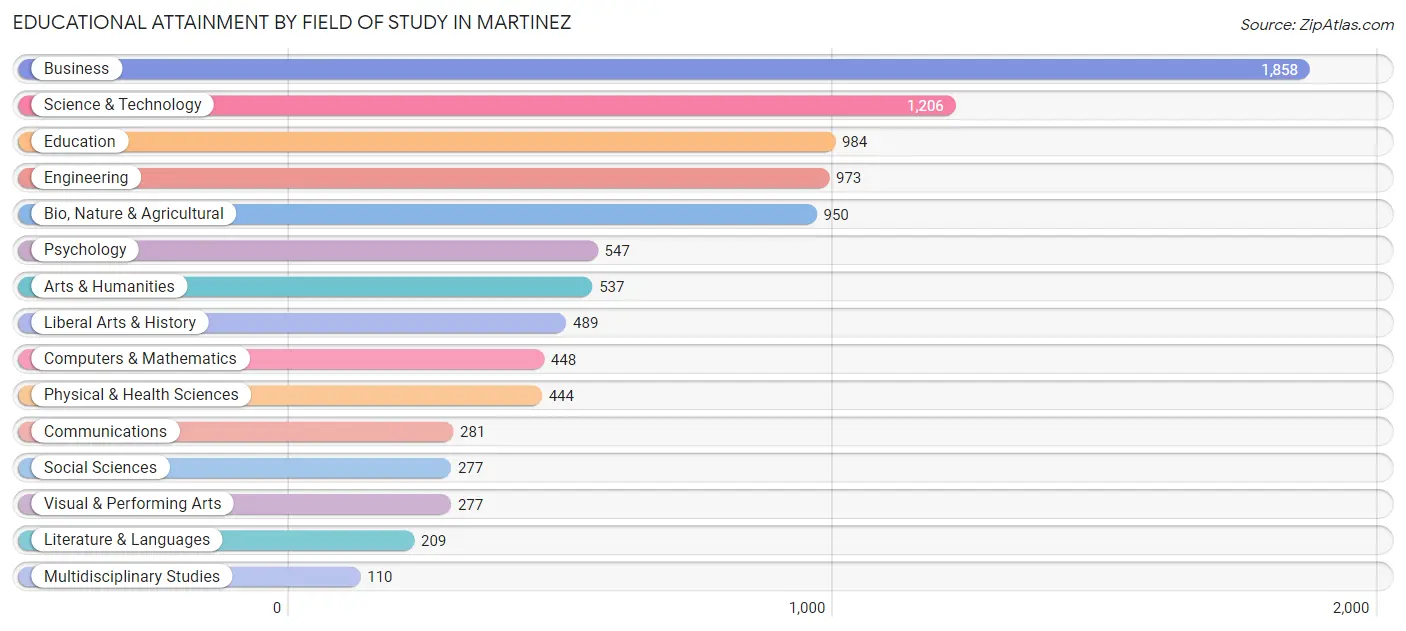
| Field of Study | # Graduates | % Graduates |
| Computers & Mathematics | 448 | 4.7% |
| Bio, Nature & Agricultural | 950 | 9.9% |
| Physical & Health Sciences | 444 | 4.6% |
| Psychology | 547 | 5.7% |
| Social Sciences | 277 | 2.9% |
| Engineering | 973 | 10.2% |
| Multidisciplinary Studies | 110 | 1.1% |
| Science & Technology | 1,206 | 12.6% |
| Business | 1,858 | 19.4% |
| Education | 984 | 10.3% |
| Literature & Languages | 209 | 2.2% |
| Liberal Arts & History | 489 | 5.1% |
| Visual & Performing Arts | 277 | 2.9% |
| Communications | 281 | 2.9% |
| Arts & Humanities | 537 | 5.6% |
| Total | 9,590 | 100.0% |
Transportation & Commute in Martinez
Vehicle Availability by Sex in Martinez
The most prevalent vehicle ownership categories in Martinez are males with 2 vehicles (3,582, accounting for 42.6%) and females with 2 vehicles (2,586, making up 45.8%).
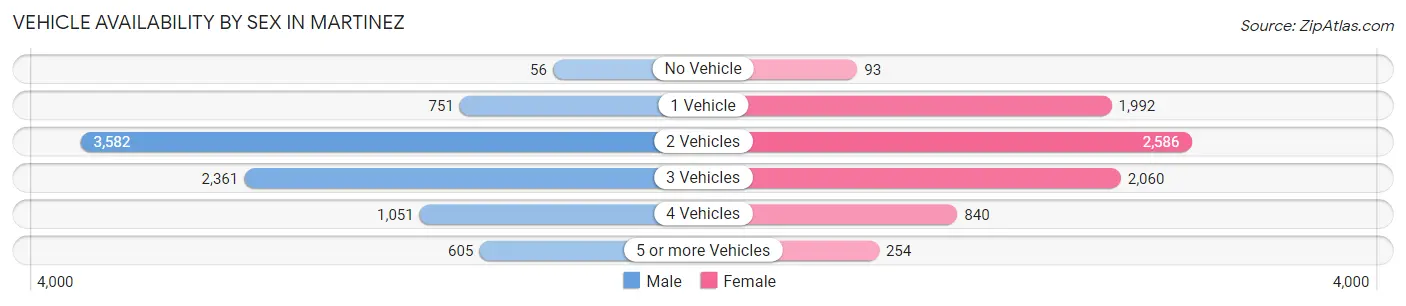
| Vehicles Available | Male | Female |
| No Vehicle | 56 (0.7%) | 93 (1.2%) |
| 1 Vehicle | 751 (8.9%) | 1,992 (25.5%) |
| 2 Vehicles | 3,582 (42.6%) | 2,586 (33.1%) |
| 3 Vehicles | 2,361 (28.1%) | 2,060 (26.3%) |
| 4 Vehicles | 1,051 (12.5%) | 840 (10.7%) |
| 5 or more Vehicles | 605 (7.2%) | 254 (3.3%) |
| Total | 8,406 (100.0%) | 7,825 (100.0%) |
Commute Time in Martinez
The most frequently occuring commute durations in Martinez are 15 to 19 minutes (3,332 commuters, 21.9%), 20 to 24 minutes (3,003 commuters, 19.8%), and 10 to 14 minutes (2,984 commuters, 19.6%).
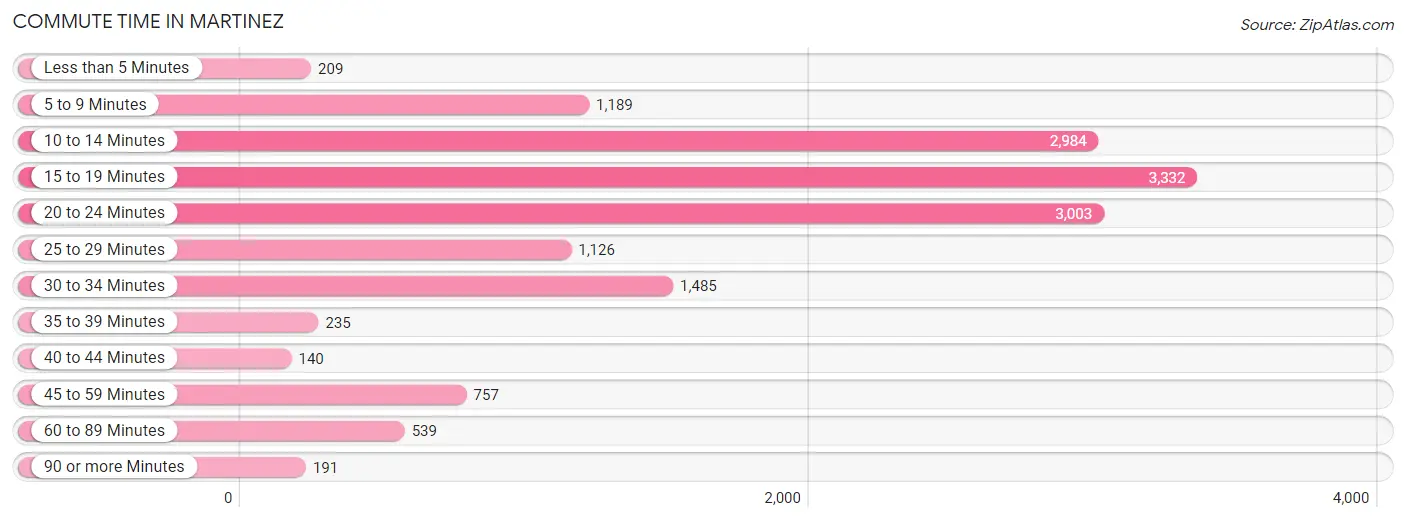
| Commute Time | # Commuters | % Commuters |
| Less than 5 Minutes | 209 | 1.4% |
| 5 to 9 Minutes | 1,189 | 7.8% |
| 10 to 14 Minutes | 2,984 | 19.6% |
| 15 to 19 Minutes | 3,332 | 21.9% |
| 20 to 24 Minutes | 3,003 | 19.8% |
| 25 to 29 Minutes | 1,126 | 7.4% |
| 30 to 34 Minutes | 1,485 | 9.8% |
| 35 to 39 Minutes | 235 | 1.5% |
| 40 to 44 Minutes | 140 | 0.9% |
| 45 to 59 Minutes | 757 | 5.0% |
| 60 to 89 Minutes | 539 | 3.5% |
| 90 or more Minutes | 191 | 1.3% |
Commute Time by Sex in Martinez
The most common commute times in Martinez are 15 to 19 minutes (1,673 commuters, 20.8%) for males and 15 to 19 minutes (1,659 commuters, 23.2%) for females.
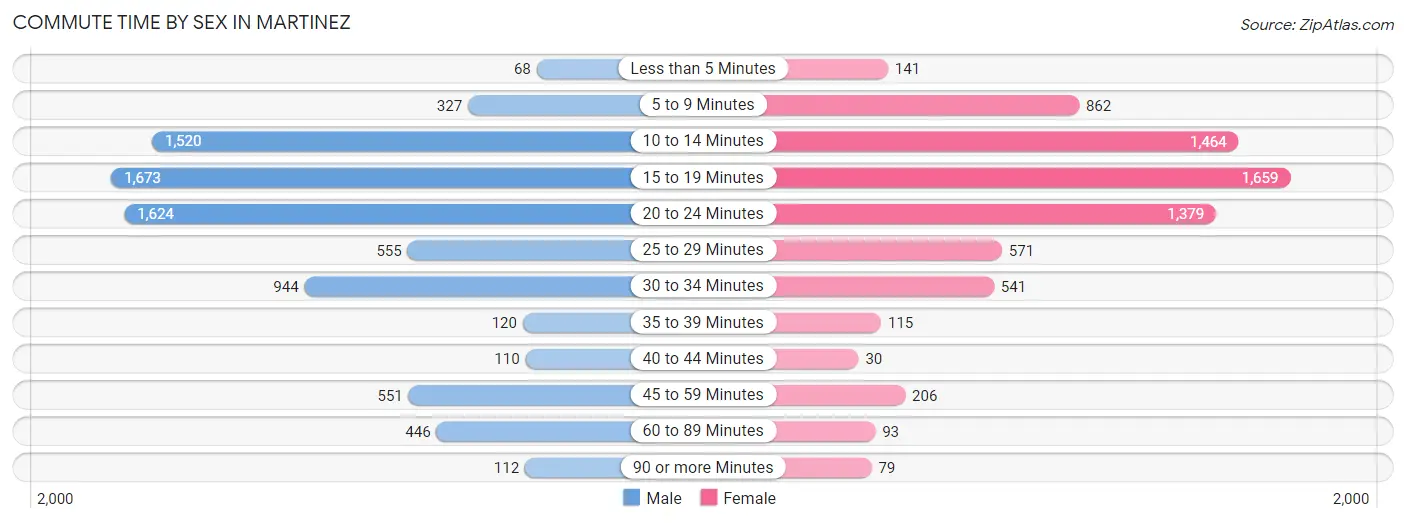
| Commute Time | Male | Female |
| Less than 5 Minutes | 68 (0.8%) | 141 (2.0%) |
| 5 to 9 Minutes | 327 (4.1%) | 862 (12.1%) |
| 10 to 14 Minutes | 1,520 (18.9%) | 1,464 (20.5%) |
| 15 to 19 Minutes | 1,673 (20.8%) | 1,659 (23.2%) |
| 20 to 24 Minutes | 1,624 (20.2%) | 1,379 (19.3%) |
| 25 to 29 Minutes | 555 (6.9%) | 571 (8.0%) |
| 30 to 34 Minutes | 944 (11.7%) | 541 (7.6%) |
| 35 to 39 Minutes | 120 (1.5%) | 115 (1.6%) |
| 40 to 44 Minutes | 110 (1.4%) | 30 (0.4%) |
| 45 to 59 Minutes | 551 (6.8%) | 206 (2.9%) |
| 60 to 89 Minutes | 446 (5.5%) | 93 (1.3%) |
| 90 or more Minutes | 112 (1.4%) | 79 (1.1%) |
Time of Departure to Work by Sex in Martinez
The most frequent times of departure to work in Martinez are 8:00 AM to 8:29 AM (1,686, 20.9%) for males and 7:00 AM to 7:29 AM (1,526, 21.4%) for females.
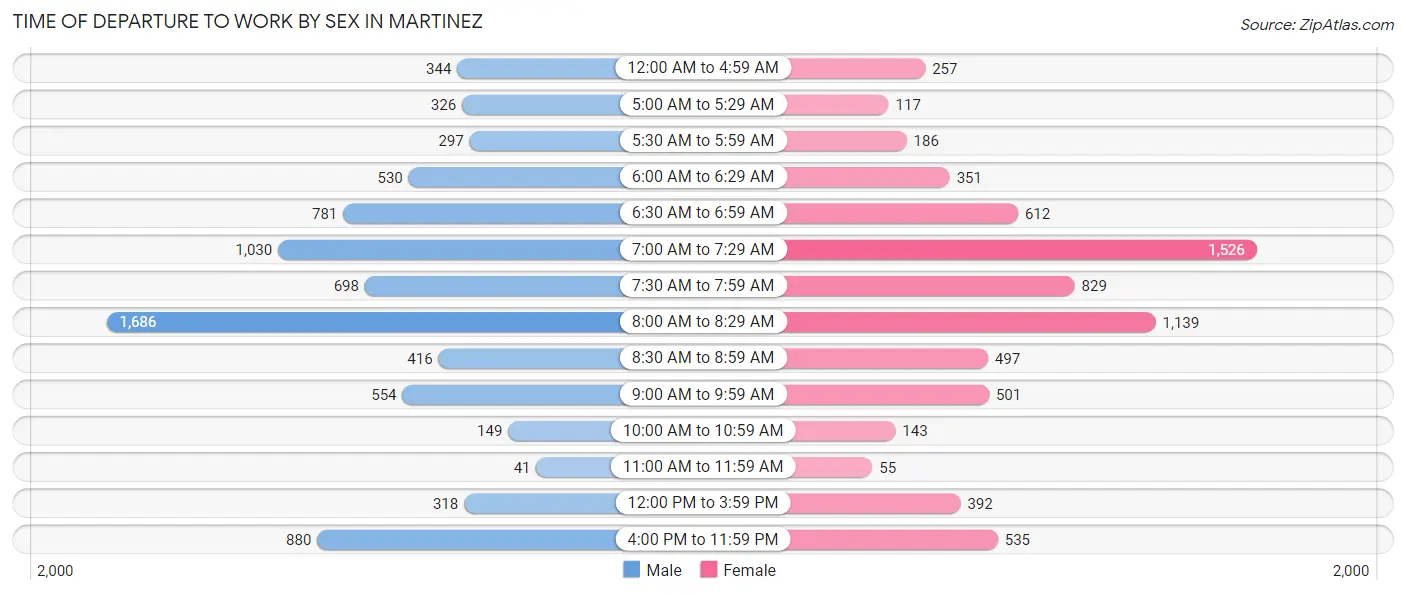
| Time of Departure | Male | Female |
| 12:00 AM to 4:59 AM | 344 (4.3%) | 257 (3.6%) |
| 5:00 AM to 5:29 AM | 326 (4.1%) | 117 (1.6%) |
| 5:30 AM to 5:59 AM | 297 (3.7%) | 186 (2.6%) |
| 6:00 AM to 6:29 AM | 530 (6.6%) | 351 (4.9%) |
| 6:30 AM to 6:59 AM | 781 (9.7%) | 612 (8.6%) |
| 7:00 AM to 7:29 AM | 1,030 (12.8%) | 1,526 (21.4%) |
| 7:30 AM to 7:59 AM | 698 (8.7%) | 829 (11.6%) |
| 8:00 AM to 8:29 AM | 1,686 (20.9%) | 1,139 (16.0%) |
| 8:30 AM to 8:59 AM | 416 (5.2%) | 497 (7.0%) |
| 9:00 AM to 9:59 AM | 554 (6.9%) | 501 (7.0%) |
| 10:00 AM to 10:59 AM | 149 (1.8%) | 143 (2.0%) |
| 11:00 AM to 11:59 AM | 41 (0.5%) | 55 (0.8%) |
| 12:00 PM to 3:59 PM | 318 (4.0%) | 392 (5.5%) |
| 4:00 PM to 11:59 PM | 880 (10.9%) | 535 (7.5%) |
| Total | 8,050 (100.0%) | 7,140 (100.0%) |
Housing Occupancy in Martinez
Occupancy by Ownership in Martinez
Of the total 11,968 dwellings in Martinez, owner-occupied units account for 8,690 (72.6%), while renter-occupied units make up 3,278 (27.4%).
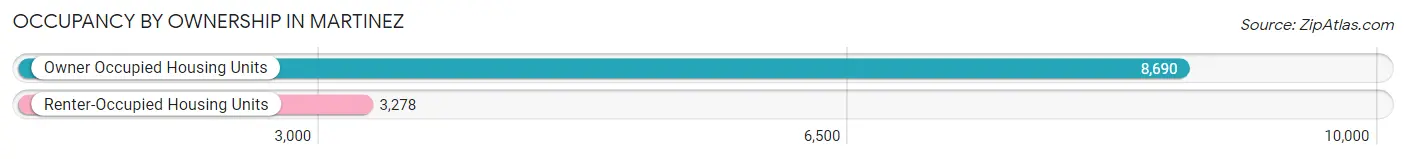
| Occupancy | # Housing Units | % Housing Units |
| Owner Occupied Housing Units | 8,690 | 72.6% |
| Renter-Occupied Housing Units | 3,278 | 27.4% |
| Total Occupied Housing Units | 11,968 | 100.0% |
Occupancy by Household Size in Martinez
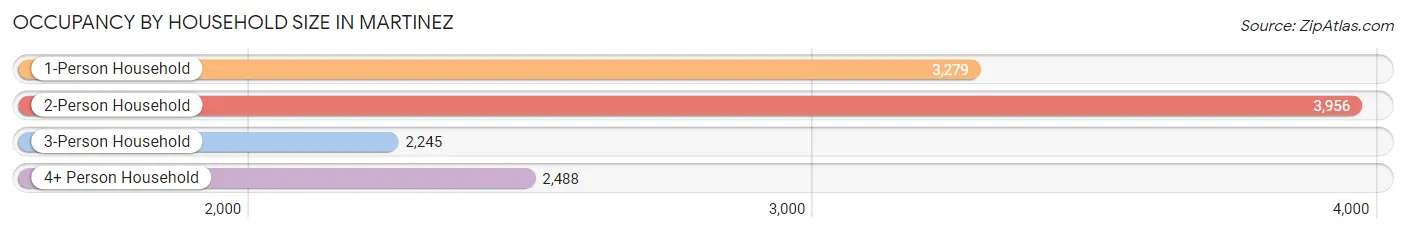
| Household Size | # Housing Units | % Housing Units |
| 1-Person Household | 3,279 | 27.4% |
| 2-Person Household | 3,956 | 33.1% |
| 3-Person Household | 2,245 | 18.8% |
| 4+ Person Household | 2,488 | 20.8% |
| Total Housing Units | 11,968 | 100.0% |
Occupancy by Ownership by Household Size in Martinez
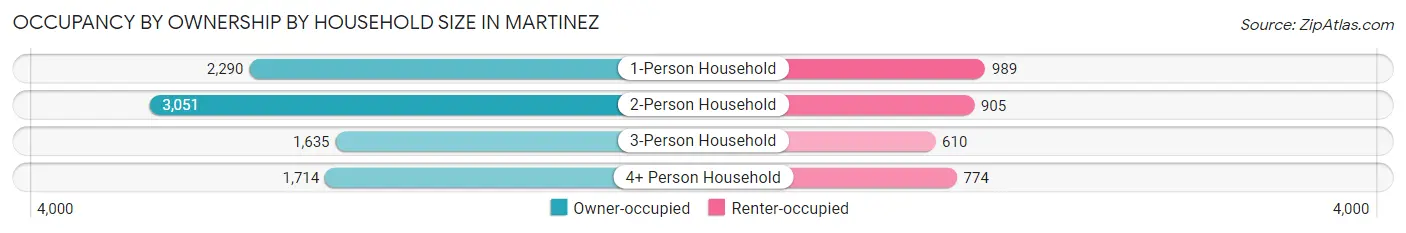
| Household Size | Owner-occupied | Renter-occupied |
| 1-Person Household | 2,290 (69.8%) | 989 (30.2%) |
| 2-Person Household | 3,051 (77.1%) | 905 (22.9%) |
| 3-Person Household | 1,635 (72.8%) | 610 (27.2%) |
| 4+ Person Household | 1,714 (68.9%) | 774 (31.1%) |
| Total Housing Units | 8,690 (72.6%) | 3,278 (27.4%) |
Occupancy by Educational Attainment in Martinez
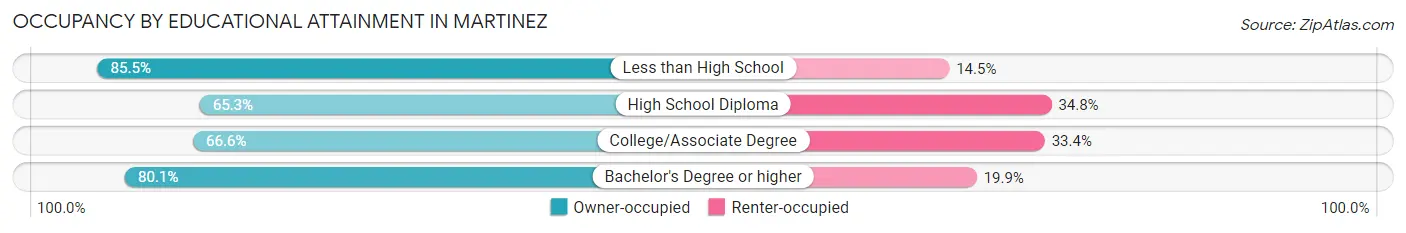
| Household Size | Owner-occupied | Renter-occupied |
| Less than High School | 537 (85.5%) | 91 (14.5%) |
| High School Diploma | 1,810 (65.2%) | 964 (34.7%) |
| College/Associate Degree | 2,546 (66.6%) | 1,278 (33.4%) |
| Bachelor's Degree or higher | 3,797 (80.1%) | 945 (19.9%) |
Occupancy by Age of Householder in Martinez
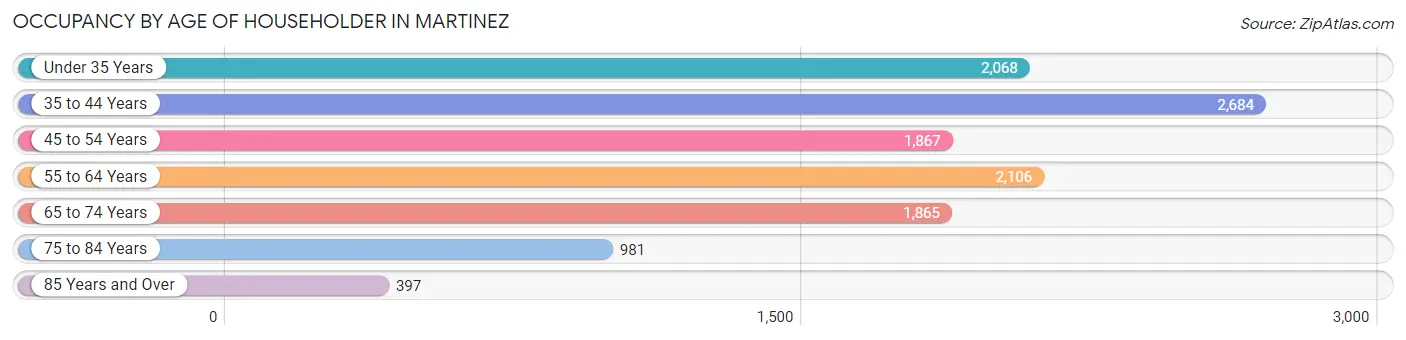
| Age Bracket | # Households | % Households |
| Under 35 Years | 2,068 | 17.3% |
| 35 to 44 Years | 2,684 | 22.4% |
| 45 to 54 Years | 1,867 | 15.6% |
| 55 to 64 Years | 2,106 | 17.6% |
| 65 to 74 Years | 1,865 | 15.6% |
| 75 to 84 Years | 981 | 8.2% |
| 85 Years and Over | 397 | 3.3% |
| Total | 11,968 | 100.0% |
Housing Finances in Martinez
Median Income by Occupancy in Martinez
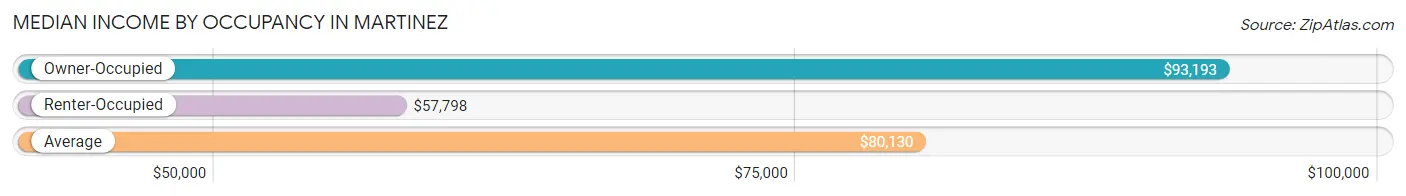
| Occupancy Type | # Households | Median Income |
| Owner-Occupied | 8,690 (72.6%) | $93,193 |
| Renter-Occupied | 3,278 (27.4%) | $57,798 |
| Average | 11,968 (100.0%) | $80,130 |
Occupancy by Householder Income Bracket in Martinez
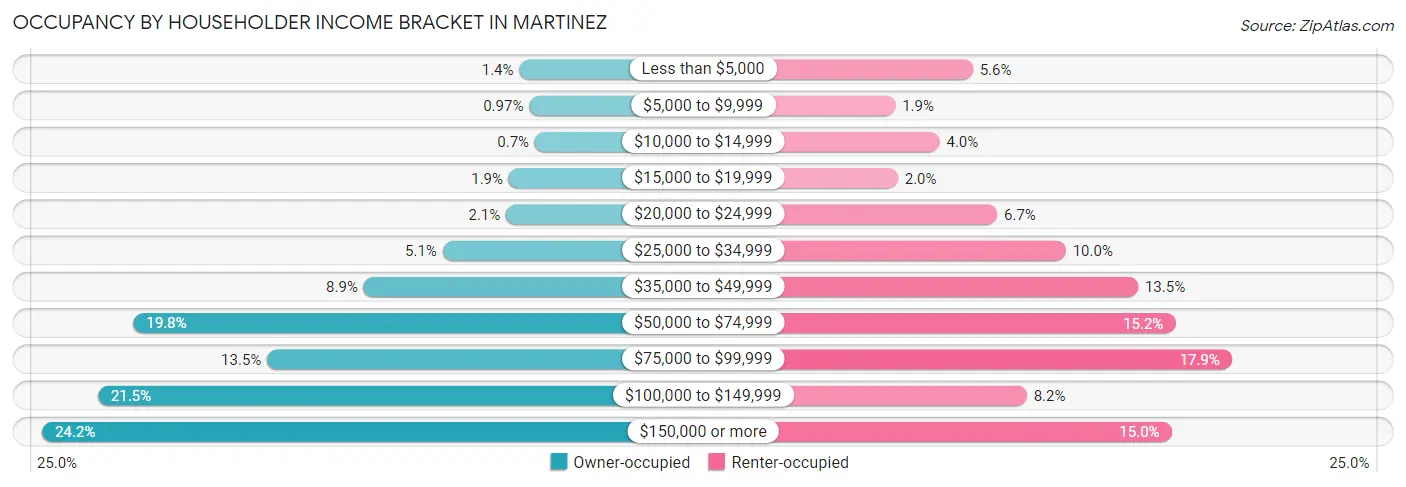
| Income Bracket | Owner-occupied | Renter-occupied |
| Less than $5,000 | 125 (1.4%) | 183 (5.6%) |
| $5,000 to $9,999 | 84 (1.0%) | 62 (1.9%) |
| $10,000 to $14,999 | 61 (0.7%) | 131 (4.0%) |
| $15,000 to $19,999 | 169 (1.9%) | 66 (2.0%) |
| $20,000 to $24,999 | 180 (2.1%) | 221 (6.7%) |
| $25,000 to $34,999 | 442 (5.1%) | 328 (10.0%) |
| $35,000 to $49,999 | 769 (8.8%) | 441 (13.5%) |
| $50,000 to $74,999 | 1,722 (19.8%) | 499 (15.2%) |
| $75,000 to $99,999 | 1,169 (13.5%) | 587 (17.9%) |
| $100,000 to $149,999 | 1,869 (21.5%) | 267 (8.2%) |
| $150,000 or more | 2,100 (24.2%) | 493 (15.0%) |
| Total | 8,690 (100.0%) | 3,278 (100.0%) |
Monthly Housing Cost Tiers in Martinez
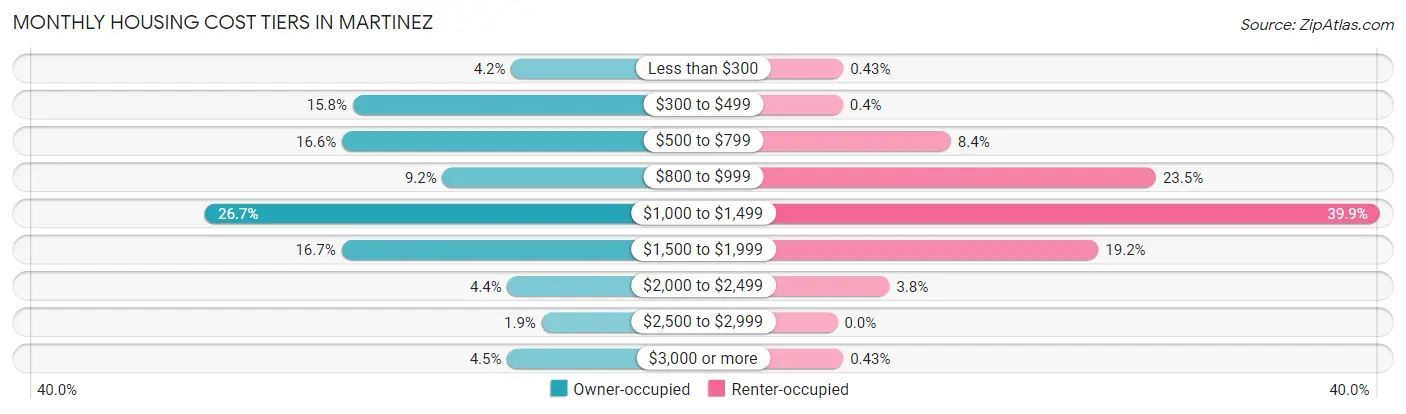
| Monthly Cost | Owner-occupied | Renter-occupied |
| Less than $300 | 361 (4.2%) | 14 (0.4%) |
| $300 to $499 | 1,376 (15.8%) | 13 (0.4%) |
| $500 to $799 | 1,444 (16.6%) | 274 (8.4%) |
| $800 to $999 | 801 (9.2%) | 769 (23.5%) |
| $1,000 to $1,499 | 2,321 (26.7%) | 1,309 (39.9%) |
| $1,500 to $1,999 | 1,448 (16.7%) | 630 (19.2%) |
| $2,000 to $2,499 | 385 (4.4%) | 126 (3.8%) |
| $2,500 to $2,999 | 167 (1.9%) | 0 (0.0%) |
| $3,000 or more | 387 (4.4%) | 14 (0.4%) |
| Total | 8,690 (100.0%) | 3,278 (100.0%) |
Physical Housing Characteristics in Martinez
Housing Structures in Martinez
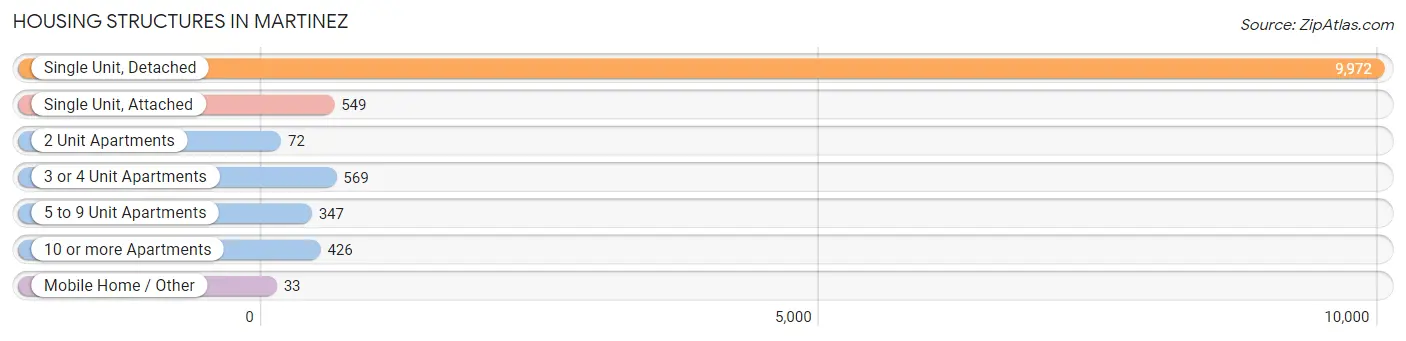
| Structure Type | # Housing Units | % Housing Units |
| Single Unit, Detached | 9,972 | 83.3% |
| Single Unit, Attached | 549 | 4.6% |
| 2 Unit Apartments | 72 | 0.6% |
| 3 or 4 Unit Apartments | 569 | 4.8% |
| 5 to 9 Unit Apartments | 347 | 2.9% |
| 10 or more Apartments | 426 | 3.6% |
| Mobile Home / Other | 33 | 0.3% |
| Total | 11,968 | 100.0% |
Housing Structures by Occupancy in Martinez
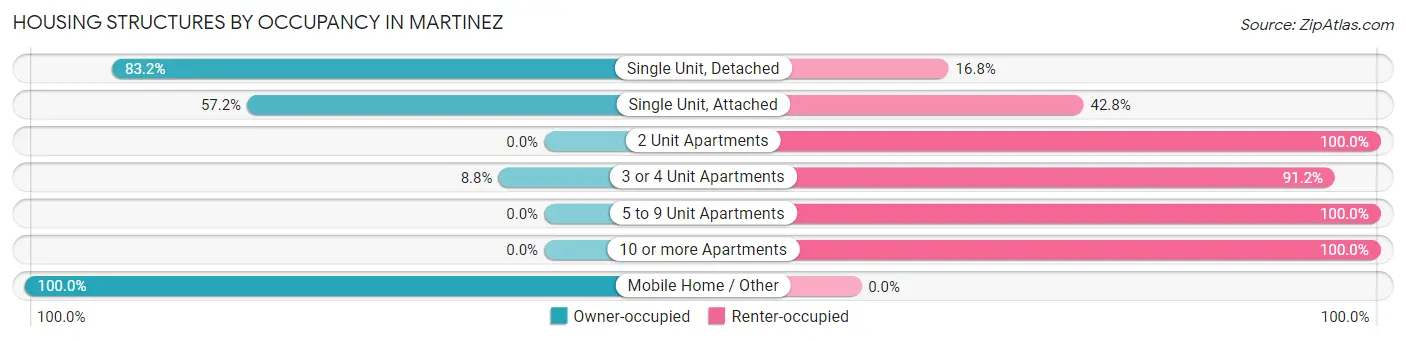
| Structure Type | Owner-occupied | Renter-occupied |
| Single Unit, Detached | 8,293 (83.2%) | 1,679 (16.8%) |
| Single Unit, Attached | 314 (57.2%) | 235 (42.8%) |
| 2 Unit Apartments | 0 (0.0%) | 72 (100.0%) |
| 3 or 4 Unit Apartments | 50 (8.8%) | 519 (91.2%) |
| 5 to 9 Unit Apartments | 0 (0.0%) | 347 (100.0%) |
| 10 or more Apartments | 0 (0.0%) | 426 (100.0%) |
| Mobile Home / Other | 33 (100.0%) | 0 (0.0%) |
| Total | 8,690 (72.6%) | 3,278 (27.4%) |
Housing Structures by Number of Rooms in Martinez
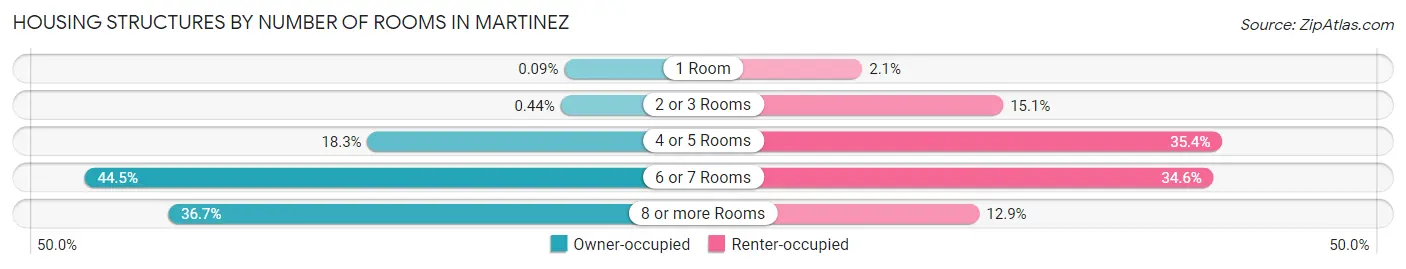
| Number of Rooms | Owner-occupied | Renter-occupied |
| 1 Room | 8 (0.1%) | 68 (2.1%) |
| 2 or 3 Rooms | 38 (0.4%) | 495 (15.1%) |
| 4 or 5 Rooms | 1,589 (18.3%) | 1,159 (35.4%) |
| 6 or 7 Rooms | 3,863 (44.5%) | 1,133 (34.6%) |
| 8 or more Rooms | 3,192 (36.7%) | 423 (12.9%) |
| Total | 8,690 (100.0%) | 3,278 (100.0%) |
Housing Structure by Heating Type in Martinez
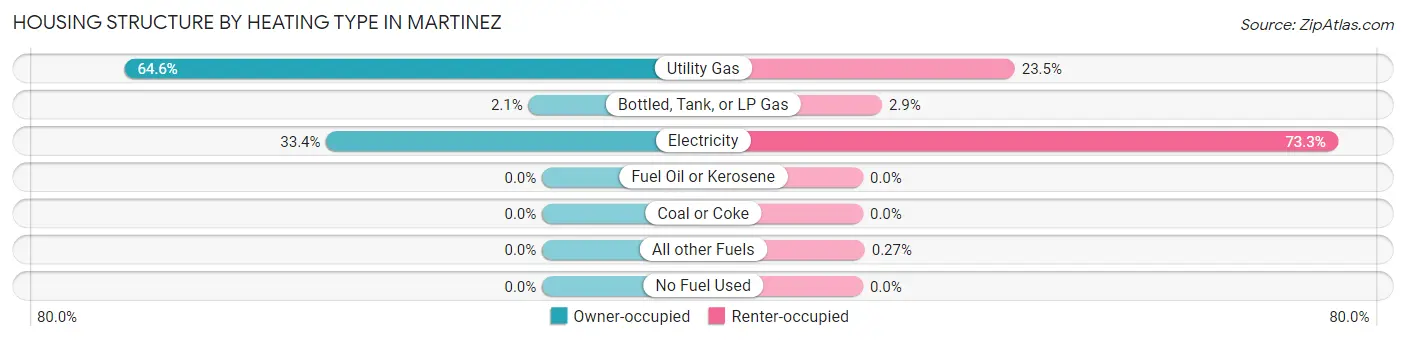
| Heating Type | Owner-occupied | Renter-occupied |
| Utility Gas | 5,610 (64.6%) | 769 (23.5%) |
| Bottled, Tank, or LP Gas | 182 (2.1%) | 96 (2.9%) |
| Electricity | 2,898 (33.4%) | 2,404 (73.3%) |
| Fuel Oil or Kerosene | 0 (0.0%) | 0 (0.0%) |
| Coal or Coke | 0 (0.0%) | 0 (0.0%) |
| All other Fuels | 0 (0.0%) | 9 (0.3%) |
| No Fuel Used | 0 (0.0%) | 0 (0.0%) |
| Total | 8,690 (100.0%) | 3,278 (100.0%) |
Household Vehicle Usage in Martinez
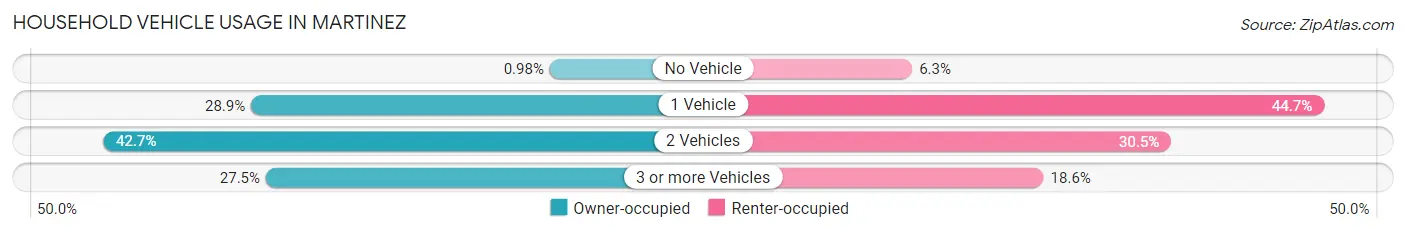
| Vehicles per Household | Owner-occupied | Renter-occupied |
| No Vehicle | 85 (1.0%) | 206 (6.3%) |
| 1 Vehicle | 2,508 (28.9%) | 1,466 (44.7%) |
| 2 Vehicles | 3,709 (42.7%) | 998 (30.4%) |
| 3 or more Vehicles | 2,388 (27.5%) | 608 (18.5%) |
| Total | 8,690 (100.0%) | 3,278 (100.0%) |
Real Estate & Mortgages in Martinez
Real Estate and Mortgage Overview in Martinez
| Characteristic | Without Mortgage | With Mortgage |
| Housing Units | 3,531 | 5,159 |
| Median Property Value | $207,200 | $213,900 |
| Median Household Income | $75,958 | $1,263 |
| Monthly Housing Costs | $507 | $387 |
| Real Estate Taxes | $1,587 | $284 |
Property Value by Mortgage Status in Martinez
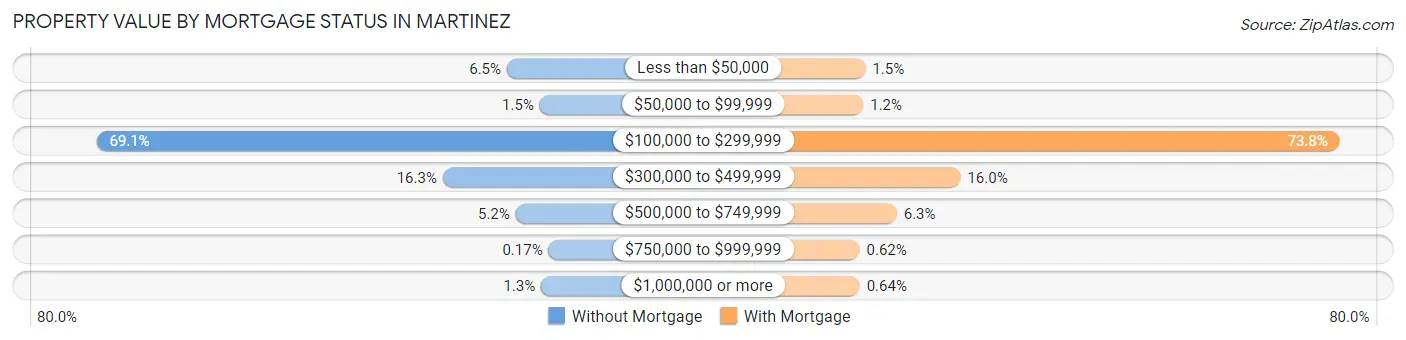
| Property Value | Without Mortgage | With Mortgage |
| Less than $50,000 | 230 (6.5%) | 78 (1.5%) |
| $50,000 to $99,999 | 53 (1.5%) | 61 (1.2%) |
| $100,000 to $299,999 | 2,438 (69.1%) | 3,806 (73.8%) |
| $300,000 to $499,999 | 575 (16.3%) | 825 (16.0%) |
| $500,000 to $749,999 | 183 (5.2%) | 324 (6.3%) |
| $750,000 to $999,999 | 6 (0.2%) | 32 (0.6%) |
| $1,000,000 or more | 46 (1.3%) | 33 (0.6%) |
| Total | 3,531 (100.0%) | 5,159 (100.0%) |
Household Income by Mortgage Status in Martinez
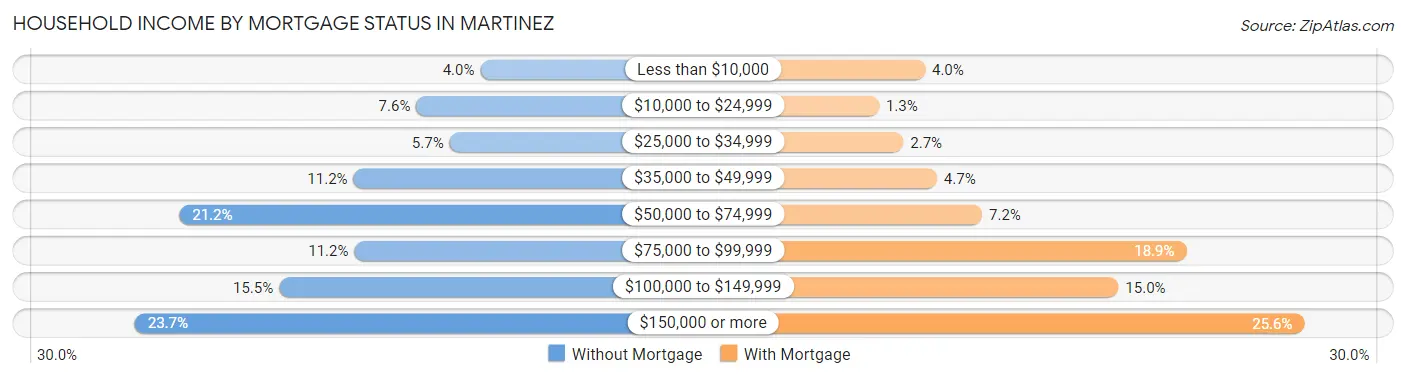
| Household Income | Without Mortgage | With Mortgage |
| Less than $10,000 | 140 (4.0%) | 205 (4.0%) |
| $10,000 to $24,999 | 269 (7.6%) | 69 (1.3%) |
| $25,000 to $34,999 | 202 (5.7%) | 141 (2.7%) |
| $35,000 to $49,999 | 396 (11.2%) | 240 (4.6%) |
| $50,000 to $74,999 | 747 (21.2%) | 373 (7.2%) |
| $75,000 to $99,999 | 394 (11.2%) | 975 (18.9%) |
| $100,000 to $149,999 | 546 (15.5%) | 775 (15.0%) |
| $150,000 or more | 837 (23.7%) | 1,323 (25.6%) |
| Total | 3,531 (100.0%) | 5,159 (100.0%) |
Property Value to Household Income Ratio in Martinez
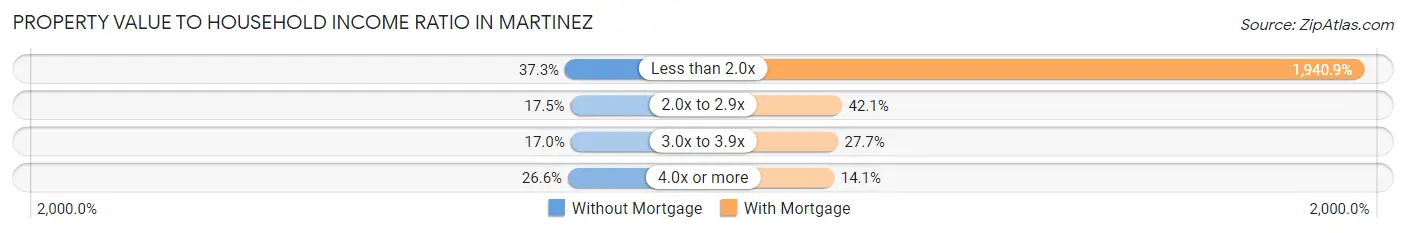
| Value-to-Income Ratio | Without Mortgage | With Mortgage |
| Less than 2.0x | 1,316 (37.3%) | 100,133 (1,940.9%) |
| 2.0x to 2.9x | 618 (17.5%) | 2,172 (42.1%) |
| 3.0x to 3.9x | 599 (17.0%) | 1,430 (27.7%) |
| 4.0x or more | 938 (26.6%) | 729 (14.1%) |
| Total | 3,531 (100.0%) | 5,159 (100.0%) |
Real Estate Taxes by Mortgage Status in Martinez
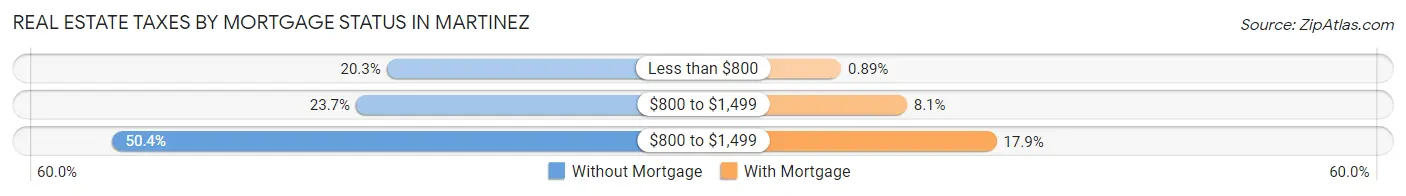
| Property Taxes | Without Mortgage | With Mortgage |
| Less than $800 | 718 (20.3%) | 46 (0.9%) |
| $800 to $1,499 | 837 (23.7%) | 417 (8.1%) |
| $800 to $1,499 | 1,778 (50.3%) | 924 (17.9%) |
| Total | 3,531 (100.0%) | 5,159 (100.0%) |
Health & Disability in Martinez
Health Insurance Coverage by Age in Martinez
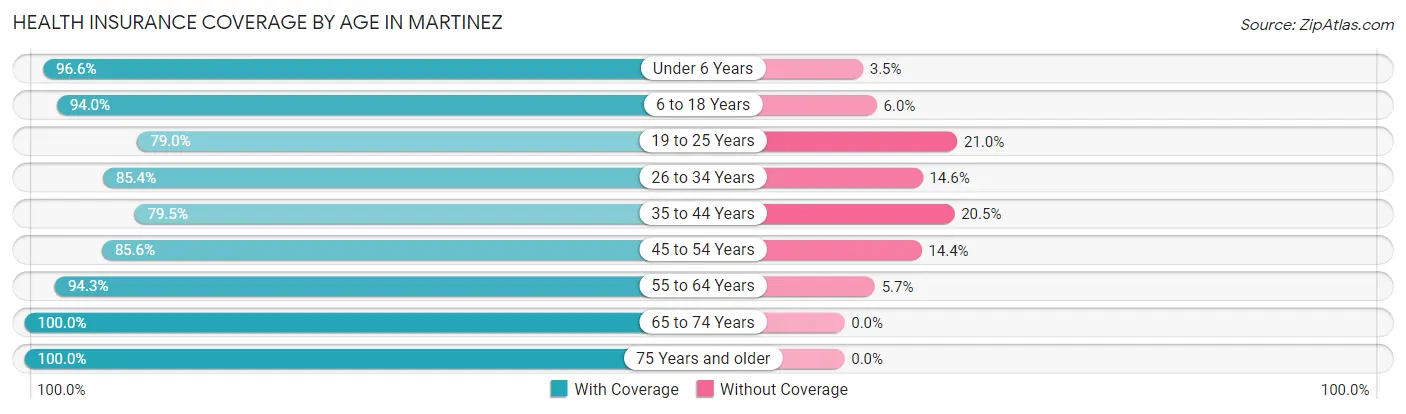
| Age Bracket | With Coverage | Without Coverage |
| Under 6 Years | 2,322 (96.6%) | 83 (3.5%) |
| 6 to 18 Years | 5,525 (94.0%) | 354 (6.0%) |
| 19 to 25 Years | 1,863 (79.0%) | 496 (21.0%) |
| 26 to 34 Years | 3,697 (85.4%) | 631 (14.6%) |
| 35 to 44 Years | 3,789 (79.5%) | 977 (20.5%) |
| 45 to 54 Years | 3,259 (85.6%) | 548 (14.4%) |
| 55 to 64 Years | 4,175 (94.3%) | 251 (5.7%) |
| 65 to 74 Years | 3,307 (100.0%) | 0 (0.0%) |
| 75 Years and older | 2,236 (100.0%) | 0 (0.0%) |
| Total | 30,173 (90.0%) | 3,340 (10.0%) |
Health Insurance Coverage by Citizenship Status in Martinez
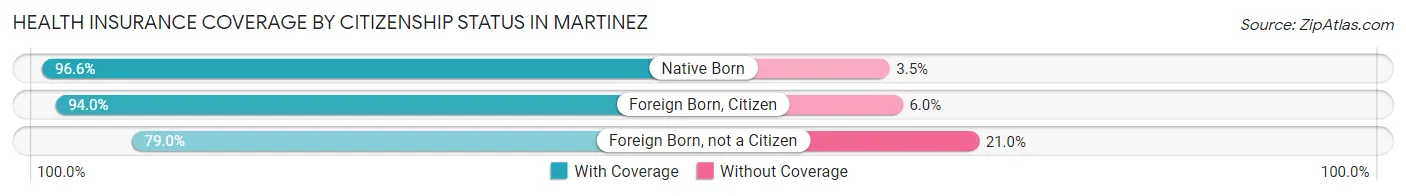
| Citizenship Status | With Coverage | Without Coverage |
| Native Born | 2,322 (96.6%) | 83 (3.5%) |
| Foreign Born, Citizen | 5,525 (94.0%) | 354 (6.0%) |
| Foreign Born, not a Citizen | 1,863 (79.0%) | 496 (21.0%) |
Health Insurance Coverage by Household Income in Martinez
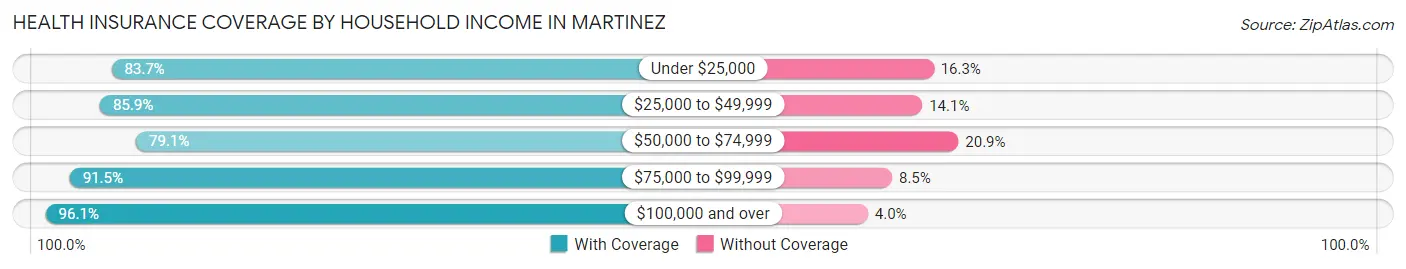
| Household Income | With Coverage | Without Coverage |
| Under $25,000 | 2,572 (83.7%) | 500 (16.3%) |
| $25,000 to $49,999 | 2,936 (85.9%) | 483 (14.1%) |
| $50,000 to $74,999 | 4,745 (79.1%) | 1,254 (20.9%) |
| $75,000 to $99,999 | 4,729 (91.5%) | 438 (8.5%) |
| $100,000 and over | 15,165 (96.1%) | 624 (4.0%) |
Public vs Private Health Insurance Coverage by Age in Martinez
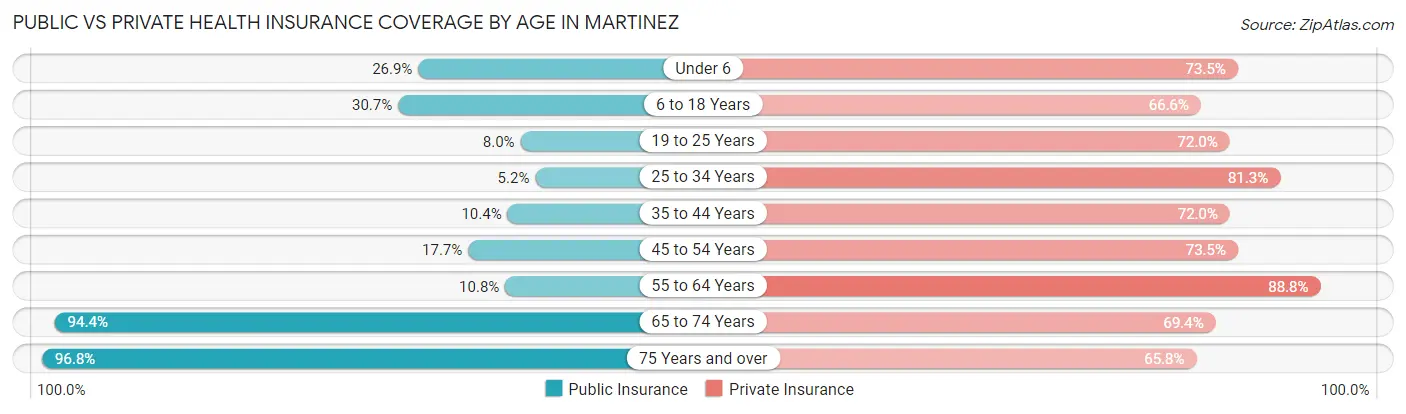
| Age Bracket | Public Insurance | Private Insurance |
| Under 6 | 648 (26.9%) | 1,767 (73.5%) |
| 6 to 18 Years | 1,804 (30.7%) | 3,918 (66.6%) |
| 19 to 25 Years | 188 (8.0%) | 1,698 (72.0%) |
| 25 to 34 Years | 226 (5.2%) | 3,520 (81.3%) |
| 35 to 44 Years | 494 (10.4%) | 3,432 (72.0%) |
| 45 to 54 Years | 673 (17.7%) | 2,798 (73.5%) |
| 55 to 64 Years | 478 (10.8%) | 3,931 (88.8%) |
| 65 to 74 Years | 3,122 (94.4%) | 2,294 (69.4%) |
| 75 Years and over | 2,164 (96.8%) | 1,471 (65.8%) |
| Total | 9,797 (29.2%) | 24,829 (74.1%) |
Disability Status by Sex by Age in Martinez
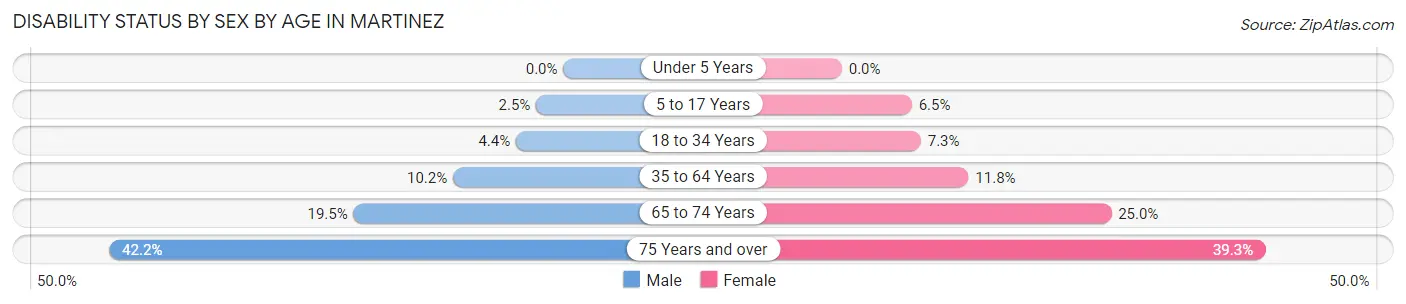
| Age Bracket | Male | Female |
| Under 5 Years | 0 (0.0%) | 0 (0.0%) |
| 5 to 17 Years | 79 (2.5%) | 177 (6.5%) |
| 18 to 34 Years | 159 (4.4%) | 254 (7.3%) |
| 35 to 64 Years | 605 (10.2%) | 833 (11.7%) |
| 65 to 74 Years | 309 (19.5%) | 430 (25.0%) |
| 75 Years and over | 322 (42.1%) | 578 (39.3%) |
Disability Class by Sex by Age in Martinez
Disability Class: Hearing Difficulty
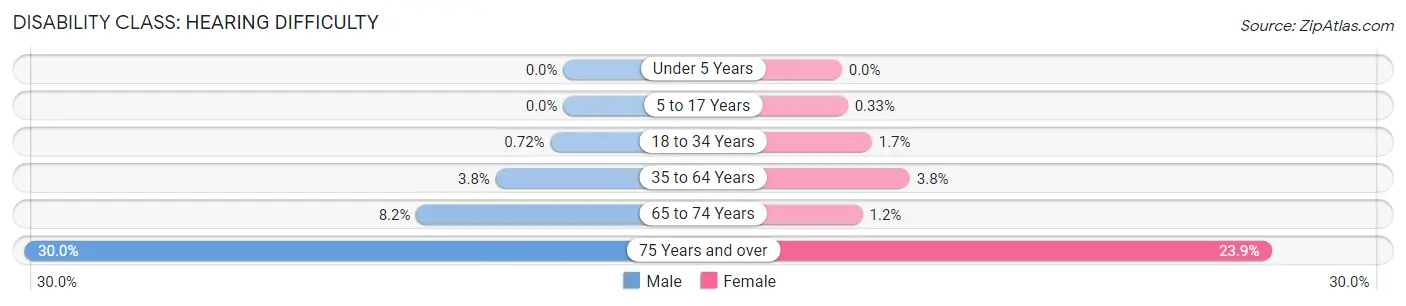
| Age Bracket | Male | Female |
| Under 5 Years | 0 (0.0%) | 0 (0.0%) |
| 5 to 17 Years | 0 (0.0%) | 9 (0.3%) |
| 18 to 34 Years | 26 (0.7%) | 58 (1.7%) |
| 35 to 64 Years | 223 (3.8%) | 269 (3.8%) |
| 65 to 74 Years | 130 (8.2%) | 20 (1.2%) |
| 75 Years and over | 229 (30.0%) | 352 (23.9%) |
Disability Class: Vision Difficulty
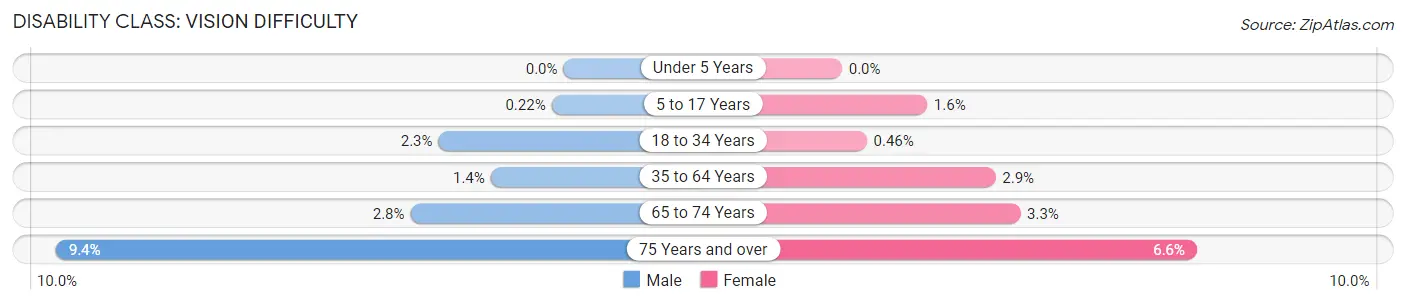
| Age Bracket | Male | Female |
| Under 5 Years | 0 (0.0%) | 0 (0.0%) |
| 5 to 17 Years | 7 (0.2%) | 43 (1.6%) |
| 18 to 34 Years | 84 (2.3%) | 16 (0.5%) |
| 35 to 64 Years | 80 (1.3%) | 202 (2.9%) |
| 65 to 74 Years | 45 (2.8%) | 57 (3.3%) |
| 75 Years and over | 72 (9.4%) | 97 (6.6%) |
Disability Class: Cognitive Difficulty
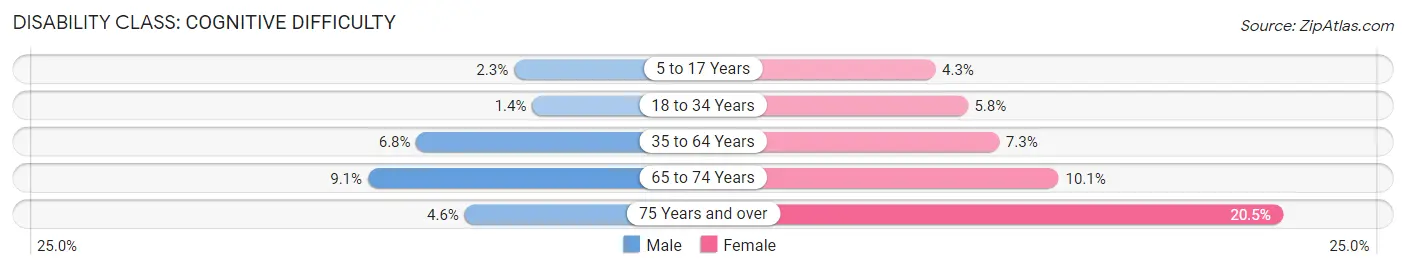
| Age Bracket | Male | Female |
| 5 to 17 Years | 72 (2.3%) | 118 (4.3%) |
| 18 to 34 Years | 52 (1.4%) | 202 (5.8%) |
| 35 to 64 Years | 403 (6.8%) | 517 (7.3%) |
| 65 to 74 Years | 144 (9.1%) | 173 (10.1%) |
| 75 Years and over | 35 (4.6%) | 301 (20.4%) |
Disability Class: Ambulatory Difficulty
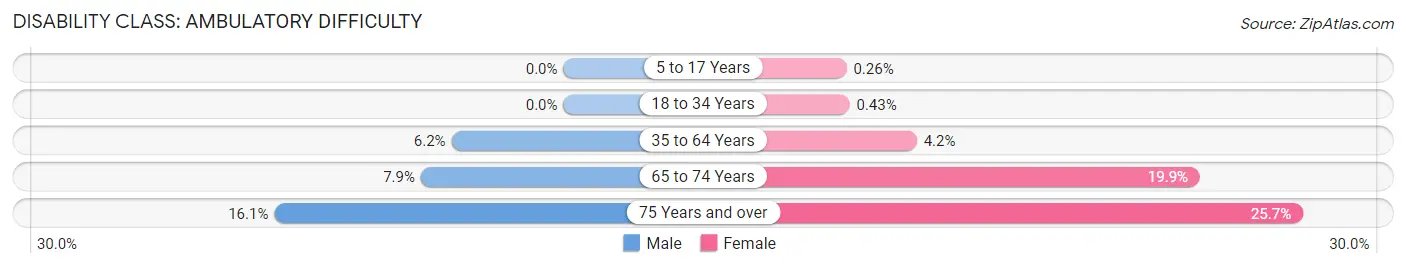
| Age Bracket | Male | Female |
| 5 to 17 Years | 0 (0.0%) | 7 (0.3%) |
| 18 to 34 Years | 0 (0.0%) | 15 (0.4%) |
| 35 to 64 Years | 368 (6.2%) | 296 (4.2%) |
| 65 to 74 Years | 126 (7.9%) | 343 (19.9%) |
| 75 Years and over | 123 (16.1%) | 378 (25.7%) |
Disability Class: Self-Care Difficulty
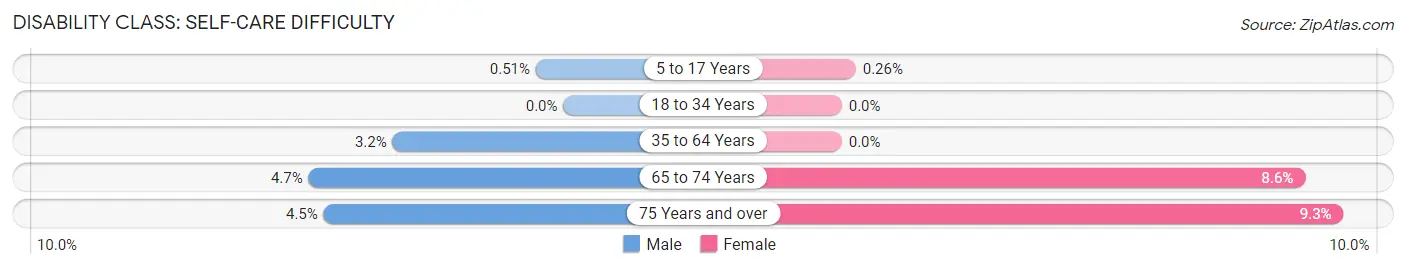
| Age Bracket | Male | Female |
| 5 to 17 Years | 16 (0.5%) | 7 (0.3%) |
| 18 to 34 Years | 0 (0.0%) | 0 (0.0%) |
| 35 to 64 Years | 187 (3.2%) | 0 (0.0%) |
| 65 to 74 Years | 75 (4.7%) | 148 (8.6%) |
| 75 Years and over | 34 (4.4%) | 137 (9.3%) |
Technology Access in Martinez
Computing Device Access in Martinez
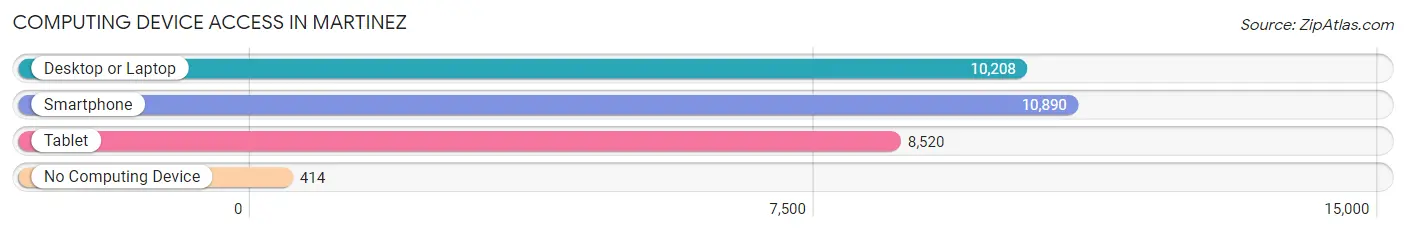
| Device Type | # Households | % Households |
| Desktop or Laptop | 10,208 | 85.3% |
| Smartphone | 10,890 | 91.0% |
| Tablet | 8,520 | 71.2% |
| No Computing Device | 414 | 3.5% |
| Total | 11,968 | 100.0% |
Internet Access in Martinez
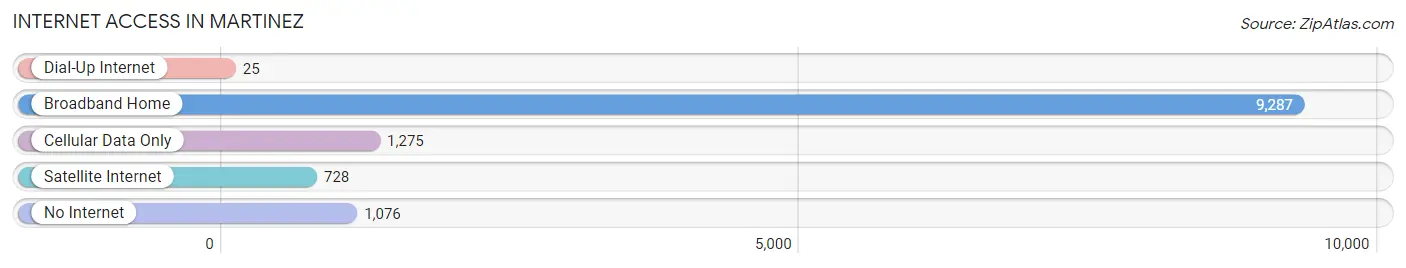
| Internet Type | # Households | % Households |
| Dial-Up Internet | 25 | 0.2% |
| Broadband Home | 9,287 | 77.6% |
| Cellular Data Only | 1,275 | 10.6% |
| Satellite Internet | 728 | 6.1% |
| No Internet | 1,076 | 9.0% |
| Total | 11,968 | 100.0% |
Martinez Summary
Martinez, Georgia is a small city located in Columbia County, just outside of Augusta. It is part of the Augusta-Richmond County Metropolitan Statistical Area and has a population of approximately 35,000 people. The city is known for its historic downtown area, which is home to a variety of shops, restaurants, and other businesses.
History
Martinez was founded in 1837 by a group of settlers from the nearby town of Augusta. The town was named after the Spanish explorer, Don Luis Martinez, who explored the area in the late 1700s. The town was originally a farming community, but it soon developed into a small industrial center. In the late 1800s, the town was home to several cotton mills, a sawmill, and a gristmill.
In the early 1900s, the town began to grow rapidly. The population increased from 1,000 in 1900 to over 5,000 by the mid-1920s. During this time, the town was home to several businesses, including a cotton mill, a brickyard, and a lumber mill.
In the 1950s, the town began to experience a decline in population as many of the businesses closed. However, in the late 1970s, the town began to experience a resurgence as new businesses opened and the population began to grow again.
Geography
Martinez is located in Columbia County, Georgia, just outside of Augusta. The city is situated on the Savannah River, which forms the border between Georgia and South Carolina. The city is located in the Piedmont region of the state, which is characterized by rolling hills and forests. The city is also located near several lakes, including Clarks Hill Lake and Thurmond Lake.
Economy
The economy of Martinez is largely based on the service industry. The city is home to several large employers, including the Augusta-Richmond County government, the University of Georgia, and the Medical College of Georgia. The city is also home to several small businesses, including restaurants, retail stores, and professional services.
Demographics
As of the 2010 census, the population of Martinez was 35,000. The racial makeup of the city was 73.3% White, 19.2% African American, 0.3% Native American, 2.2% Asian, and 4.9% from other races. The median household income was $45,000, and the median age was 37.
Martinez is a diverse city with a variety of cultures and backgrounds. The city is home to a large Hispanic population, as well as a growing Asian population. The city is also home to a large military population, as it is located near several military bases.
Common Questions
What is Per Capita Income in Martinez?
Per Capita income in Martinez is $42,399.
What is the Median Family Income in Martinez?
Median Family Income in Martinez is $95,767.
What is the Median Household income in Martinez?
Median Household Income in Martinez is $80,130.
What is Income or Wage Gap in Martinez?
Income or Wage Gap in Martinez is 31.5%.
Women in Martinez earn 68.5 cents for every dollar earned by a man.
What is Family Income Deficit in Martinez?
Family Income Deficit in Martinez is $14,309.
Families that are below poverty line in Martinez earn $14,309 less on average than the poverty threshold level.
What is Inequality or Gini Index in Martinez?
Inequality or Gini Index in Martinez is 0.43.
What is the Total Population of Martinez?
Total Population of Martinez is 33,773.
What is the Total Male Population of Martinez?
Total Male Population of Martinez is 16,080.
What is the Total Female Population of Martinez?
Total Female Population of Martinez is 17,693.
What is the Ratio of Males per 100 Females in Martinez?
There are 90.88 Males per 100 Females in Martinez.
What is the Ratio of Females per 100 Males in Martinez?
There are 110.03 Females per 100 Males in Martinez.
What is the Median Population Age in Martinez?
Median Population Age in Martinez is 39.1 Years.
What is the Average Family Size in Martinez
Average Family Size in Martinez is 3.5 People.
What is the Average Household Size in Martinez
Average Household Size in Martinez is 2.8 People.
How Large is the Labor Force in Martinez?
There are 17,014 People in the Labor Forcein in Martinez.
What is the Percentage of People in the Labor Force in Martinez?
63.4% of People are in the Labor Force in Martinez.
What is the Unemployment Rate in Martinez?
Unemployment Rate in Martinez is 3.9%.