Grantville, GA Map & Demographics
Grantville Map
Grantville Overview
$29,095
PER CAPITA INCOME
$88,008
AVG FAMILY INCOME
$81,815
AVG HOUSEHOLD INCOME
19.6%
WAGE / INCOME GAP [ % ]
80.4¢/ $1
WAGE / INCOME GAP [ $ ]
0.33
INEQUALITY / GINI INDEX
3,175
TOTAL POPULATION
1,482
MALE POPULATION
1,693
FEMALE POPULATION
87.54
MALES / 100 FEMALES
114.24
FEMALES / 100 MALES
33.9
MEDIAN AGE
3.4
AVG FAMILY SIZE
3.0
AVG HOUSEHOLD SIZE
1,777
LABOR FORCE [ PEOPLE ]
70.6%
PERCENT IN LABOR FORCE
3.2%
UNEMPLOYMENT RATE
Grantville Zip Codes
Income in Grantville
Income Overview in Grantville
Per Capita Income in Grantville is $29,095, while median incomes of families and households are $88,008 and $81,815 respectively.
| Characteristic | Number | Measure |
| Per Capita Income | 3,175 | $29,095 |
| Median Family Income | 803 | $88,008 |
| Mean Family Income | 803 | $91,808 |
| Median Household Income | 1,075 | $81,815 |
| Mean Household Income | 1,075 | $84,007 |
| Income Deficit | 803 | $0 |
| Wage / Income Gap (%) | 3,175 | 19.57% |
| Wage / Income Gap ($) | 3,175 | 80.43¢ per $1 |
| Gini / Inequality Index | 3,175 | 0.33 |
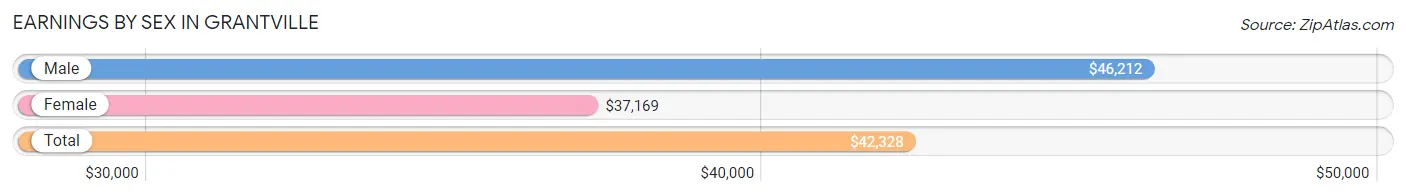
Earnings by Sex in Grantville
Average Earnings in Grantville are $42,328, $46,212 for men and $37,169 for women, a difference of 19.6%.
| Sex | Number | Average Earnings |
| Male | 855 (47.8%) | $46,212 |
| Female | 933 (52.2%) | $37,169 |
| Total | 1,788 (100.0%) | $42,328 |
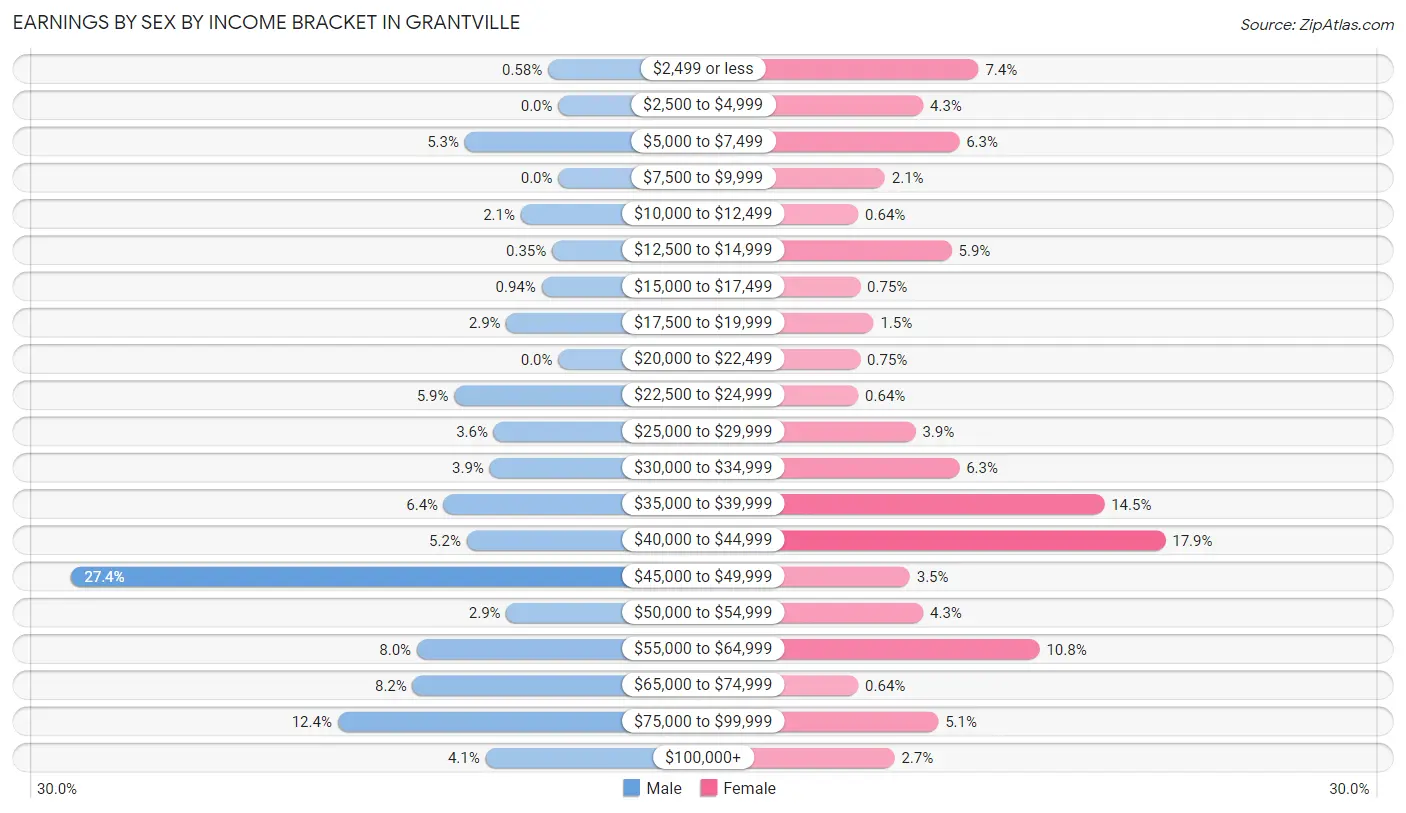
Earnings by Sex by Income Bracket in Grantville
The most common earnings brackets in Grantville are $45,000 to $49,999 for men (234 | 27.4%) and $40,000 to $44,999 for women (167 | 17.9%).
| Income | Male | Female |
| $2,499 or less | 5 (0.6%) | 69 (7.4%) |
| $2,500 to $4,999 | 0 (0.0%) | 40 (4.3%) |
| $5,000 to $7,499 | 45 (5.3%) | 59 (6.3%) |
| $7,500 to $9,999 | 0 (0.0%) | 20 (2.1%) |
| $10,000 to $12,499 | 18 (2.1%) | 6 (0.6%) |
| $12,500 to $14,999 | 3 (0.4%) | 55 (5.9%) |
| $15,000 to $17,499 | 8 (0.9%) | 7 (0.7%) |
| $17,500 to $19,999 | 25 (2.9%) | 14 (1.5%) |
| $20,000 to $22,499 | 0 (0.0%) | 7 (0.7%) |
| $22,500 to $24,999 | 50 (5.9%) | 6 (0.6%) |
| $25,000 to $29,999 | 31 (3.6%) | 36 (3.9%) |
| $30,000 to $34,999 | 33 (3.9%) | 59 (6.3%) |
| $35,000 to $39,999 | 55 (6.4%) | 135 (14.5%) |
| $40,000 to $44,999 | 44 (5.1%) | 167 (17.9%) |
| $45,000 to $49,999 | 234 (27.4%) | 33 (3.5%) |
| $50,000 to $54,999 | 25 (2.9%) | 40 (4.3%) |
| $55,000 to $64,999 | 68 (8.0%) | 101 (10.8%) |
| $65,000 to $74,999 | 70 (8.2%) | 6 (0.6%) |
| $75,000 to $99,999 | 106 (12.4%) | 48 (5.1%) |
| $100,000+ | 35 (4.1%) | 25 (2.7%) |
| Total | 855 (100.0%) | 933 (100.0%) |
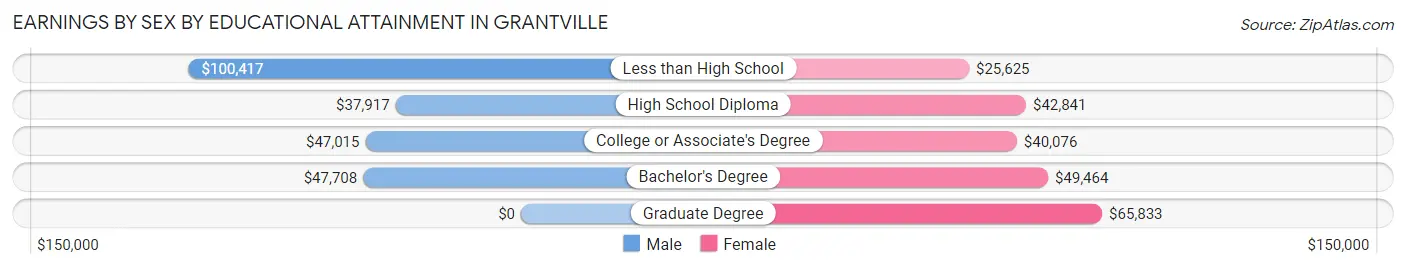
Earnings by Sex by Educational Attainment in Grantville
Average earnings in Grantville are $46,700 for men and $41,962 for women, a difference of 10.2%. Men with an educational attainment of less than high school enjoy the highest average annual earnings of $100,417, while those with high school diploma education earn the least with $37,917. Women with an educational attainment of graduate degree earn the most with the average annual earnings of $65,833, while those with less than high school education have the smallest earnings of $25,625.
| Educational Attainment | Male Income | Female Income |
| Less than High School | $100,417 | $25,625 |
| High School Diploma | $37,917 | $42,841 |
| College or Associate's Degree | $47,015 | $40,076 |
| Bachelor's Degree | $47,708 | $49,464 |
| Graduate Degree | - | - |
| Total | $46,700 | $41,962 |
Family Income in Grantville
Family Income Brackets in Grantville
According to the Grantville family income data, there are 222 families falling into the $100,000 to $149,999 income range, which is the most common income bracket and makes up 27.7% of all families. Conversely, the less than $10,000 income bracket is the least frequent group with only 5 families (0.6%) belonging to this category.
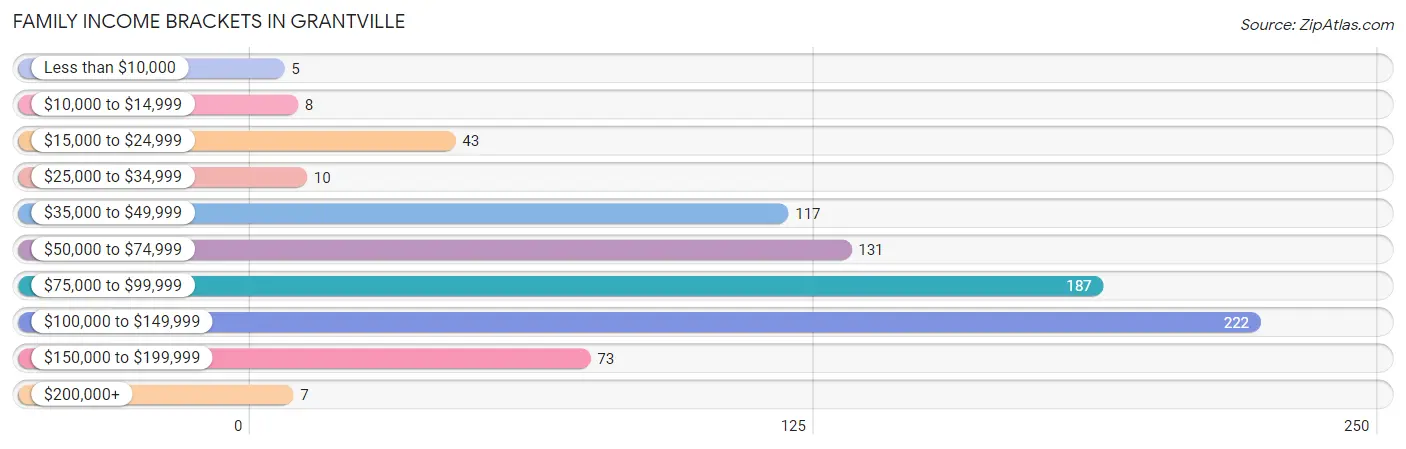
| Income Bracket | # Families | % Families |
| Less than $10,000 | 5 | 0.6% |
| $10,000 to $14,999 | 8 | 1.0% |
| $15,000 to $24,999 | 43 | 5.4% |
| $25,000 to $34,999 | 10 | 1.2% |
| $35,000 to $49,999 | 117 | 14.6% |
| $50,000 to $74,999 | 131 | 16.3% |
| $75,000 to $99,999 | 187 | 23.3% |
| $100,000 to $149,999 | 222 | 27.6% |
| $150,000 to $199,999 | 73 | 9.1% |
| $200,000+ | 7 | 0.9% |
Family Income by Famaliy Size in Grantville
4-person families (171 | 21.3%) account for the highest median family income in Grantville with $134,338 per family, while 2-person families (315 | 39.2%) have the highest median income of $35,208 per family member.
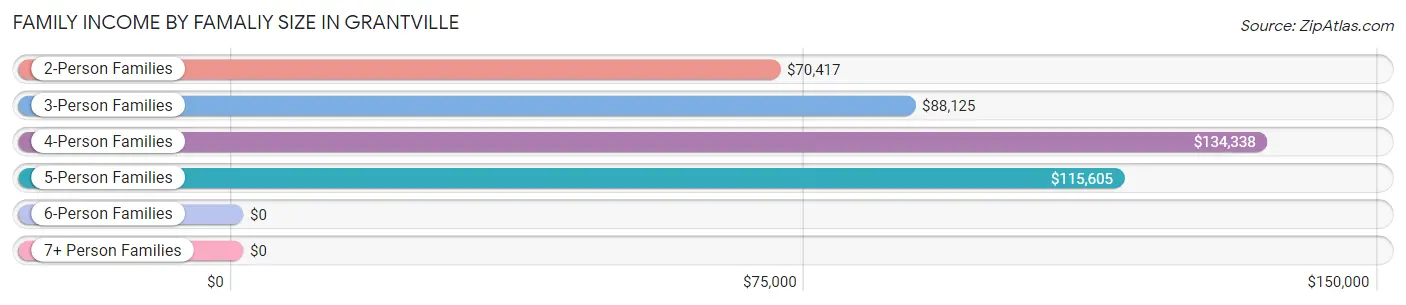
| Income Bracket | # Families | Median Income |
| 2-Person Families | 315 (39.2%) | $70,417 |
| 3-Person Families | 187 (23.3%) | $88,125 |
| 4-Person Families | 171 (21.3%) | $134,338 |
| 5-Person Families | 103 (12.8%) | $115,605 |
| 6-Person Families | 17 (2.1%) | $0 |
| 7+ Person Families | 10 (1.3%) | $0 |
| Total | 803 (100.0%) | $88,008 |
Family Income by Number of Earners in Grantville
The median family income in Grantville is $88,008, with families comprising 3+ earners (195) having the highest median family income of $131,042, while families with no earners (47) have the lowest median family income of $32,625, accounting for 24.3% and 5.9% of families, respectively.
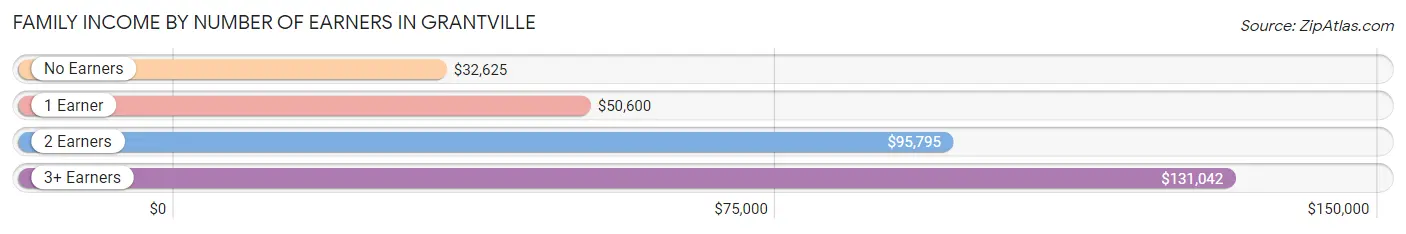
| Number of Earners | # Families | Median Income |
| No Earners | 47 (5.9%) | $32,625 |
| 1 Earner | 280 (34.9%) | $50,600 |
| 2 Earners | 281 (35.0%) | $95,795 |
| 3+ Earners | 195 (24.3%) | $131,042 |
| Total | 803 (100.0%) | $88,008 |
Household Income in Grantville
Household Income Brackets in Grantville
With 258 households falling in the category, the $100,000 to $149,999 income range is the most frequent in Grantville, accounting for 24.0% of all households. In contrast, only 8 households (0.7%) fall into the $200,000+ income bracket, making it the least populous group.
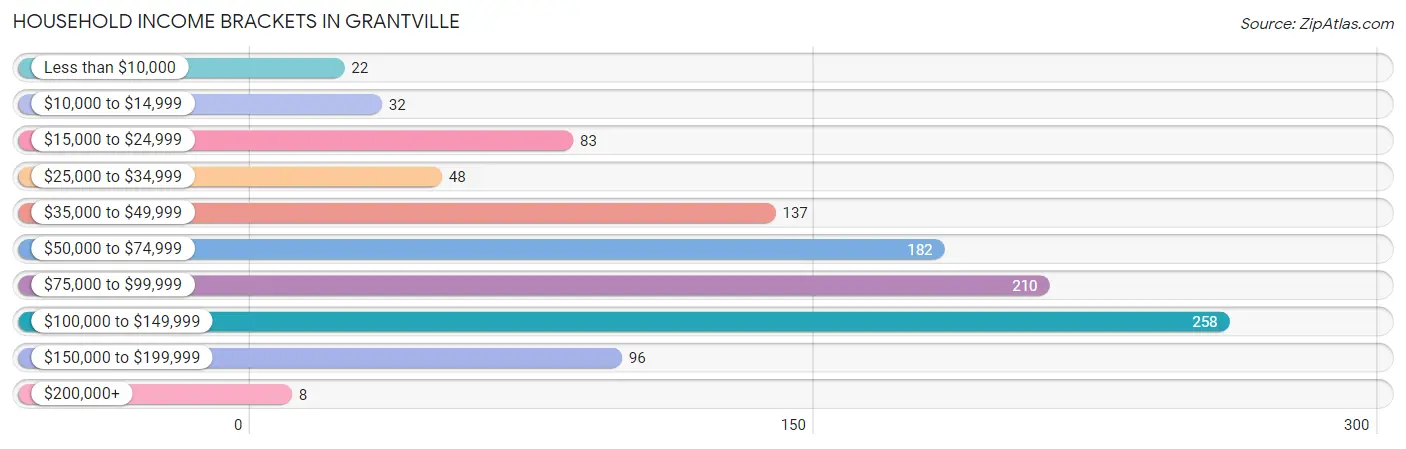
| Income Bracket | # Households | % Households |
| Less than $10,000 | 22 | 2.0% |
| $10,000 to $14,999 | 32 | 3.0% |
| $15,000 to $24,999 | 83 | 7.7% |
| $25,000 to $34,999 | 48 | 4.5% |
| $35,000 to $49,999 | 137 | 12.7% |
| $50,000 to $74,999 | 182 | 16.9% |
| $75,000 to $99,999 | 210 | 19.5% |
| $100,000 to $149,999 | 258 | 24.0% |
| $150,000 to $199,999 | 96 | 8.9% |
| $200,000+ | 8 | 0.7% |
Household Income by Householder Age in Grantville
The median household income in Grantville is $81,815, with the highest median household income of $91,979 found in the 45 to 64 years age bracket for the primary householder. A total of 423 households (39.4%) fall into this category. Meanwhile, the 65+ years age bracket for the primary householder has the lowest median household income of $40,395, with 194 households (18.0%) in this group.
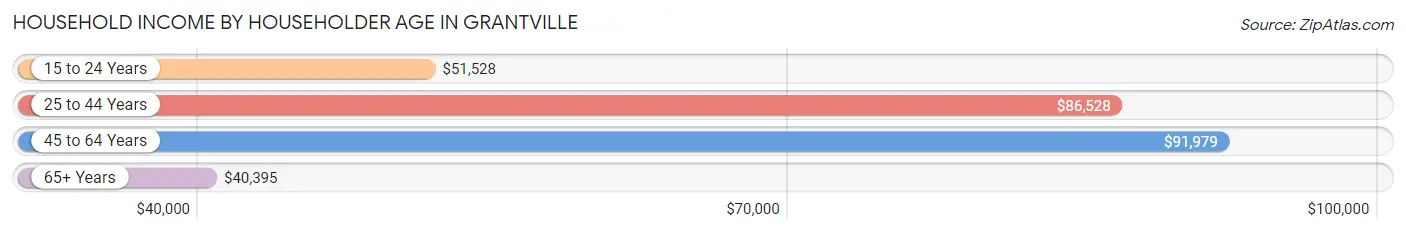
| Income Bracket | # Households | Median Income |
| 15 to 24 Years | 19 (1.8%) | $51,528 |
| 25 to 44 Years | 439 (40.8%) | $86,528 |
| 45 to 64 Years | 423 (39.4%) | $91,979 |
| 65+ Years | 194 (18.0%) | $40,395 |
| Total | 1,075 (100.0%) | $81,815 |
Poverty in Grantville
Income Below Poverty by Sex and Age in Grantville
With 8.0% poverty level for males and 9.7% for females among the residents of Grantville, 75 year old and over males and 16 and 17 year old females are the most vulnerable to poverty, with 20 males (42.5%) and 22 females (64.7%) in their respective age groups living below the poverty level.
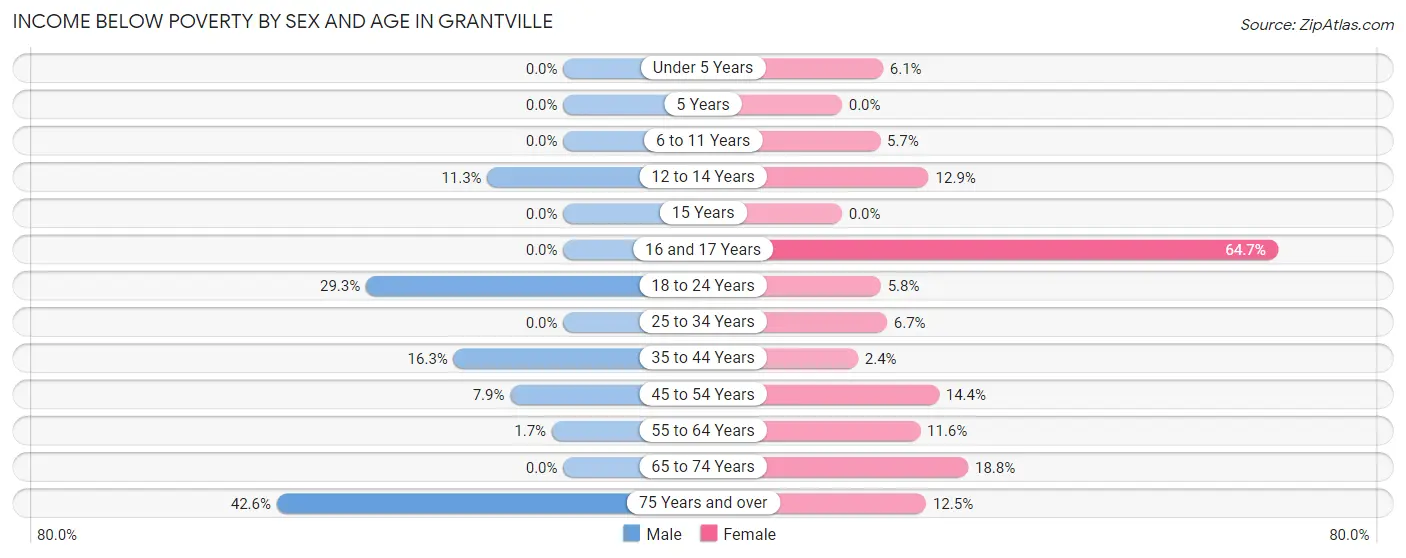
| Age Bracket | Male | Female |
| Under 5 Years | 0 (0.0%) | 5 (6.1%) |
| 5 Years | 0 (0.0%) | 0 (0.0%) |
| 6 to 11 Years | 0 (0.0%) | 5 (5.7%) |
| 12 to 14 Years | 8 (11.3%) | 8 (12.9%) |
| 15 Years | 0 (0.0%) | 0 (0.0%) |
| 16 and 17 Years | 0 (0.0%) | 22 (64.7%) |
| 18 to 24 Years | 46 (29.3%) | 17 (5.8%) |
| 25 to 34 Years | 0 (0.0%) | 19 (6.7%) |
| 35 to 44 Years | 29 (16.3%) | 5 (2.4%) |
| 45 to 54 Years | 13 (7.9%) | 18 (14.4%) |
| 55 to 64 Years | 3 (1.7%) | 35 (11.6%) |
| 65 to 74 Years | 0 (0.0%) | 21 (18.8%) |
| 75 Years and over | 20 (42.5%) | 6 (12.5%) |
| Total | 119 (8.0%) | 161 (9.7%) |
Income Above Poverty by Sex and Age in Grantville
According to the poverty statistics in Grantville, males aged under 5 years and females aged 5 years are the age groups that are most secure financially, with 100.0% of males and 100.0% of females in these age groups living above the poverty line.
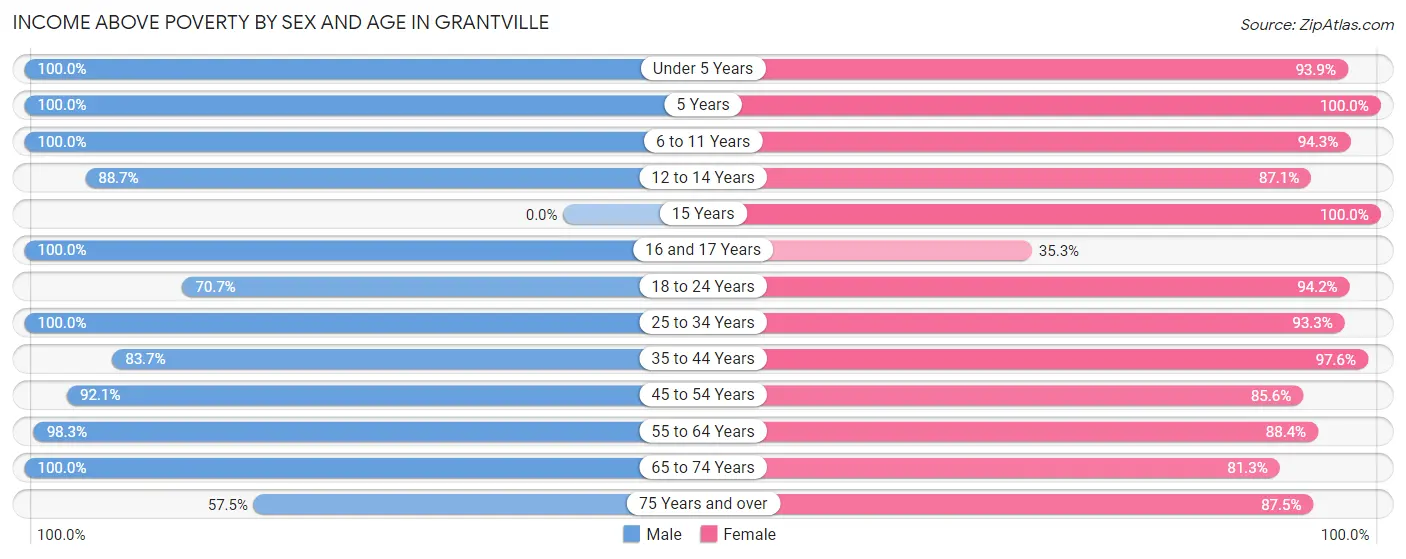
| Age Bracket | Male | Female |
| Under 5 Years | 91 (100.0%) | 77 (93.9%) |
| 5 Years | 8 (100.0%) | 18 (100.0%) |
| 6 to 11 Years | 203 (100.0%) | 83 (94.3%) |
| 12 to 14 Years | 63 (88.7%) | 54 (87.1%) |
| 15 Years | 0 (0.0%) | 11 (100.0%) |
| 16 and 17 Years | 12 (100.0%) | 12 (35.3%) |
| 18 to 24 Years | 111 (70.7%) | 277 (94.2%) |
| 25 to 34 Years | 296 (100.0%) | 265 (93.3%) |
| 35 to 44 Years | 149 (83.7%) | 205 (97.6%) |
| 45 to 54 Years | 152 (92.1%) | 107 (85.6%) |
| 55 to 64 Years | 173 (98.3%) | 266 (88.4%) |
| 65 to 74 Years | 78 (100.0%) | 91 (81.2%) |
| 75 Years and over | 27 (57.5%) | 42 (87.5%) |
| Total | 1,363 (92.0%) | 1,508 (90.3%) |
Income Below Poverty Among Married-Couple Families in Grantville
The poverty statistics for married-couple families in Grantville show that 5.1% or 32 of the total 634 families live below the poverty line. Families with no children have the highest poverty rate of 6.9%, comprising of 27 families. On the other hand, families with 3 or 4 children have the lowest poverty rate of 0.0%, which includes 0 families.
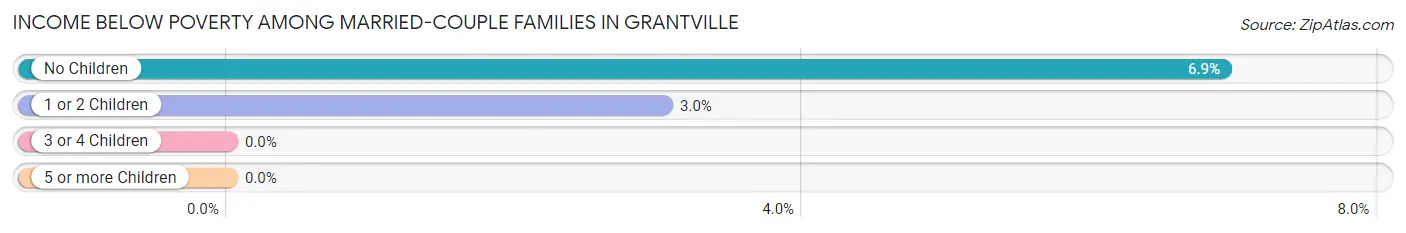
| Children | Above Poverty | Below Poverty |
| No Children | 363 (93.1%) | 27 (6.9%) |
| 1 or 2 Children | 160 (97.0%) | 5 (3.0%) |
| 3 or 4 Children | 69 (100.0%) | 0 (0.0%) |
| 5 or more Children | 10 (100.0%) | 0 (0.0%) |
| Total | 602 (95.0%) | 32 (5.1%) |
Income Below Poverty Among Single-Parent Households in Grantville
According to the poverty data in Grantville, 53.3% or 8 single-father households and 4.5% or 7 single-mother households are living below the poverty line. Among single-father households, those with 1 or 2 children have the highest poverty rate, with 8 households (100.0%) experiencing poverty. Likewise, among single-mother households, those with 1 or 2 children have the highest poverty rate, with 7 households (6.3%) falling below the poverty line.
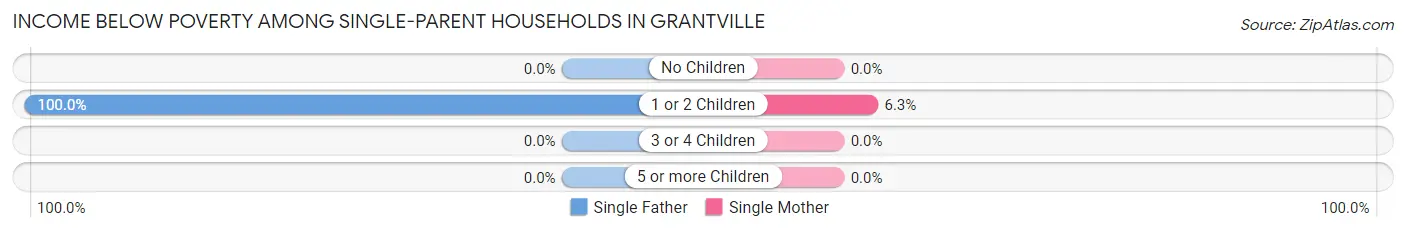
| Children | Single Father | Single Mother |
| No Children | 0 (0.0%) | 0 (0.0%) |
| 1 or 2 Children | 8 (100.0%) | 7 (6.3%) |
| 3 or 4 Children | 0 (0.0%) | 0 (0.0%) |
| 5 or more Children | 0 (0.0%) | 0 (0.0%) |
| Total | 8 (53.3%) | 7 (4.5%) |
Income Below Poverty Among Married-Couple vs Single-Parent Households in Grantville
The poverty data for Grantville shows that 32 of the married-couple family households (5.1%) and 15 of the single-parent households (8.9%) are living below the poverty level. Within the married-couple family households, those with no children have the highest poverty rate, with 27 households (6.9%) falling below the poverty line. Among the single-parent households, those with 1 or 2 children have the highest poverty rate, with 15 household (12.6%) living below poverty.
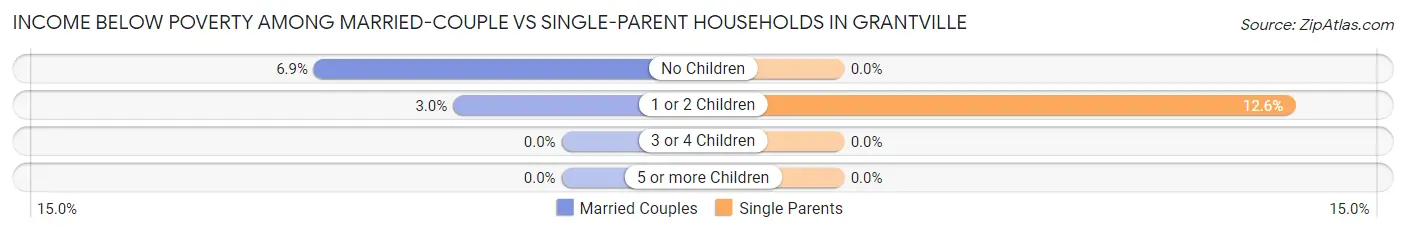
| Children | Married-Couple Families | Single-Parent Households |
| No Children | 27 (6.9%) | 0 (0.0%) |
| 1 or 2 Children | 5 (3.0%) | 15 (12.6%) |
| 3 or 4 Children | 0 (0.0%) | 0 (0.0%) |
| 5 or more Children | 0 (0.0%) | 0 (0.0%) |
| Total | 32 (5.1%) | 15 (8.9%) |
Race in Grantville
The most populous races in Grantville are White / Caucasian (2,164 | 68.2%), Black / African American (807 | 25.4%), and Two or more Races (104 | 3.3%).
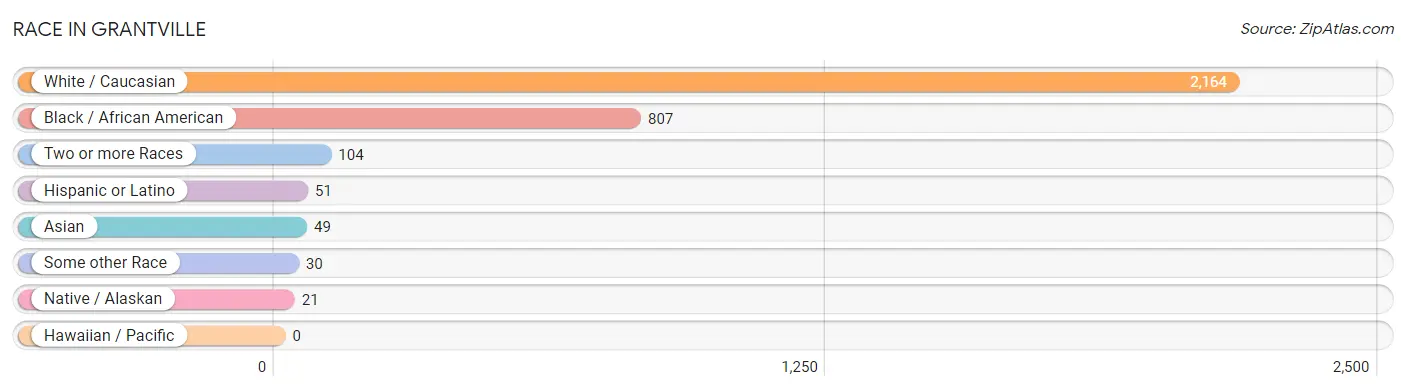
| Race | # Population | % Population |
| Asian | 49 | 1.5% |
| Black / African American | 807 | 25.4% |
| Hawaiian / Pacific | 0 | 0.0% |
| Hispanic or Latino | 51 | 1.6% |
| Native / Alaskan | 21 | 0.7% |
| White / Caucasian | 2,164 | 68.2% |
| Two or more Races | 104 | 3.3% |
| Some other Race | 30 | 0.9% |
| Total | 3,175 | 100.0% |
Ancestry in Grantville
The most populous ancestries reported in Grantville are American (472 | 14.9%), English (388 | 12.2%), Irish (187 | 5.9%), German (140 | 4.4%), and French (72 | 2.3%), together accounting for 39.7% of all Grantville residents.
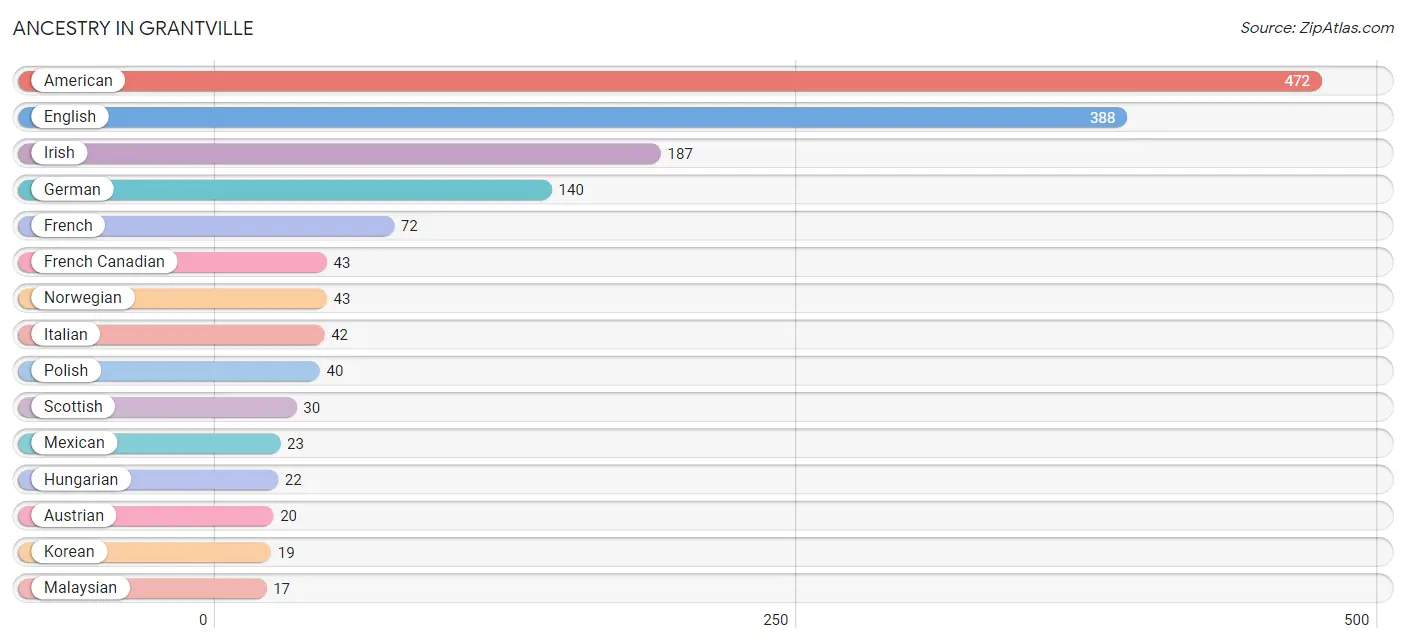
| Ancestry | # Population | % Population |
| American | 472 | 14.9% |
| Austrian | 20 | 0.6% |
| British | 7 | 0.2% |
| Burmese | 3 | 0.1% |
| Canadian | 7 | 0.2% |
| Cherokee | 11 | 0.4% |
| Cuban | 9 | 0.3% |
| English | 388 | 12.2% |
| European | 6 | 0.2% |
| French | 72 | 2.3% |
| French Canadian | 43 | 1.3% |
| German | 140 | 4.4% |
| Greek | 5 | 0.2% |
| Hungarian | 22 | 0.7% |
| Irish | 187 | 5.9% |
| Italian | 42 | 1.3% |
| Korean | 19 | 0.6% |
| Malaysian | 17 | 0.5% |
| Mexican | 23 | 0.7% |
| Norwegian | 43 | 1.3% |
| Polish | 40 | 1.3% |
| Scandinavian | 6 | 0.2% |
| Scotch-Irish | 12 | 0.4% |
| Scottish | 30 | 0.9% |
| South American | 9 | 0.3% |
| Sri Lankan | 13 | 0.4% |
| Swedish | 14 | 0.4% |
| Uruguayan | 9 | 0.3% |
| Welsh | 14 | 0.4% | View All 29 Rows |
Immigrants in Grantville
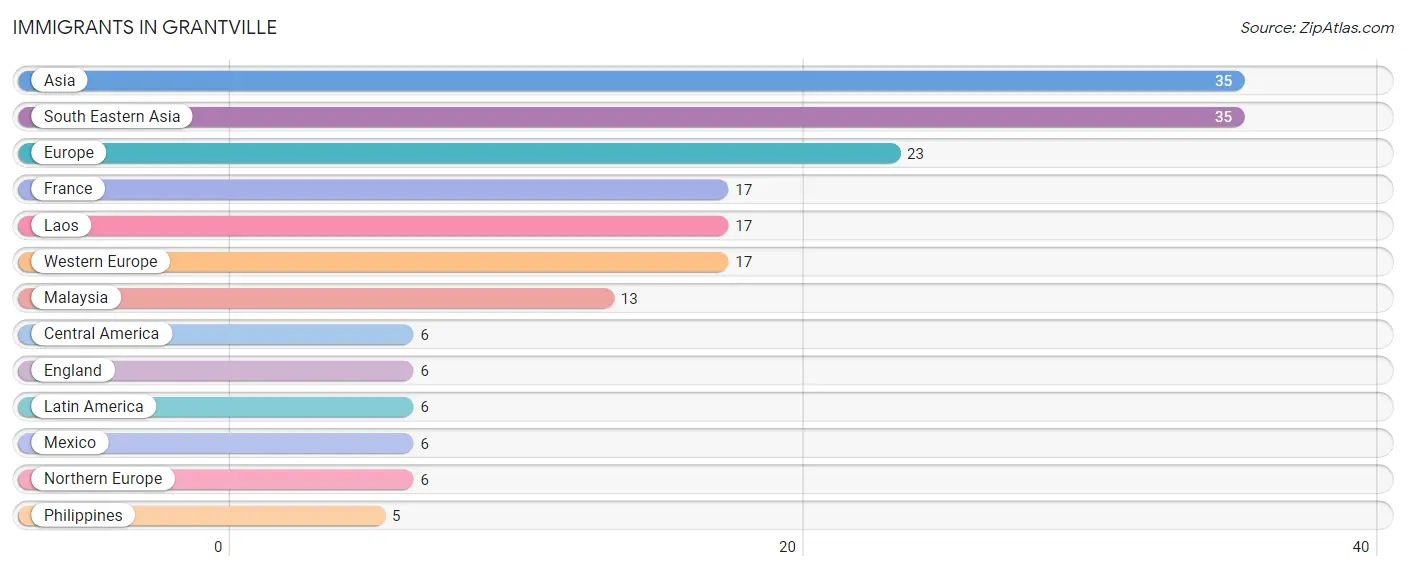
The most numerous immigrant groups reported in Grantville came from Asia (35 | 1.1%), South Eastern Asia (35 | 1.1%), Europe (23 | 0.7%), France (17 | 0.5%), and Laos (17 | 0.5%), together accounting for 4.0% of all Grantville residents.
| Immigration Origin | # Population | % Population |
| Asia | 35 | 1.1% |
| Central America | 6 | 0.2% |
| England | 6 | 0.2% |
| Europe | 23 | 0.7% |
| France | 17 | 0.5% |
| Laos | 17 | 0.5% |
| Latin America | 6 | 0.2% |
| Malaysia | 13 | 0.4% |
| Mexico | 6 | 0.2% |
| Northern Europe | 6 | 0.2% |
| Philippines | 5 | 0.2% |
| South Eastern Asia | 35 | 1.1% |
| Western Europe | 17 | 0.5% | View All 13 Rows |
Sex and Age in Grantville
Sex and Age in Grantville
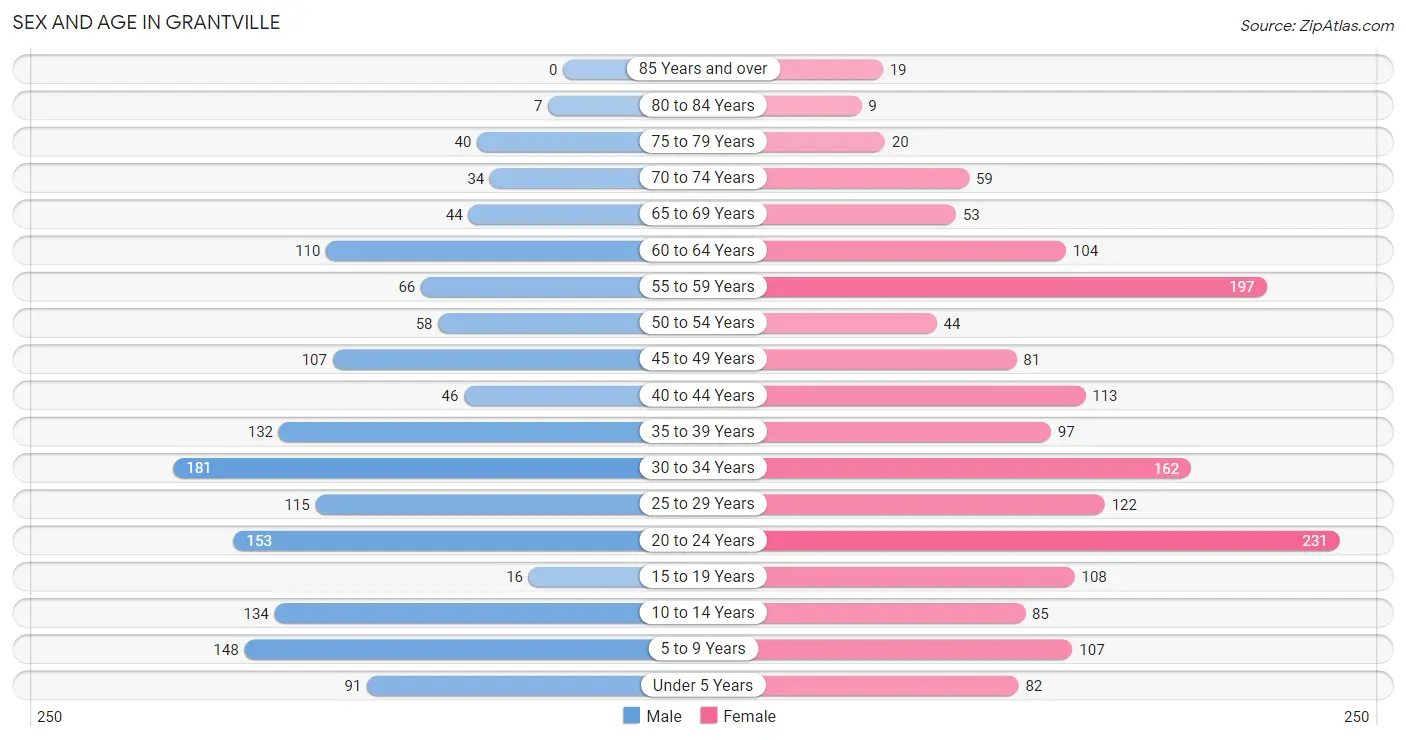
The most populous age groups in Grantville are 30 to 34 Years (181 | 12.2%) for men and 20 to 24 Years (231 | 13.6%) for women.
| Age Bracket | Male | Female |
| Under 5 Years | 91 (6.1%) | 82 (4.8%) |
| 5 to 9 Years | 148 (10.0%) | 107 (6.3%) |
| 10 to 14 Years | 134 (9.0%) | 85 (5.0%) |
| 15 to 19 Years | 16 (1.1%) | 108 (6.4%) |
| 20 to 24 Years | 153 (10.3%) | 231 (13.6%) |
| 25 to 29 Years | 115 (7.8%) | 122 (7.2%) |
| 30 to 34 Years | 181 (12.2%) | 162 (9.6%) |
| 35 to 39 Years | 132 (8.9%) | 97 (5.7%) |
| 40 to 44 Years | 46 (3.1%) | 113 (6.7%) |
| 45 to 49 Years | 107 (7.2%) | 81 (4.8%) |
| 50 to 54 Years | 58 (3.9%) | 44 (2.6%) |
| 55 to 59 Years | 66 (4.4%) | 197 (11.6%) |
| 60 to 64 Years | 110 (7.4%) | 104 (6.1%) |
| 65 to 69 Years | 44 (3.0%) | 53 (3.1%) |
| 70 to 74 Years | 34 (2.3%) | 59 (3.5%) |
| 75 to 79 Years | 40 (2.7%) | 20 (1.2%) |
| 80 to 84 Years | 7 (0.5%) | 9 (0.5%) |
| 85 Years and over | 0 (0.0%) | 19 (1.1%) |
| Total | 1,482 (100.0%) | 1,693 (100.0%) |
Families and Households in Grantville
Median Family Size in Grantville
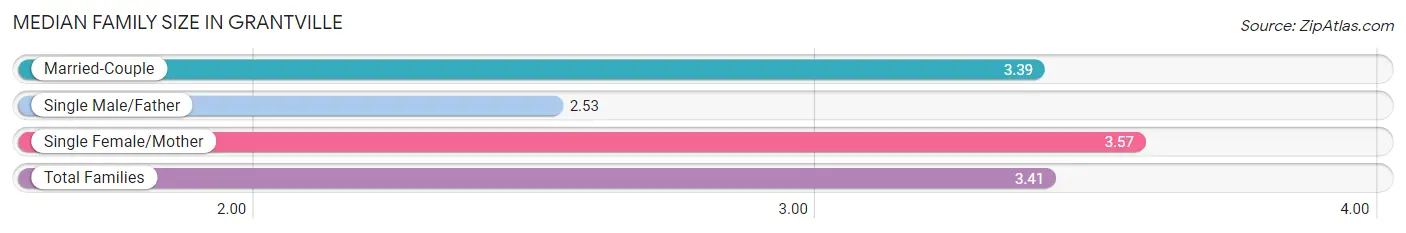
The median family size in Grantville is 3.41 persons per family, with single female/mother families (154 | 19.2%) accounting for the largest median family size of 3.57 persons per family. On the other hand, single male/father families (15 | 1.9%) represent the smallest median family size with 2.53 persons per family.
| Family Type | # Families | Family Size |
| Married-Couple | 634 (78.9%) | 3.39 |
| Single Male/Father | 15 (1.9%) | 2.53 |
| Single Female/Mother | 154 (19.2%) | 3.57 |
| Total Families | 803 (100.0%) | 3.41 |
Median Household Size in Grantville
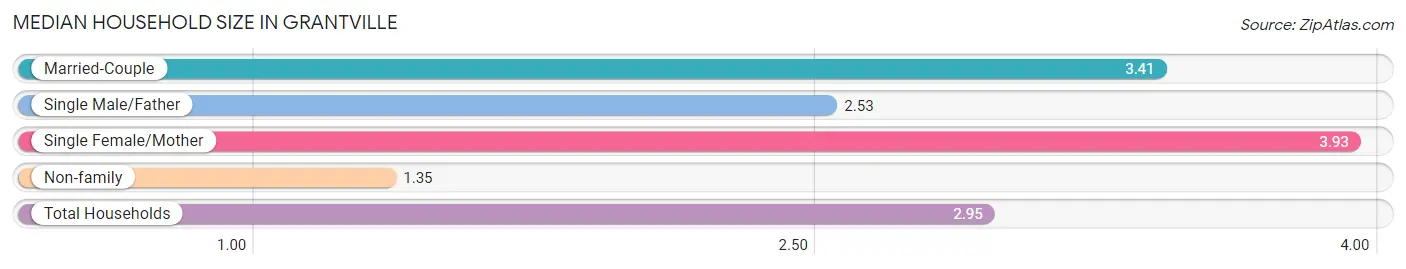
The median household size in Grantville is 2.95 persons per household, with single female/mother households (154 | 14.3%) accounting for the largest median household size of 3.93 persons per household. non-family households (272 | 25.3%) represent the smallest median household size with 1.35 persons per household.
| Household Type | # Households | Household Size |
| Married-Couple | 634 (59.0%) | 3.41 |
| Single Male/Father | 15 (1.4%) | 2.53 |
| Single Female/Mother | 154 (14.3%) | 3.93 |
| Non-family | 272 (25.3%) | 1.35 |
| Total Households | 1,075 (100.0%) | 2.95 |
Household Size by Marriage Status in Grantville
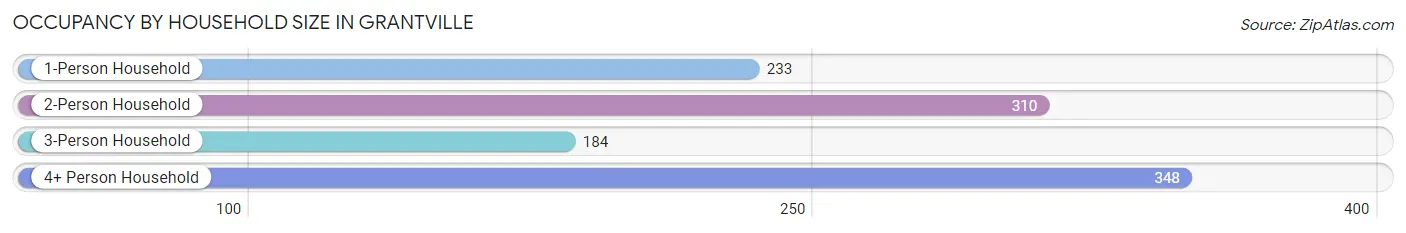
Out of a total of 1,075 households in Grantville, 803 (74.7%) are family households, while 272 (25.3%) are nonfamily households. The most numerous type of family households are 2-person households, comprising 297, and the most common type of nonfamily households are 1-person households, comprising 233.
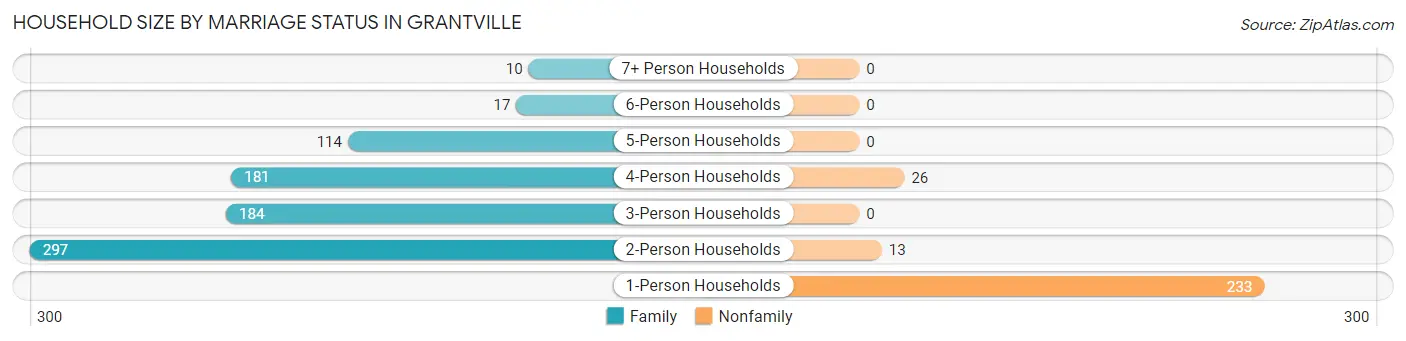
| Household Size | Family Households | Nonfamily Households |
| 1-Person Households | - | 233 (21.7%) |
| 2-Person Households | 297 (27.6%) | 13 (1.2%) |
| 3-Person Households | 184 (17.1%) | 0 (0.0%) |
| 4-Person Households | 181 (16.8%) | 26 (2.4%) |
| 5-Person Households | 114 (10.6%) | 0 (0.0%) |
| 6-Person Households | 17 (1.6%) | 0 (0.0%) |
| 7+ Person Households | 10 (0.9%) | 0 (0.0%) |
| Total | 803 (74.7%) | 272 (25.3%) |
Female Fertility in Grantville
Fertility by Age in Grantville
Average fertility rate in Grantville is 54.0 births per 1,000 women. Women in the age bracket of 20 to 34 years have the highest fertility rate with 78.0 births per 1,000 women. Women in the age bracket of 20 to 34 years acount for 80.0% of all women with births.
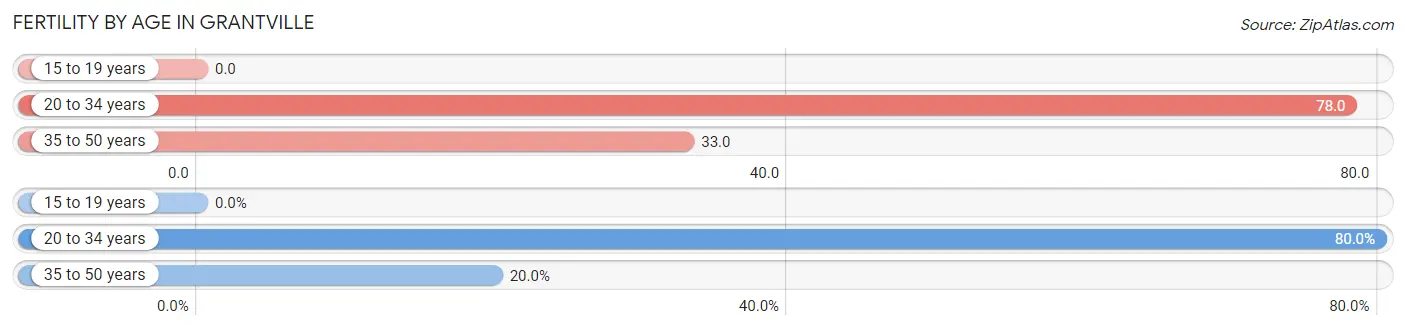
| Age Bracket | Women with Births | Births / 1,000 Women |
| 15 to 19 years | 0 (0.0%) | 0.0 |
| 20 to 34 years | 40 (80.0%) | 78.0 |
| 35 to 50 years | 10 (20.0%) | 33.0 |
| Total | 50 (100.0%) | 54.0 |
Fertility by Age by Marriage Status in Grantville
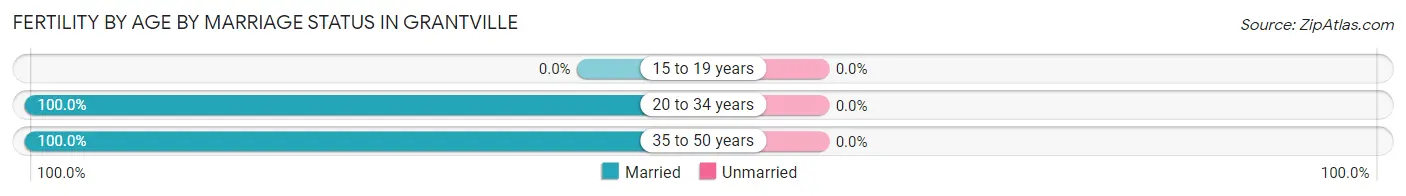
| Age Bracket | Married | Unmarried |
| 15 to 19 years | 0 (0.0%) | 0 (0.0%) |
| 20 to 34 years | 40 (100.0%) | 0 (0.0%) |
| 35 to 50 years | 10 (100.0%) | 0 (0.0%) |
| Total | 50 (100.0%) | 0 (0.0%) |
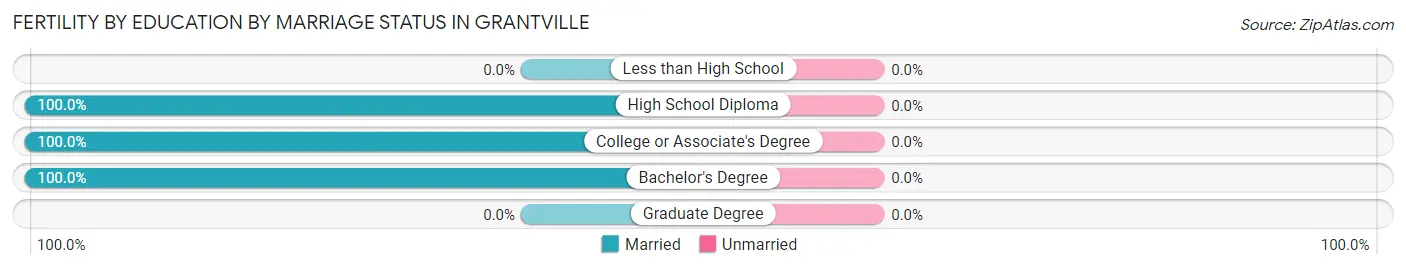
Fertility by Education in Grantville
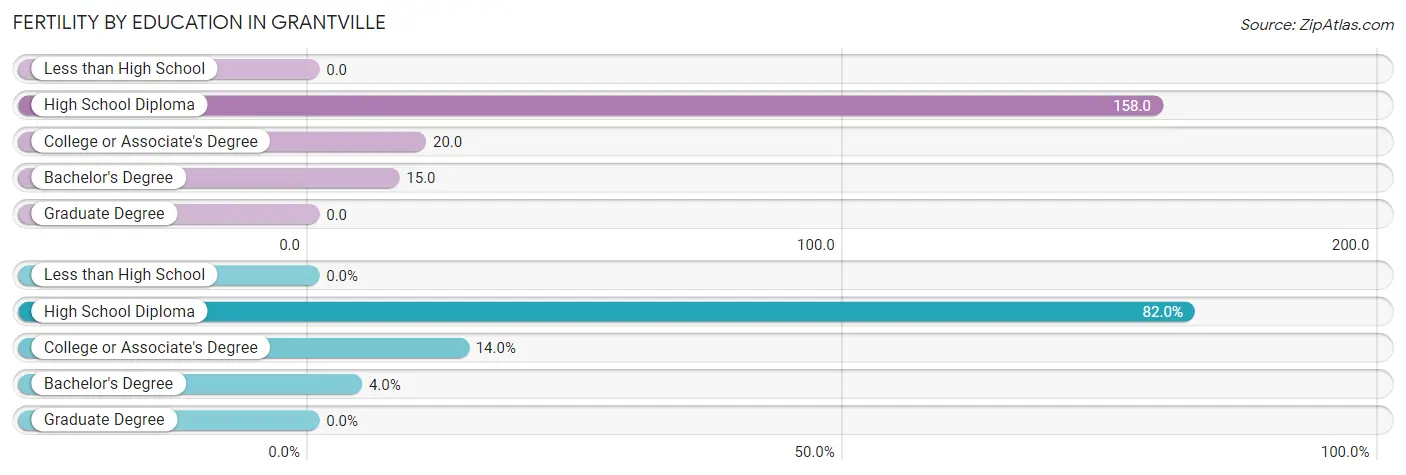
| Educational Attainment | Women with Births | Births / 1,000 Women |
| Less than High School | 0 (0.0%) | 0.0 |
| High School Diploma | 41 (82.0%) | 158.0 |
| College or Associate's Degree | 7 (14.0%) | 20.0 |
| Bachelor's Degree | 2 (4.0%) | 15.0 |
| Graduate Degree | 0 (0.0%) | 0.0 |
| Total | 50 (100.0%) | 54.0 |
Fertility by Education by Marriage Status in Grantville
| Educational Attainment | Married | Unmarried |
| Less than High School | 0 (0.0%) | 0 (0.0%) |
| High School Diploma | 41 (100.0%) | 0 (0.0%) |
| College or Associate's Degree | 7 (100.0%) | 0 (0.0%) |
| Bachelor's Degree | 2 (100.0%) | 0 (0.0%) |
| Graduate Degree | 0 (0.0%) | 0 (0.0%) |
| Total | 50 (100.0%) | 0 (0.0%) |
Employment Characteristics in Grantville
Employment by Class of Employer in Grantville
Among the 1,715 employed individuals in Grantville, private company employees (1,300 | 75.8%), local government employees (126 | 7.3%), and state government employees (81 | 4.7%) make up the most common classes of employment.
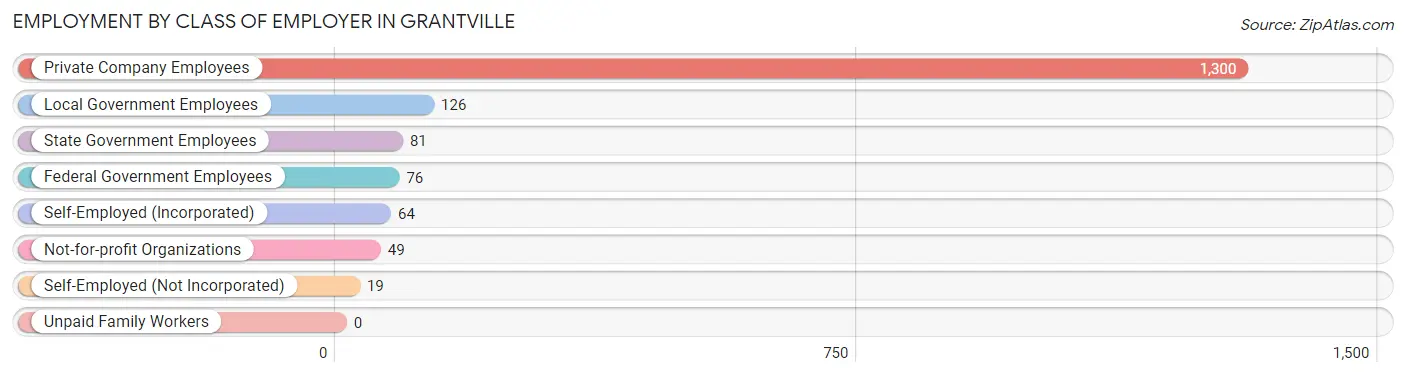
| Employer Class | # Employees | % Employees |
| Private Company Employees | 1,300 | 75.8% |
| Self-Employed (Incorporated) | 64 | 3.7% |
| Self-Employed (Not Incorporated) | 19 | 1.1% |
| Not-for-profit Organizations | 49 | 2.9% |
| Local Government Employees | 126 | 7.3% |
| State Government Employees | 81 | 4.7% |
| Federal Government Employees | 76 | 4.4% |
| Unpaid Family Workers | 0 | 0.0% |
| Total | 1,715 | 100.0% |
Employment Status by Age in Grantville
According to the labor force statistics for Grantville, out of the total population over 16 years of age (2,517), 70.6% or 1,777 individuals are in the labor force, with 3.2% or 57 of them unemployed. The age group with the highest labor force participation rate is 25 to 29 years, with 97.5% or 231 individuals in the labor force. Within the labor force, the 16 to 19 years age range has the highest percentage of unemployed individuals, with 29.4% or 5 of them being unemployed.
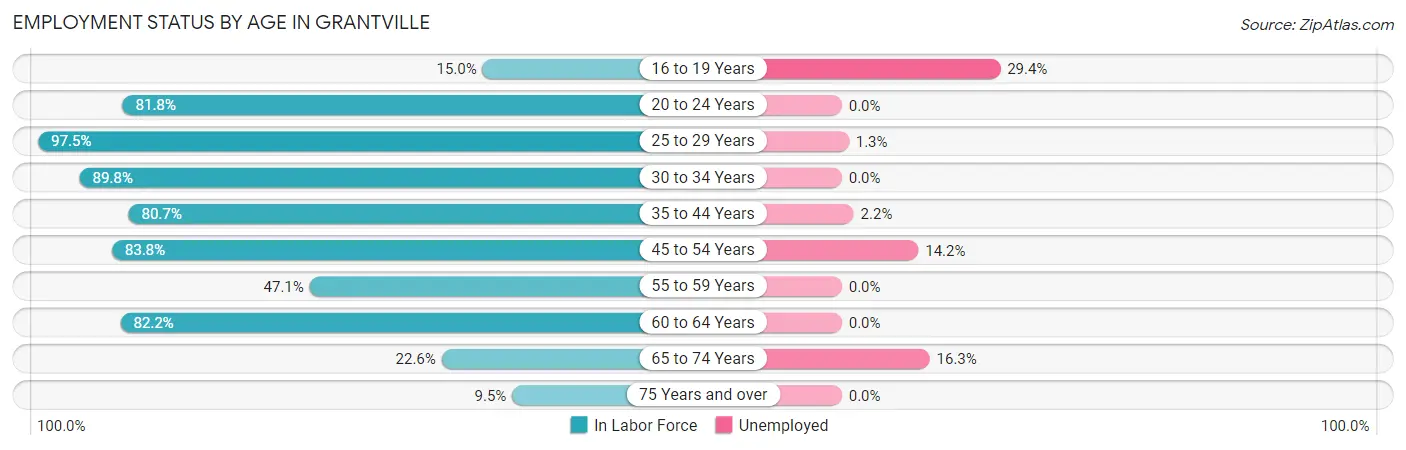
| Age Bracket | In Labor Force | Unemployed |
| 16 to 19 Years | 17 (15.0%) | 5 (29.4%) |
| 20 to 24 Years | 314 (81.8%) | 0 (0.0%) |
| 25 to 29 Years | 231 (97.5%) | 3 (1.3%) |
| 30 to 34 Years | 308 (89.8%) | 0 (0.0%) |
| 35 to 44 Years | 313 (80.7%) | 7 (2.2%) |
| 45 to 54 Years | 243 (83.8%) | 35 (14.2%) |
| 55 to 59 Years | 124 (47.1%) | 0 (0.0%) |
| 60 to 64 Years | 176 (82.2%) | 0 (0.0%) |
| 65 to 74 Years | 43 (22.6%) | 7 (16.3%) |
| 75 Years and over | 9 (9.5%) | 0 (0.0%) |
| Total | 1,777 (70.6%) | 57 (3.2%) |
Employment Status by Educational Attainment in Grantville
According to labor force statistics for Grantville, 80.4% of individuals (1,395) out of the total population between 25 and 64 years of age (1,735) are in the labor force, with 3.2% or 45 of them being unemployed. The group with the highest labor force participation rate are those with the educational attainment of bachelor's degree or higher, with 90.1% or 192 individuals in the labor force. Within the labor force, individuals with high school diploma education have the highest percentage of unemployment, with 5.8% or 26 of them being unemployed.
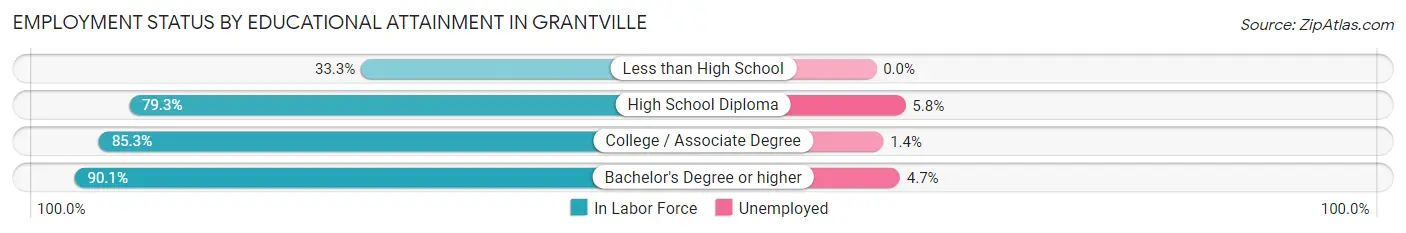
| Educational Attainment | In Labor Force | Unemployed |
| Less than High School | 40 (33.3%) | 0 (0.0%) |
| High School Diploma | 441 (79.3%) | 32 (5.8%) |
| College / Associate Degree | 722 (85.3%) | 12 (1.4%) |
| Bachelor's Degree or higher | 192 (90.1%) | 10 (4.7%) |
| Total | 1,395 (80.4%) | 56 (3.2%) |
Employment Occupations by Sex in Grantville
Management, Business, Science and Arts Occupations
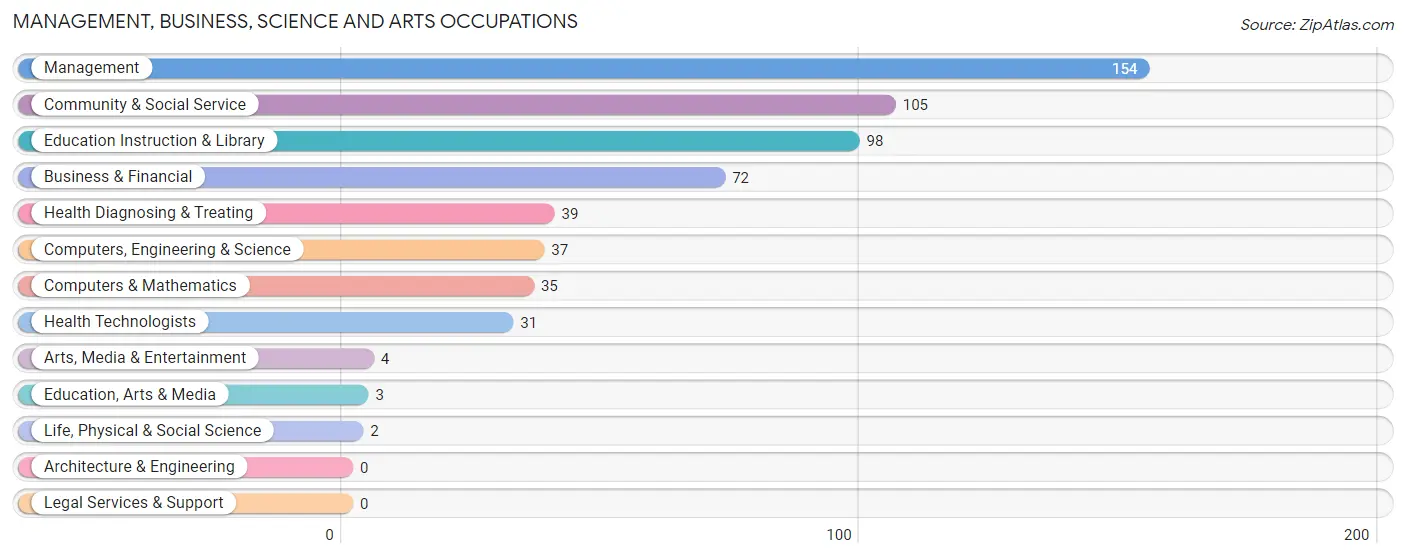
The most common Management, Business, Science and Arts occupations in Grantville are Management (154 | 9.0%), Community & Social Service (105 | 6.1%), Education Instruction & Library (98 | 5.7%), Business & Financial (72 | 4.2%), and Health Diagnosing & Treating (39 | 2.3%).
Management, Business, Science and Arts Occupations by Sex
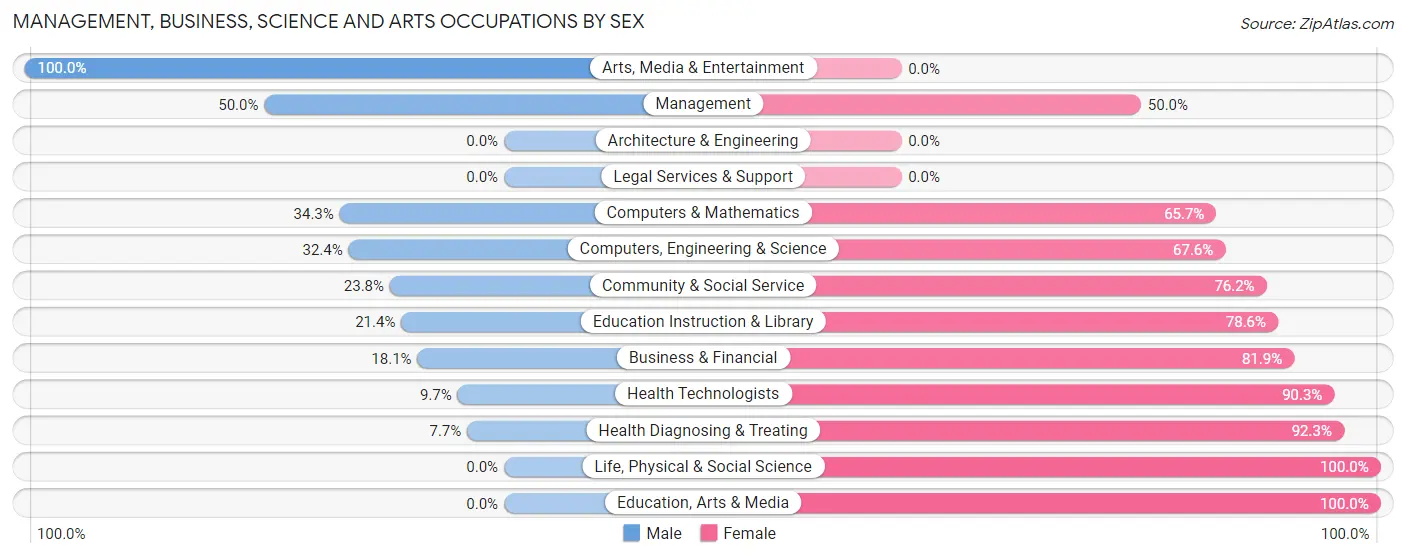
Within the Management, Business, Science and Arts occupations in Grantville, the most male-oriented occupations are Arts, Media & Entertainment (100.0%), Management (50.0%), and Computers & Mathematics (34.3%), while the most female-oriented occupations are Life, Physical & Social Science (100.0%), Education, Arts & Media (100.0%), and Health Diagnosing & Treating (92.3%).
| Occupation | Male | Female |
| Management | 77 (50.0%) | 77 (50.0%) |
| Business & Financial | 13 (18.1%) | 59 (81.9%) |
| Computers, Engineering & Science | 12 (32.4%) | 25 (67.6%) |
| Computers & Mathematics | 12 (34.3%) | 23 (65.7%) |
| Architecture & Engineering | 0 (0.0%) | 0 (0.0%) |
| Life, Physical & Social Science | 0 (0.0%) | 2 (100.0%) |
| Community & Social Service | 25 (23.8%) | 80 (76.2%) |
| Education, Arts & Media | 0 (0.0%) | 3 (100.0%) |
| Legal Services & Support | 0 (0.0%) | 0 (0.0%) |
| Education Instruction & Library | 21 (21.4%) | 77 (78.6%) |
| Arts, Media & Entertainment | 4 (100.0%) | 0 (0.0%) |
| Health Diagnosing & Treating | 3 (7.7%) | 36 (92.3%) |
| Health Technologists | 3 (9.7%) | 28 (90.3%) |
| Total (Category) | 130 (31.9%) | 277 (68.1%) |
| Total (Overall) | 816 (47.8%) | 891 (52.2%) |
Services Occupations
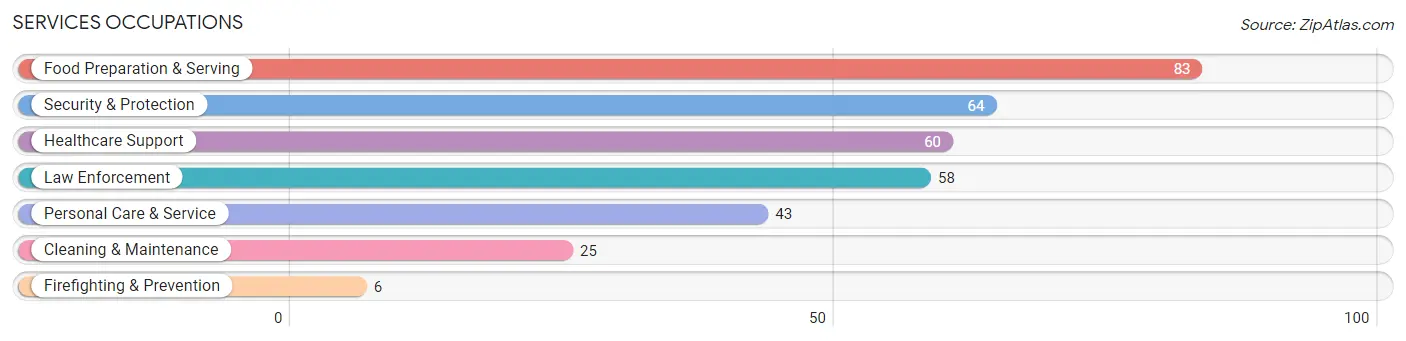
The most common Services occupations in Grantville are Food Preparation & Serving (83 | 4.9%), Security & Protection (64 | 3.7%), Healthcare Support (60 | 3.5%), Law Enforcement (58 | 3.4%), and Personal Care & Service (43 | 2.5%).
Services Occupations by Sex
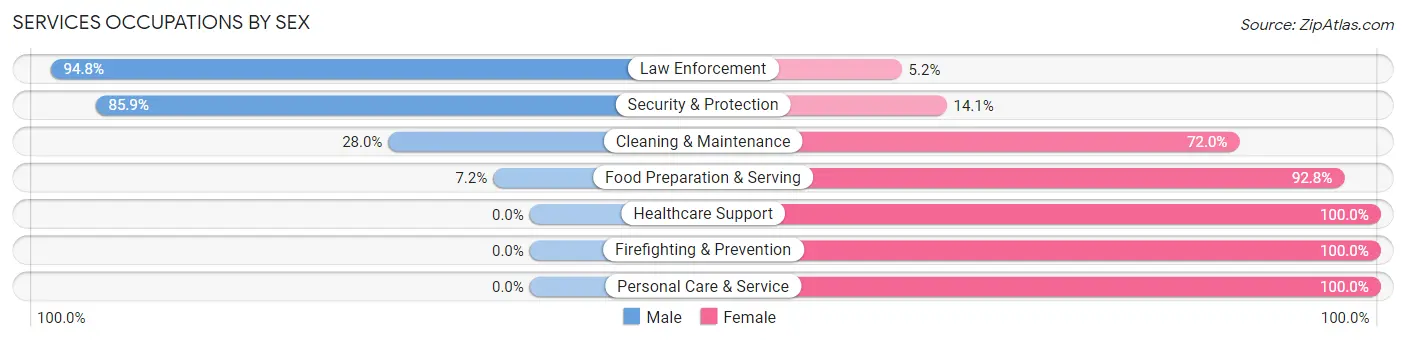
Within the Services occupations in Grantville, the most male-oriented occupations are Law Enforcement (94.8%), Security & Protection (85.9%), and Cleaning & Maintenance (28.0%), while the most female-oriented occupations are Healthcare Support (100.0%), Firefighting & Prevention (100.0%), and Personal Care & Service (100.0%).
| Occupation | Male | Female |
| Healthcare Support | 0 (0.0%) | 60 (100.0%) |
| Security & Protection | 55 (85.9%) | 9 (14.1%) |
| Firefighting & Prevention | 0 (0.0%) | 6 (100.0%) |
| Law Enforcement | 55 (94.8%) | 3 (5.2%) |
| Food Preparation & Serving | 6 (7.2%) | 77 (92.8%) |
| Cleaning & Maintenance | 7 (28.0%) | 18 (72.0%) |
| Personal Care & Service | 0 (0.0%) | 43 (100.0%) |
| Total (Category) | 68 (24.7%) | 207 (75.3%) |
| Total (Overall) | 816 (47.8%) | 891 (52.2%) |
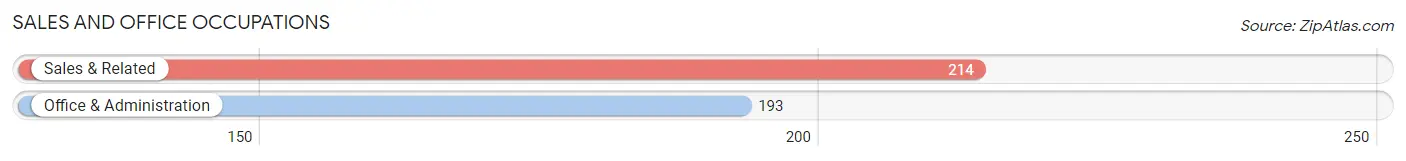
Sales and Office Occupations
The most common Sales and Office occupations in Grantville are Sales & Related (214 | 12.5%), and Office & Administration (193 | 11.3%).
Sales and Office Occupations by Sex
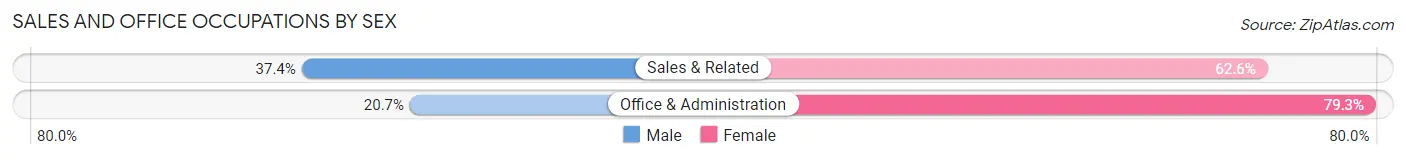
| Occupation | Male | Female |
| Sales & Related | 80 (37.4%) | 134 (62.6%) |
| Office & Administration | 40 (20.7%) | 153 (79.3%) |
| Total (Category) | 120 (29.5%) | 287 (70.5%) |
| Total (Overall) | 816 (47.8%) | 891 (52.2%) |
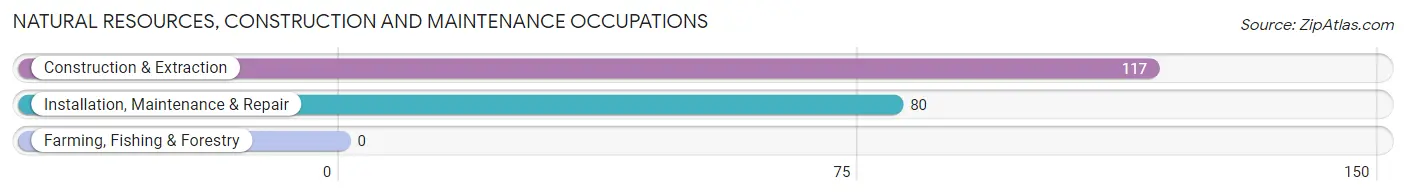
Natural Resources, Construction and Maintenance Occupations
The most common Natural Resources, Construction and Maintenance occupations in Grantville are Construction & Extraction (117 | 6.9%), and Installation, Maintenance & Repair (80 | 4.7%).
Natural Resources, Construction and Maintenance Occupations by Sex
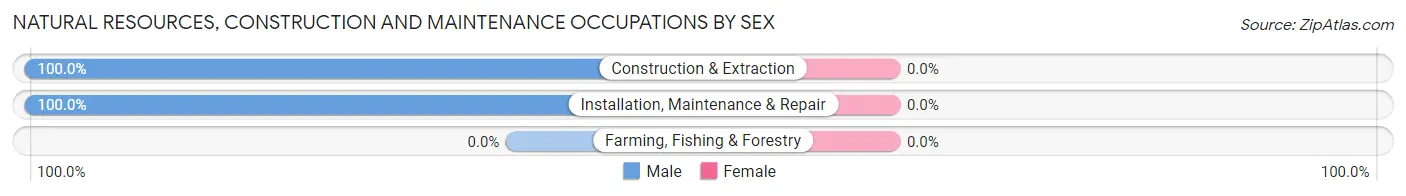
| Occupation | Male | Female |
| Farming, Fishing & Forestry | 0 (0.0%) | 0 (0.0%) |
| Construction & Extraction | 117 (100.0%) | 0 (0.0%) |
| Installation, Maintenance & Repair | 80 (100.0%) | 0 (0.0%) |
| Total (Category) | 197 (100.0%) | 0 (0.0%) |
| Total (Overall) | 816 (47.8%) | 891 (52.2%) |
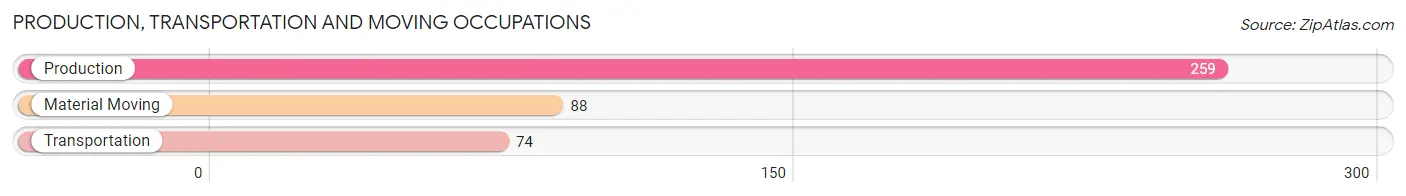
Production, Transportation and Moving Occupations
The most common Production, Transportation and Moving occupations in Grantville are Production (259 | 15.2%), Material Moving (88 | 5.2%), and Transportation (74 | 4.3%).
Production, Transportation and Moving Occupations by Sex
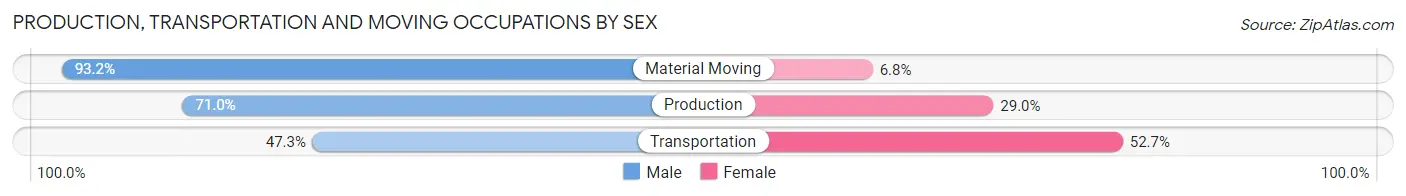
| Occupation | Male | Female |
| Production | 184 (71.0%) | 75 (29.0%) |
| Transportation | 35 (47.3%) | 39 (52.7%) |
| Material Moving | 82 (93.2%) | 6 (6.8%) |
| Total (Category) | 301 (71.5%) | 120 (28.5%) |
| Total (Overall) | 816 (47.8%) | 891 (52.2%) |
Employment Industries by Sex in Grantville
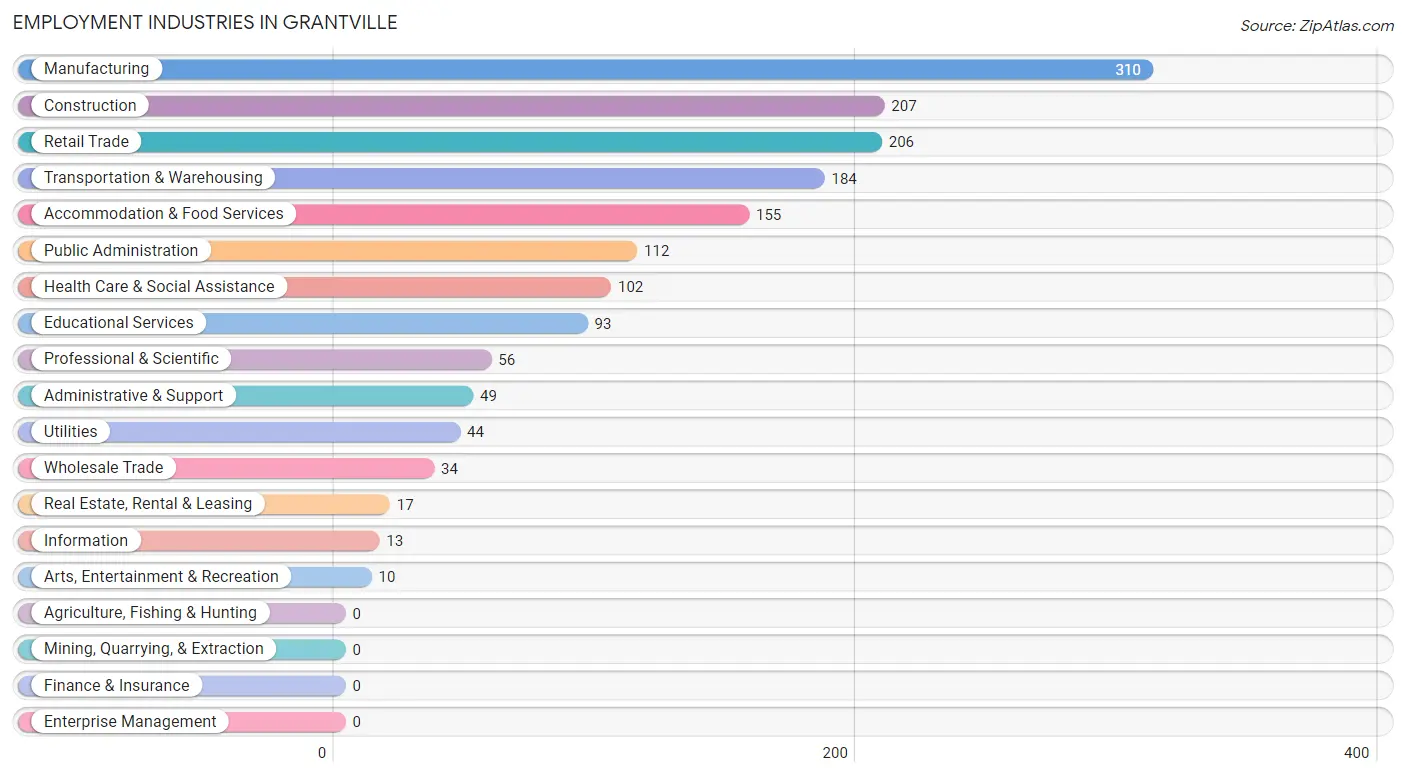
Employment Industries in Grantville
The major employment industries in Grantville include Manufacturing (310 | 18.2%), Construction (207 | 12.1%), Retail Trade (206 | 12.1%), Transportation & Warehousing (184 | 10.8%), and Accommodation & Food Services (155 | 9.1%).
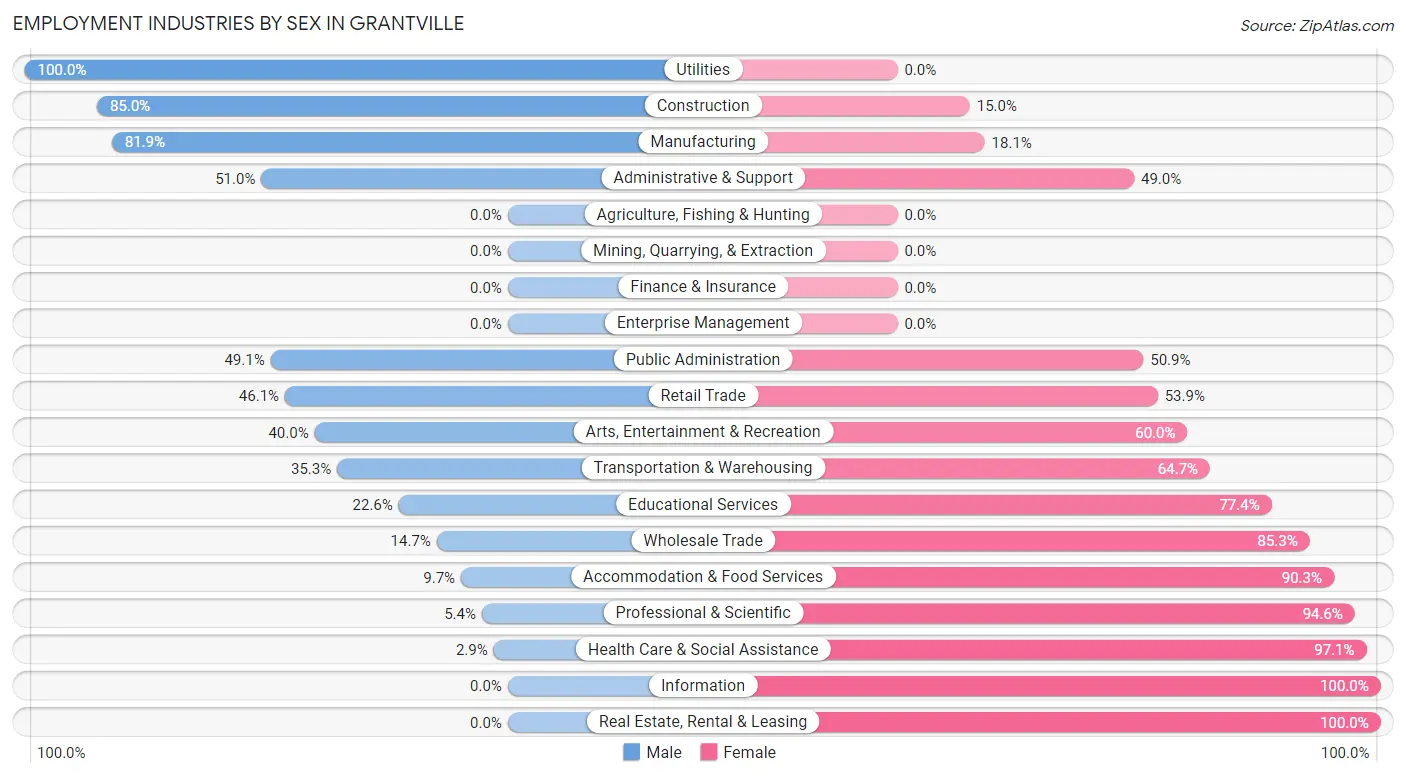
Employment Industries by Sex in Grantville
The Grantville industries that see more men than women are Utilities (100.0%), Construction (85.0%), and Manufacturing (81.9%), whereas the industries that tend to have a higher number of women are Information (100.0%), Real Estate, Rental & Leasing (100.0%), and Health Care & Social Assistance (97.1%).
| Industry | Male | Female |
| Agriculture, Fishing & Hunting | 0 (0.0%) | 0 (0.0%) |
| Mining, Quarrying, & Extraction | 0 (0.0%) | 0 (0.0%) |
| Construction | 176 (85.0%) | 31 (15.0%) |
| Manufacturing | 254 (81.9%) | 56 (18.1%) |
| Wholesale Trade | 5 (14.7%) | 29 (85.3%) |
| Retail Trade | 95 (46.1%) | 111 (53.9%) |
| Transportation & Warehousing | 65 (35.3%) | 119 (64.7%) |
| Utilities | 44 (100.0%) | 0 (0.0%) |
| Information | 0 (0.0%) | 13 (100.0%) |
| Finance & Insurance | 0 (0.0%) | 0 (0.0%) |
| Real Estate, Rental & Leasing | 0 (0.0%) | 17 (100.0%) |
| Professional & Scientific | 3 (5.4%) | 53 (94.6%) |
| Enterprise Management | 0 (0.0%) | 0 (0.0%) |
| Administrative & Support | 25 (51.0%) | 24 (49.0%) |
| Educational Services | 21 (22.6%) | 72 (77.4%) |
| Health Care & Social Assistance | 3 (2.9%) | 99 (97.1%) |
| Arts, Entertainment & Recreation | 4 (40.0%) | 6 (60.0%) |
| Accommodation & Food Services | 15 (9.7%) | 140 (90.3%) |
| Public Administration | 55 (49.1%) | 57 (50.9%) |
| Total | 816 (47.8%) | 891 (52.2%) |
Education in Grantville
School Enrollment in Grantville
The most common levels of schooling among the 857 students in Grantville are elementary school (235 | 27.4%), high school (173 | 20.2%), and college / undergraduate (173 | 20.2%).
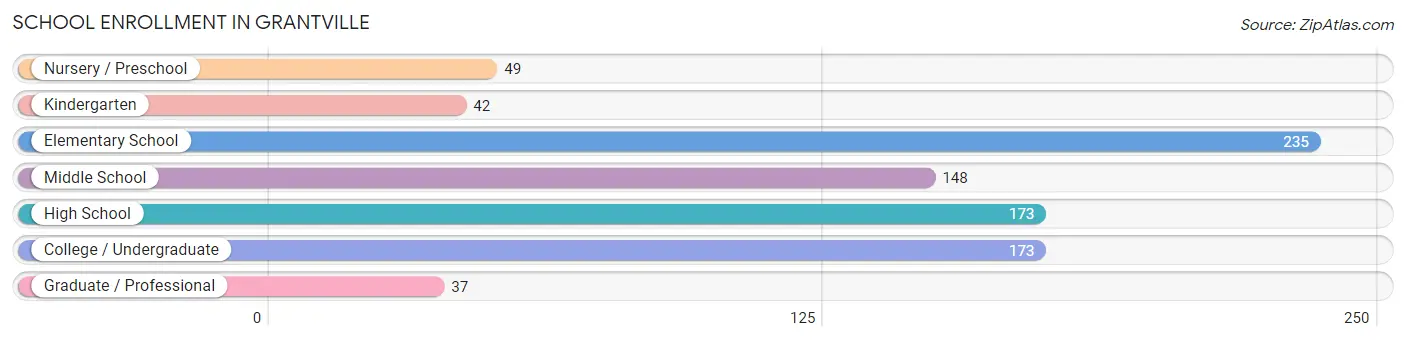
| School Level | # Students | % Students |
| Nursery / Preschool | 49 | 5.7% |
| Kindergarten | 42 | 4.9% |
| Elementary School | 235 | 27.4% |
| Middle School | 148 | 17.3% |
| High School | 173 | 20.2% |
| College / Undergraduate | 173 | 20.2% |
| Graduate / Professional | 37 | 4.3% |
| Total | 857 | 100.0% |
School Enrollment by Age by Funding Source in Grantville
Out of a total of 857 students who are enrolled in schools in Grantville, 158 (18.4%) attend a private institution, while the remaining 699 (81.6%) are enrolled in public schools. The age group of 25 to 34 year olds has the highest likelihood of being enrolled in private schools, with 50 (72.5% in the age bracket) enrolled. Conversely, the age group of 15 to 17 year olds has the lowest likelihood of being enrolled in a private school, with 57 (100.0% in the age bracket) attending a public institution.
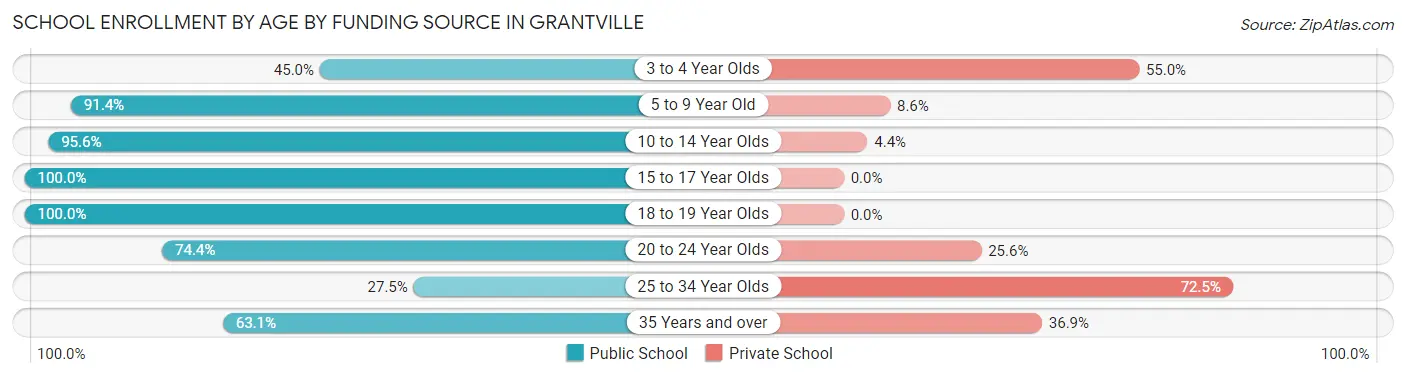
| Age Bracket | Public School | Private School |
| 3 to 4 Year Olds | 18 (45.0%) | 22 (55.0%) |
| 5 to 9 Year Old | 233 (91.4%) | 22 (8.6%) |
| 10 to 14 Year Olds | 195 (95.6%) | 9 (4.4%) |
| 15 to 17 Year Olds | 57 (100.0%) | 0 (0.0%) |
| 18 to 19 Year Olds | 46 (100.0%) | 0 (0.0%) |
| 20 to 24 Year Olds | 90 (74.4%) | 31 (25.6%) |
| 25 to 34 Year Olds | 19 (27.5%) | 50 (72.5%) |
| 35 Years and over | 41 (63.1%) | 24 (36.9%) |
| Total | 699 (81.6%) | 158 (18.4%) |
Educational Attainment by Field of Study in Grantville
Business (58 | 21.5%), psychology (38 | 14.1%), education (33 | 12.2%), liberal arts & history (32 | 11.8%), and science & technology (29 | 10.7%) are the most common fields of study among 270 individuals in Grantville who have obtained a bachelor's degree or higher.
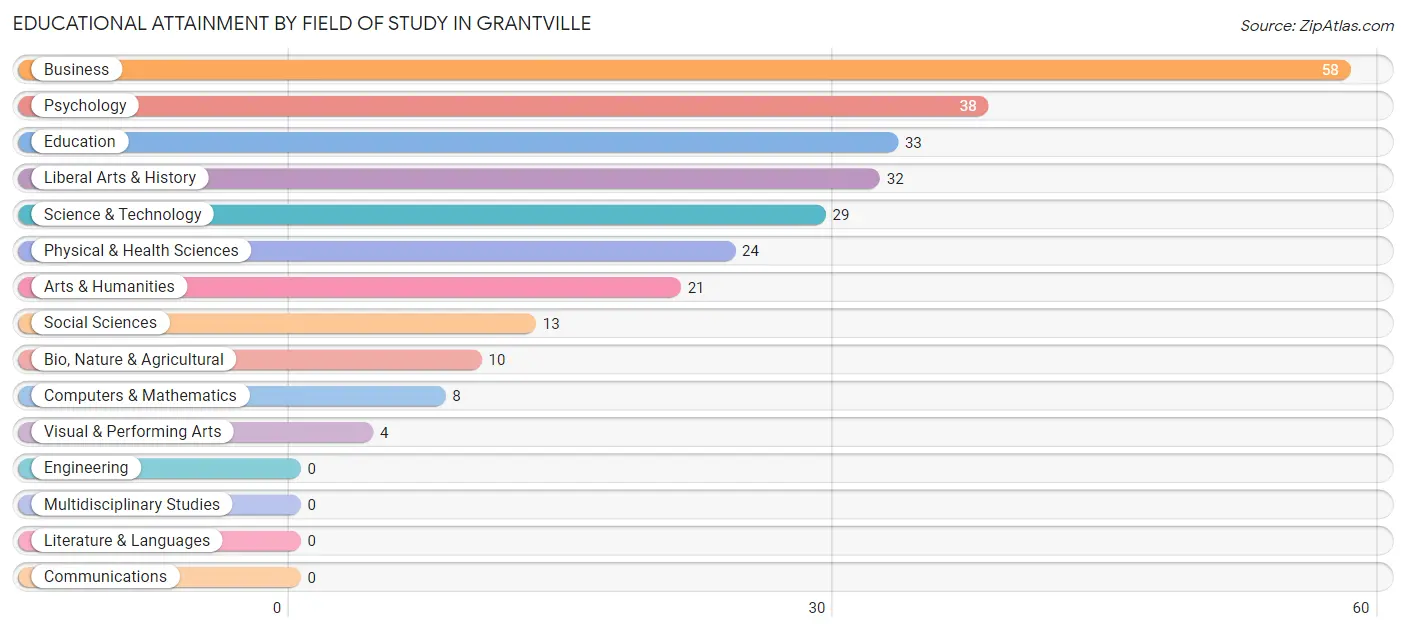
| Field of Study | # Graduates | % Graduates |
| Computers & Mathematics | 8 | 3.0% |
| Bio, Nature & Agricultural | 10 | 3.7% |
| Physical & Health Sciences | 24 | 8.9% |
| Psychology | 38 | 14.1% |
| Social Sciences | 13 | 4.8% |
| Engineering | 0 | 0.0% |
| Multidisciplinary Studies | 0 | 0.0% |
| Science & Technology | 29 | 10.7% |
| Business | 58 | 21.5% |
| Education | 33 | 12.2% |
| Literature & Languages | 0 | 0.0% |
| Liberal Arts & History | 32 | 11.8% |
| Visual & Performing Arts | 4 | 1.5% |
| Communications | 0 | 0.0% |
| Arts & Humanities | 21 | 7.8% |
| Total | 270 | 100.0% |
Transportation & Commute in Grantville
Vehicle Availability by Sex in Grantville
The most prevalent vehicle ownership categories in Grantville are males with 2 vehicles (313, accounting for 38.0%) and females with 2 vehicles (294, making up 35.1%).
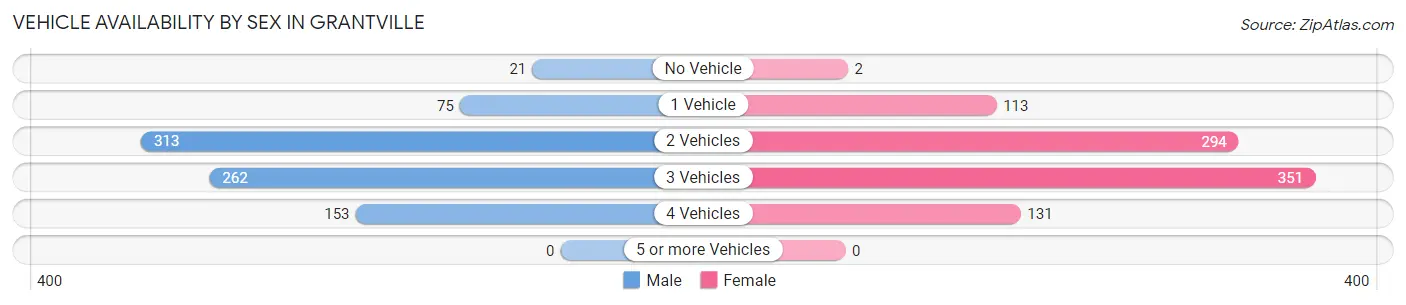
| Vehicles Available | Male | Female |
| No Vehicle | 21 (2.5%) | 2 (0.2%) |
| 1 Vehicle | 75 (9.1%) | 113 (12.7%) |
| 2 Vehicles | 313 (38.0%) | 294 (33.0%) |
| 3 Vehicles | 262 (31.8%) | 351 (39.4%) |
| 4 Vehicles | 153 (18.6%) | 131 (14.7%) |
| 5 or more Vehicles | 0 (0.0%) | 0 (0.0%) |
| Total | 824 (100.0%) | 891 (100.0%) |
Commute Time in Grantville
The most frequently occuring commute durations in Grantville are 30 to 34 minutes (387 commuters, 23.2%), 20 to 24 minutes (294 commuters, 17.6%), and 45 to 59 minutes (259 commuters, 15.5%).
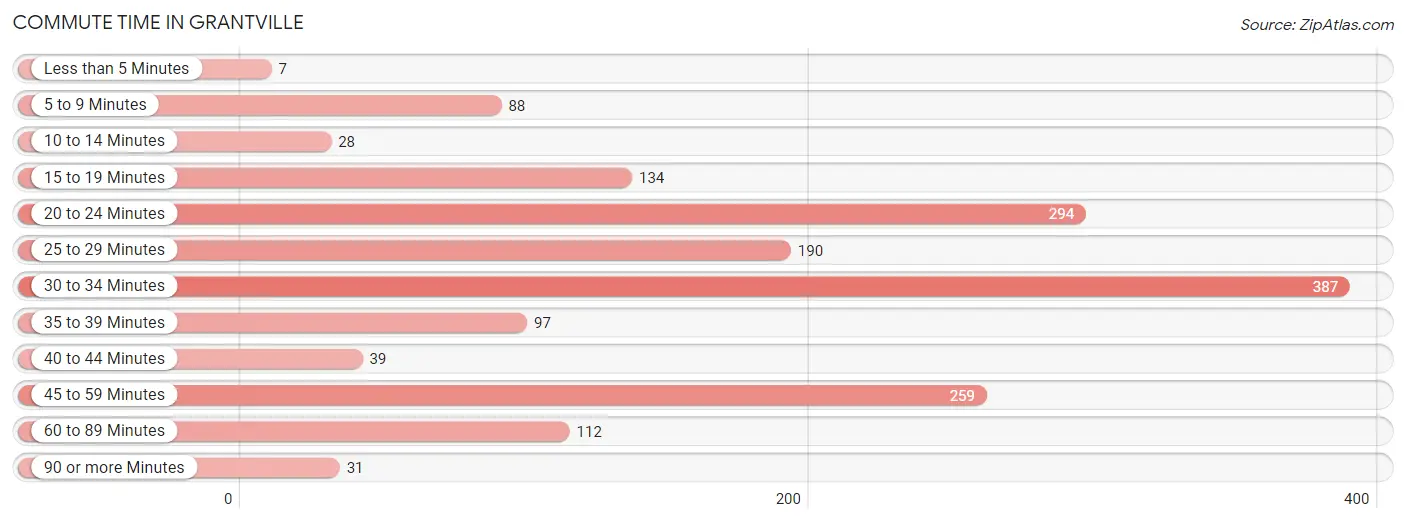
| Commute Time | # Commuters | % Commuters |
| Less than 5 Minutes | 7 | 0.4% |
| 5 to 9 Minutes | 88 | 5.3% |
| 10 to 14 Minutes | 28 | 1.7% |
| 15 to 19 Minutes | 134 | 8.0% |
| 20 to 24 Minutes | 294 | 17.6% |
| 25 to 29 Minutes | 190 | 11.4% |
| 30 to 34 Minutes | 387 | 23.2% |
| 35 to 39 Minutes | 97 | 5.8% |
| 40 to 44 Minutes | 39 | 2.3% |
| 45 to 59 Minutes | 259 | 15.5% |
| 60 to 89 Minutes | 112 | 6.7% |
| 90 or more Minutes | 31 | 1.9% |
Commute Time by Sex in Grantville
The most common commute times in Grantville are 20 to 24 minutes (175 commuters, 21.5%) for males and 30 to 34 minutes (255 commuters, 30.0%) for females.
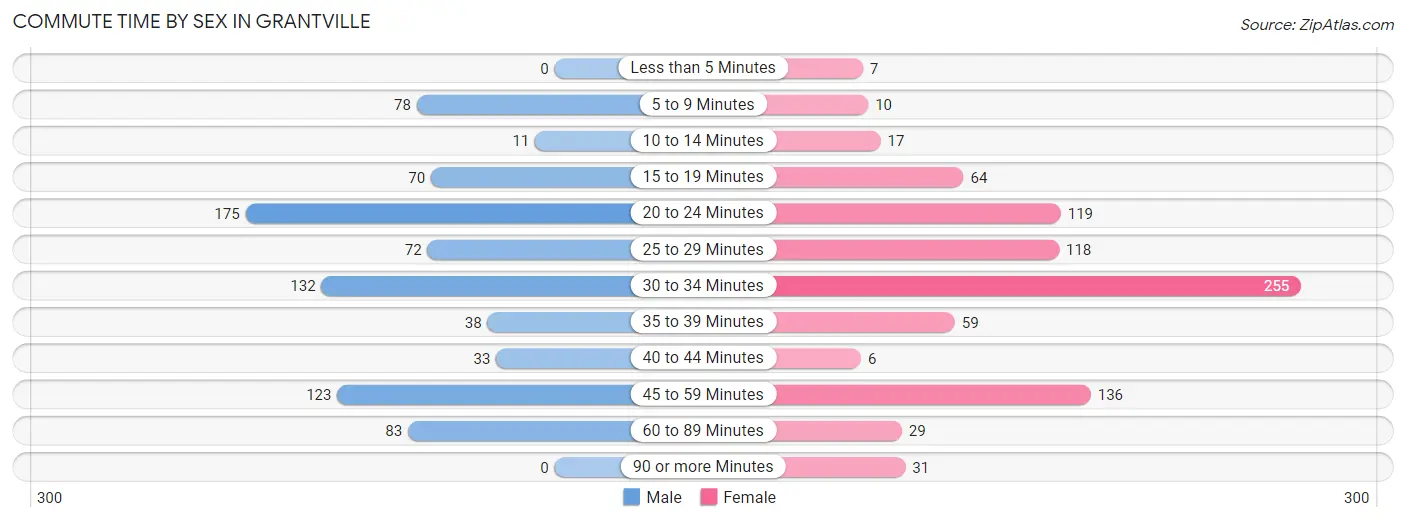
| Commute Time | Male | Female |
| Less than 5 Minutes | 0 (0.0%) | 7 (0.8%) |
| 5 to 9 Minutes | 78 (9.6%) | 10 (1.2%) |
| 10 to 14 Minutes | 11 (1.3%) | 17 (2.0%) |
| 15 to 19 Minutes | 70 (8.6%) | 64 (7.5%) |
| 20 to 24 Minutes | 175 (21.5%) | 119 (14.0%) |
| 25 to 29 Minutes | 72 (8.8%) | 118 (13.9%) |
| 30 to 34 Minutes | 132 (16.2%) | 255 (30.0%) |
| 35 to 39 Minutes | 38 (4.7%) | 59 (6.9%) |
| 40 to 44 Minutes | 33 (4.1%) | 6 (0.7%) |
| 45 to 59 Minutes | 123 (15.1%) | 136 (16.0%) |
| 60 to 89 Minutes | 83 (10.2%) | 29 (3.4%) |
| 90 or more Minutes | 0 (0.0%) | 31 (3.6%) |
Time of Departure to Work by Sex in Grantville
The most frequent times of departure to work in Grantville are 5:30 AM to 5:59 AM (154, 18.9%) for males and 7:00 AM to 7:29 AM (172, 20.2%) for females.
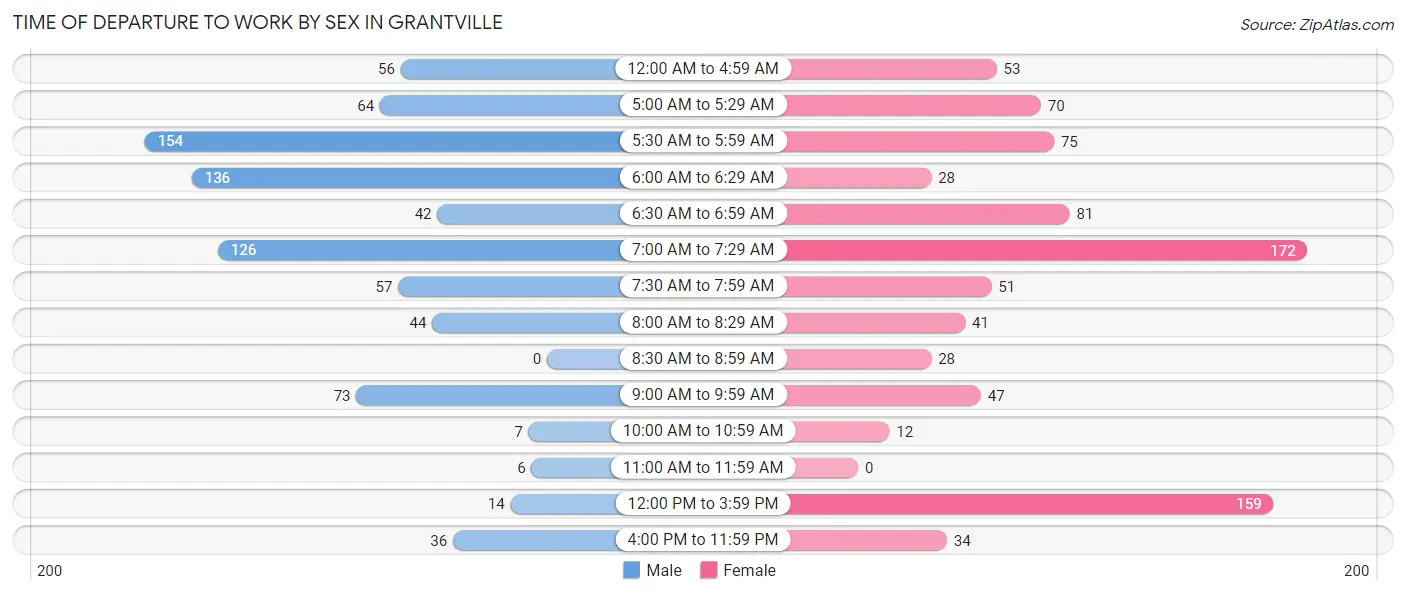
| Time of Departure | Male | Female |
| 12:00 AM to 4:59 AM | 56 (6.9%) | 53 (6.2%) |
| 5:00 AM to 5:29 AM | 64 (7.9%) | 70 (8.2%) |
| 5:30 AM to 5:59 AM | 154 (18.9%) | 75 (8.8%) |
| 6:00 AM to 6:29 AM | 136 (16.7%) | 28 (3.3%) |
| 6:30 AM to 6:59 AM | 42 (5.1%) | 81 (9.5%) |
| 7:00 AM to 7:29 AM | 126 (15.5%) | 172 (20.2%) |
| 7:30 AM to 7:59 AM | 57 (7.0%) | 51 (6.0%) |
| 8:00 AM to 8:29 AM | 44 (5.4%) | 41 (4.8%) |
| 8:30 AM to 8:59 AM | 0 (0.0%) | 28 (3.3%) |
| 9:00 AM to 9:59 AM | 73 (9.0%) | 47 (5.5%) |
| 10:00 AM to 10:59 AM | 7 (0.9%) | 12 (1.4%) |
| 11:00 AM to 11:59 AM | 6 (0.7%) | 0 (0.0%) |
| 12:00 PM to 3:59 PM | 14 (1.7%) | 159 (18.7%) |
| 4:00 PM to 11:59 PM | 36 (4.4%) | 34 (4.0%) |
| Total | 815 (100.0%) | 851 (100.0%) |
Housing Occupancy in Grantville
Occupancy by Ownership in Grantville
Of the total 1,075 dwellings in Grantville, owner-occupied units account for 836 (77.8%), while renter-occupied units make up 239 (22.2%).
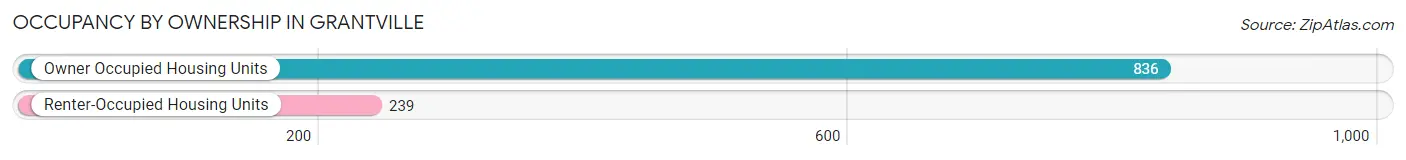
| Occupancy | # Housing Units | % Housing Units |
| Owner Occupied Housing Units | 836 | 77.8% |
| Renter-Occupied Housing Units | 239 | 22.2% |
| Total Occupied Housing Units | 1,075 | 100.0% |
Occupancy by Household Size in Grantville
| Household Size | # Housing Units | % Housing Units |
| 1-Person Household | 233 | 21.7% |
| 2-Person Household | 310 | 28.8% |
| 3-Person Household | 184 | 17.1% |
| 4+ Person Household | 348 | 32.4% |
| Total Housing Units | 1,075 | 100.0% |
Occupancy by Ownership by Household Size in Grantville
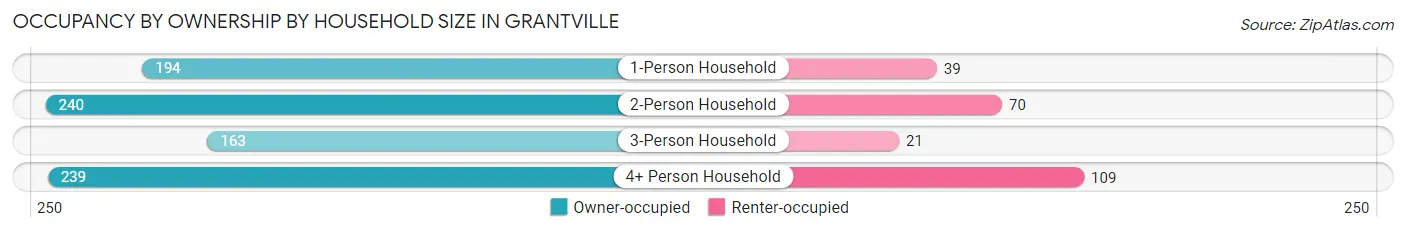
| Household Size | Owner-occupied | Renter-occupied |
| 1-Person Household | 194 (83.3%) | 39 (16.7%) |
| 2-Person Household | 240 (77.4%) | 70 (22.6%) |
| 3-Person Household | 163 (88.6%) | 21 (11.4%) |
| 4+ Person Household | 239 (68.7%) | 109 (31.3%) |
| Total Housing Units | 836 (77.8%) | 239 (22.2%) |
Occupancy by Educational Attainment in Grantville
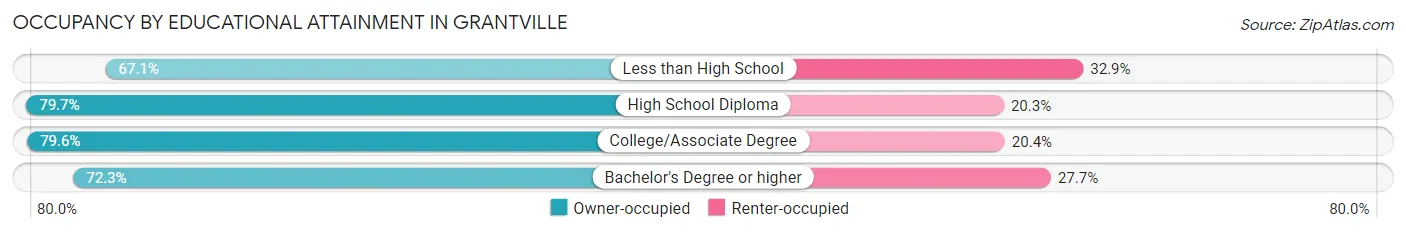
| Household Size | Owner-occupied | Renter-occupied |
| Less than High School | 47 (67.1%) | 23 (32.9%) |
| High School Diploma | 299 (79.7%) | 76 (20.3%) |
| College/Associate Degree | 378 (79.6%) | 97 (20.4%) |
| Bachelor's Degree or higher | 112 (72.3%) | 43 (27.7%) |
Occupancy by Age of Householder in Grantville
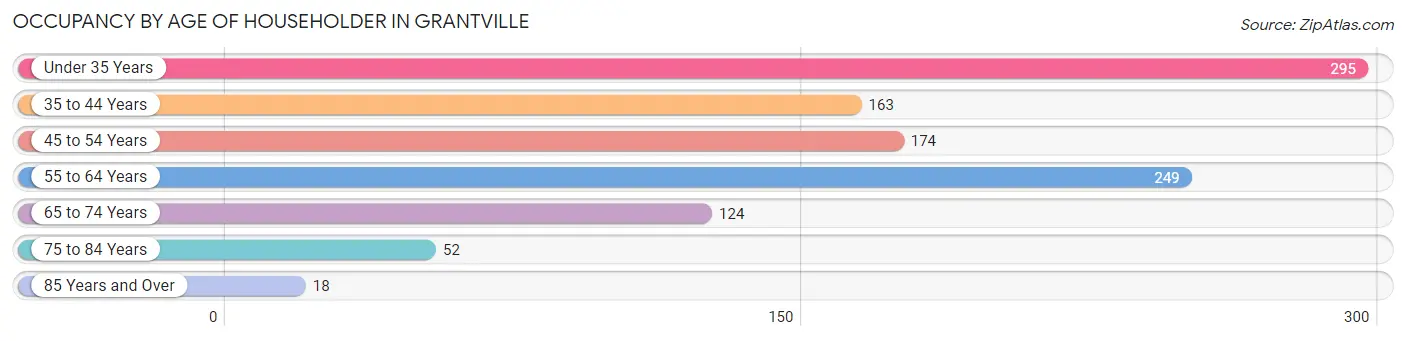
| Age Bracket | # Households | % Households |
| Under 35 Years | 295 | 27.4% |
| 35 to 44 Years | 163 | 15.2% |
| 45 to 54 Years | 174 | 16.2% |
| 55 to 64 Years | 249 | 23.2% |
| 65 to 74 Years | 124 | 11.5% |
| 75 to 84 Years | 52 | 4.8% |
| 85 Years and Over | 18 | 1.7% |
| Total | 1,075 | 100.0% |
Housing Finances in Grantville
Median Income by Occupancy in Grantville
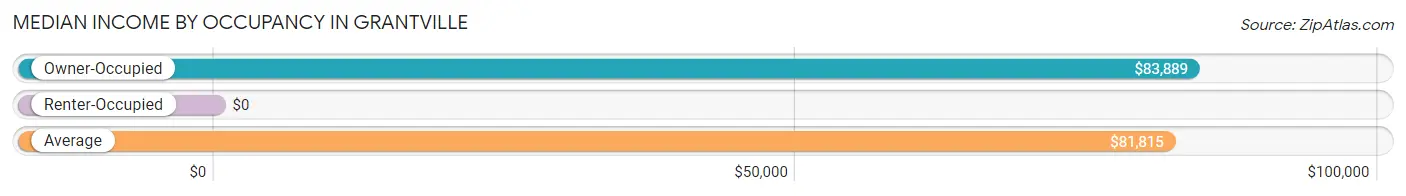
| Occupancy Type | # Households | Median Income |
| Owner-Occupied | 836 (77.8%) | $83,889 |
| Renter-Occupied | 239 (22.2%) | $0 |
| Average | 1,075 (100.0%) | $81,815 |
Occupancy by Householder Income Bracket in Grantville
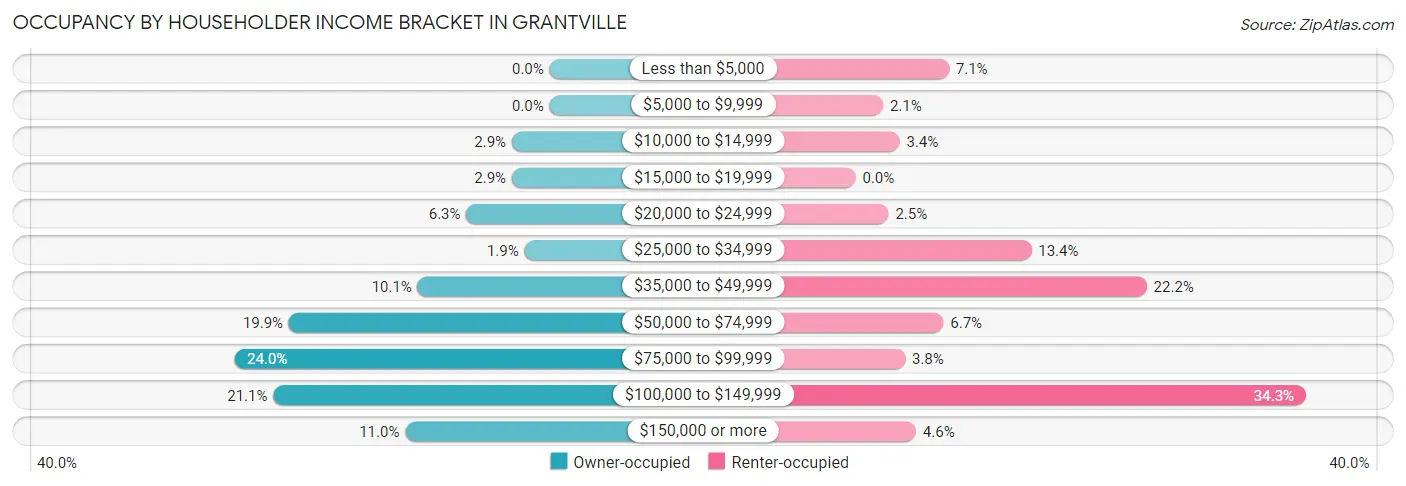
| Income Bracket | Owner-occupied | Renter-occupied |
| Less than $5,000 | 0 (0.0%) | 17 (7.1%) |
| $5,000 to $9,999 | 0 (0.0%) | 5 (2.1%) |
| $10,000 to $14,999 | 24 (2.9%) | 8 (3.4%) |
| $15,000 to $19,999 | 24 (2.9%) | 0 (0.0%) |
| $20,000 to $24,999 | 53 (6.3%) | 6 (2.5%) |
| $25,000 to $34,999 | 16 (1.9%) | 32 (13.4%) |
| $35,000 to $49,999 | 84 (10.1%) | 53 (22.2%) |
| $50,000 to $74,999 | 166 (19.9%) | 16 (6.7%) |
| $75,000 to $99,999 | 201 (24.0%) | 9 (3.8%) |
| $100,000 to $149,999 | 176 (21.0%) | 82 (34.3%) |
| $150,000 or more | 92 (11.0%) | 11 (4.6%) |
| Total | 836 (100.0%) | 239 (100.0%) |
Monthly Housing Cost Tiers in Grantville
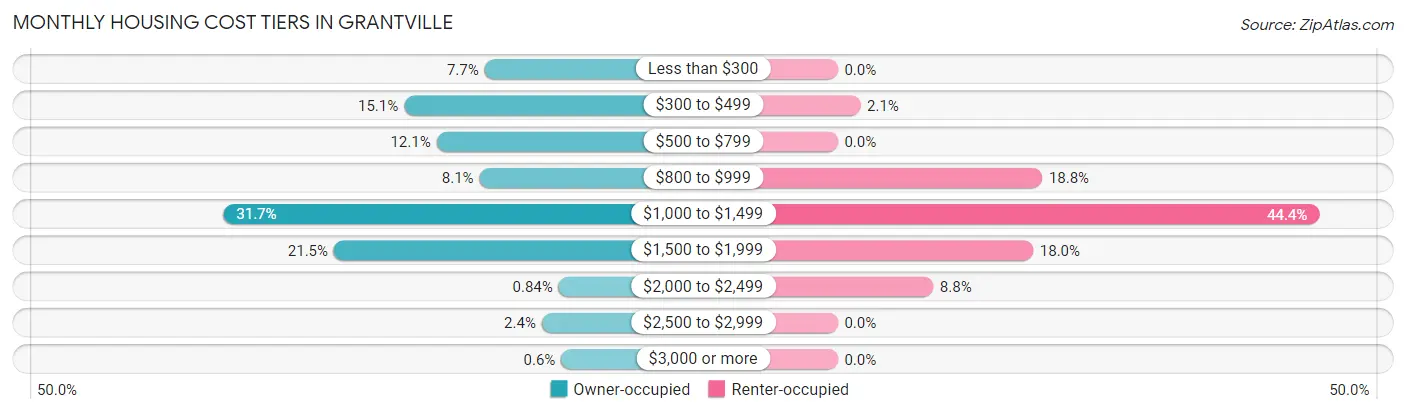
| Monthly Cost | Owner-occupied | Renter-occupied |
| Less than $300 | 64 (7.7%) | 0 (0.0%) |
| $300 to $499 | 126 (15.1%) | 5 (2.1%) |
| $500 to $799 | 101 (12.1%) | 0 (0.0%) |
| $800 to $999 | 68 (8.1%) | 45 (18.8%) |
| $1,000 to $1,499 | 265 (31.7%) | 106 (44.4%) |
| $1,500 to $1,999 | 180 (21.5%) | 43 (18.0%) |
| $2,000 to $2,499 | 7 (0.8%) | 21 (8.8%) |
| $2,500 to $2,999 | 20 (2.4%) | 0 (0.0%) |
| $3,000 or more | 5 (0.6%) | 0 (0.0%) |
| Total | 836 (100.0%) | 239 (100.0%) |
Physical Housing Characteristics in Grantville
Housing Structures in Grantville
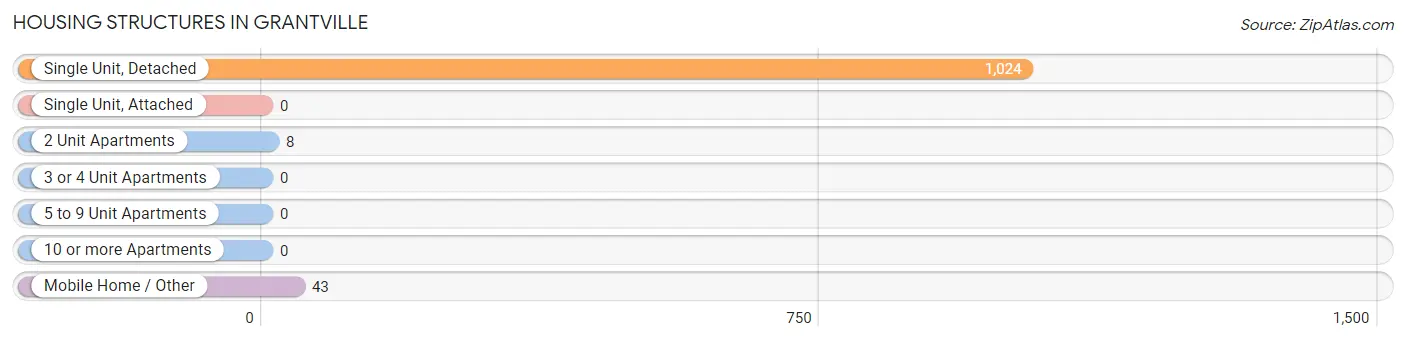
| Structure Type | # Housing Units | % Housing Units |
| Single Unit, Detached | 1,024 | 95.3% |
| Single Unit, Attached | 0 | 0.0% |
| 2 Unit Apartments | 8 | 0.7% |
| 3 or 4 Unit Apartments | 0 | 0.0% |
| 5 to 9 Unit Apartments | 0 | 0.0% |
| 10 or more Apartments | 0 | 0.0% |
| Mobile Home / Other | 43 | 4.0% |
| Total | 1,075 | 100.0% |
Housing Structures by Occupancy in Grantville
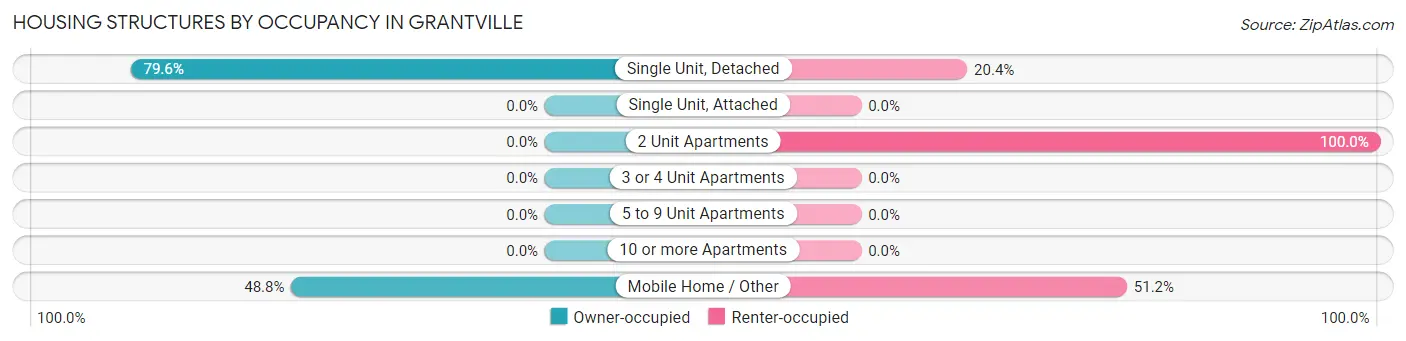
| Structure Type | Owner-occupied | Renter-occupied |
| Single Unit, Detached | 815 (79.6%) | 209 (20.4%) |
| Single Unit, Attached | 0 (0.0%) | 0 (0.0%) |
| 2 Unit Apartments | 0 (0.0%) | 8 (100.0%) |
| 3 or 4 Unit Apartments | 0 (0.0%) | 0 (0.0%) |
| 5 to 9 Unit Apartments | 0 (0.0%) | 0 (0.0%) |
| 10 or more Apartments | 0 (0.0%) | 0 (0.0%) |
| Mobile Home / Other | 21 (48.8%) | 22 (51.2%) |
| Total | 836 (77.8%) | 239 (22.2%) |
Housing Structures by Number of Rooms in Grantville
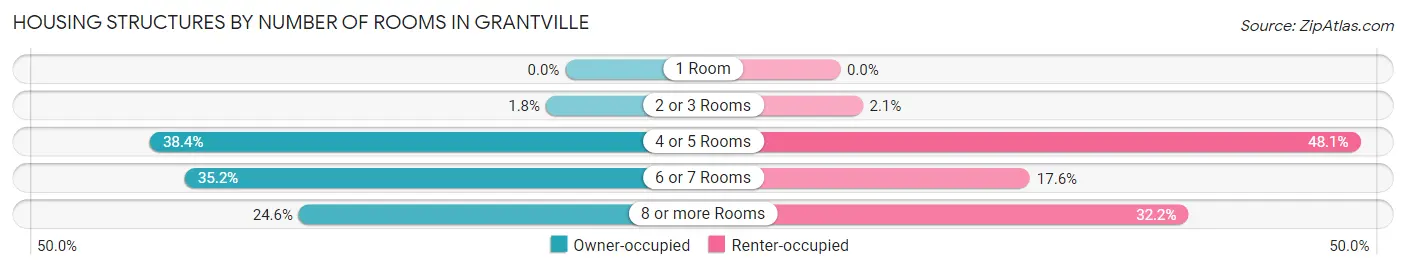
| Number of Rooms | Owner-occupied | Renter-occupied |
| 1 Room | 0 (0.0%) | 0 (0.0%) |
| 2 or 3 Rooms | 15 (1.8%) | 5 (2.1%) |
| 4 or 5 Rooms | 321 (38.4%) | 115 (48.1%) |
| 6 or 7 Rooms | 294 (35.2%) | 42 (17.6%) |
| 8 or more Rooms | 206 (24.6%) | 77 (32.2%) |
| Total | 836 (100.0%) | 239 (100.0%) |
Housing Structure by Heating Type in Grantville
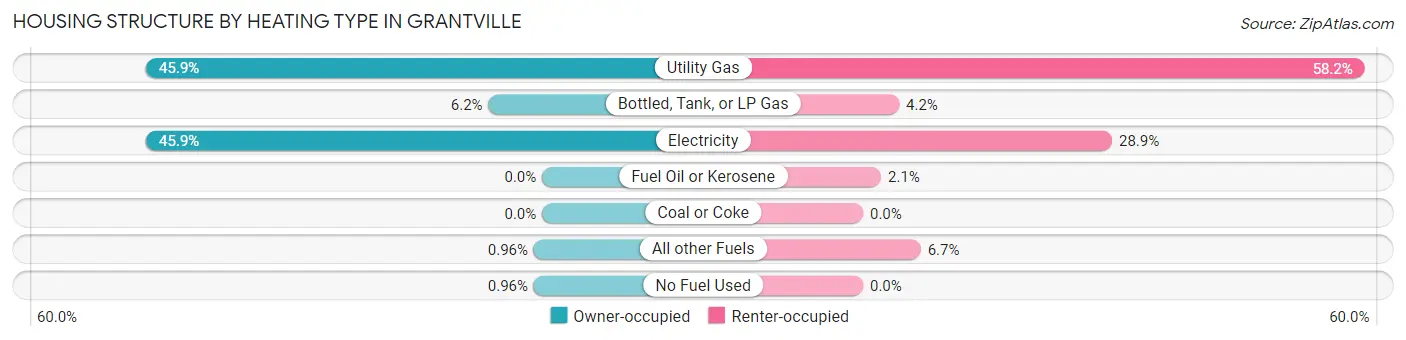
| Heating Type | Owner-occupied | Renter-occupied |
| Utility Gas | 384 (45.9%) | 139 (58.2%) |
| Bottled, Tank, or LP Gas | 52 (6.2%) | 10 (4.2%) |
| Electricity | 384 (45.9%) | 69 (28.9%) |
| Fuel Oil or Kerosene | 0 (0.0%) | 5 (2.1%) |
| Coal or Coke | 0 (0.0%) | 0 (0.0%) |
| All other Fuels | 8 (1.0%) | 16 (6.7%) |
| No Fuel Used | 8 (1.0%) | 0 (0.0%) |
| Total | 836 (100.0%) | 239 (100.0%) |
Household Vehicle Usage in Grantville
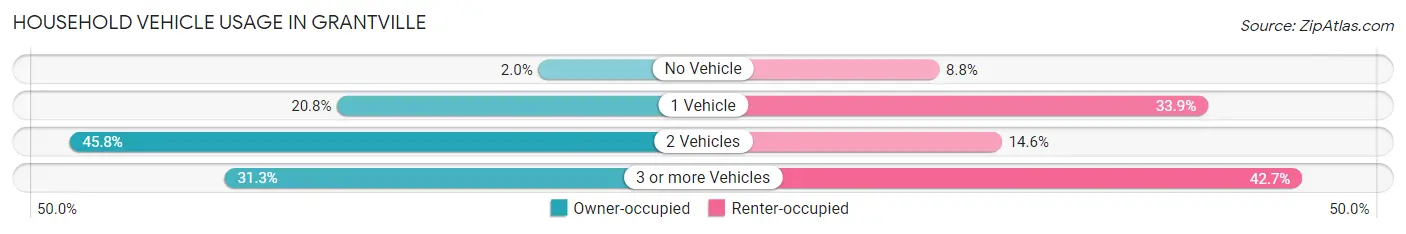
| Vehicles per Household | Owner-occupied | Renter-occupied |
| No Vehicle | 17 (2.0%) | 21 (8.8%) |
| 1 Vehicle | 174 (20.8%) | 81 (33.9%) |
| 2 Vehicles | 383 (45.8%) | 35 (14.6%) |
| 3 or more Vehicles | 262 (31.3%) | 102 (42.7%) |
| Total | 836 (100.0%) | 239 (100.0%) |
Real Estate & Mortgages in Grantville
Real Estate and Mortgage Overview in Grantville
| Characteristic | Without Mortgage | With Mortgage |
| Housing Units | 250 | 586 |
| Median Property Value | $145,300 | $173,900 |
| Median Household Income | $71,190 | $13 |
| Monthly Housing Costs | $462 | $5 |
| Real Estate Taxes | $1,676 | $5 |
Property Value by Mortgage Status in Grantville
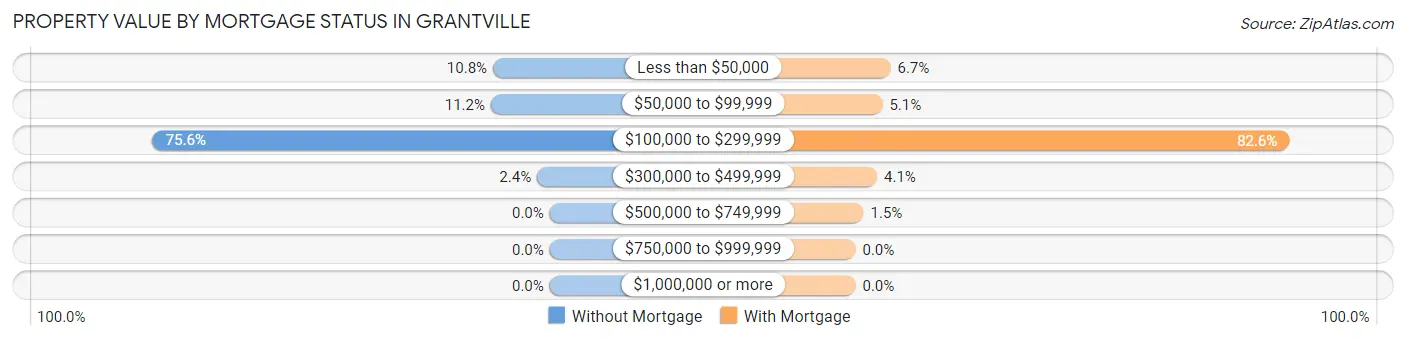
| Property Value | Without Mortgage | With Mortgage |
| Less than $50,000 | 27 (10.8%) | 39 (6.7%) |
| $50,000 to $99,999 | 28 (11.2%) | 30 (5.1%) |
| $100,000 to $299,999 | 189 (75.6%) | 484 (82.6%) |
| $300,000 to $499,999 | 6 (2.4%) | 24 (4.1%) |
| $500,000 to $749,999 | 0 (0.0%) | 9 (1.5%) |
| $750,000 to $999,999 | 0 (0.0%) | 0 (0.0%) |
| $1,000,000 or more | 0 (0.0%) | 0 (0.0%) |
| Total | 250 (100.0%) | 586 (100.0%) |
Household Income by Mortgage Status in Grantville
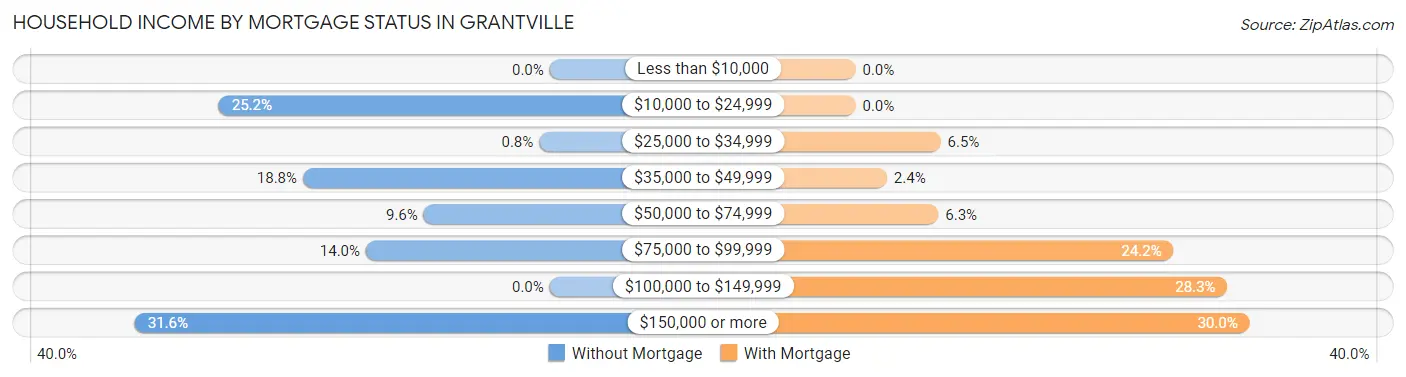
| Household Income | Without Mortgage | With Mortgage |
| Less than $10,000 | 0 (0.0%) | 0 (0.0%) |
| $10,000 to $24,999 | 63 (25.2%) | 0 (0.0%) |
| $25,000 to $34,999 | 2 (0.8%) | 38 (6.5%) |
| $35,000 to $49,999 | 47 (18.8%) | 14 (2.4%) |
| $50,000 to $74,999 | 24 (9.6%) | 37 (6.3%) |
| $75,000 to $99,999 | 35 (14.0%) | 142 (24.2%) |
| $100,000 to $149,999 | 0 (0.0%) | 166 (28.3%) |
| $150,000 or more | 79 (31.6%) | 176 (30.0%) |
| Total | 250 (100.0%) | 586 (100.0%) |
Property Value to Household Income Ratio in Grantville
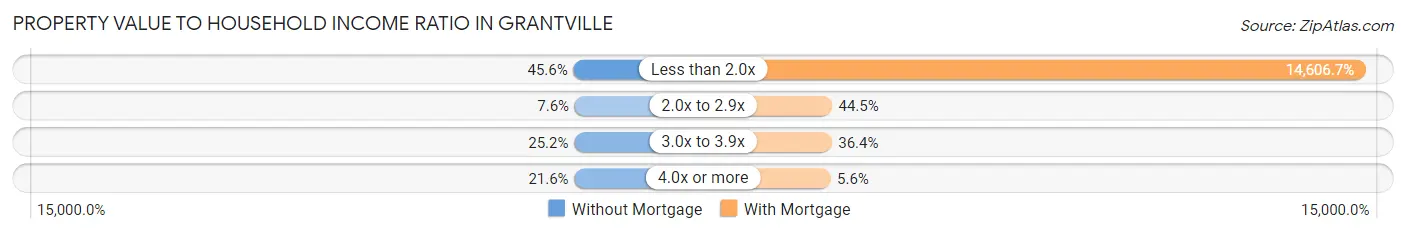
| Value-to-Income Ratio | Without Mortgage | With Mortgage |
| Less than 2.0x | 114 (45.6%) | 85,595 (14,606.7%) |
| 2.0x to 2.9x | 19 (7.6%) | 261 (44.5%) |
| 3.0x to 3.9x | 63 (25.2%) | 213 (36.3%) |
| 4.0x or more | 54 (21.6%) | 33 (5.6%) |
| Total | 250 (100.0%) | 586 (100.0%) |
Real Estate Taxes by Mortgage Status in Grantville
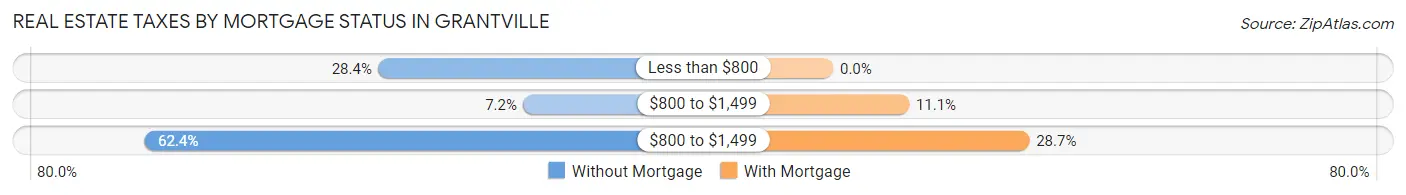
| Property Taxes | Without Mortgage | With Mortgage |
| Less than $800 | 71 (28.4%) | 0 (0.0%) |
| $800 to $1,499 | 18 (7.2%) | 65 (11.1%) |
| $800 to $1,499 | 156 (62.4%) | 168 (28.7%) |
| Total | 250 (100.0%) | 586 (100.0%) |
Health & Disability in Grantville
Health Insurance Coverage by Age in Grantville
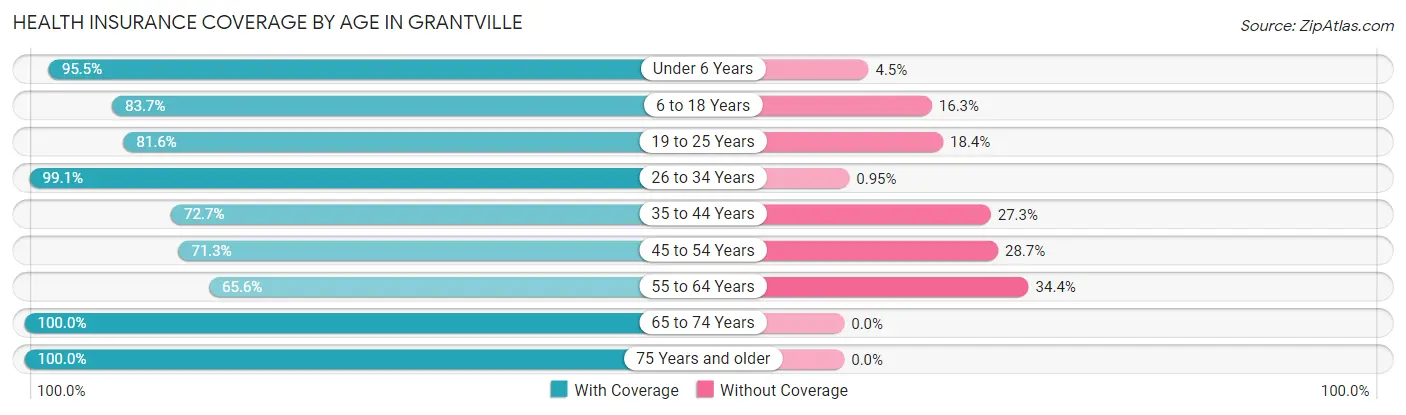
| Age Bracket | With Coverage | Without Coverage |
| Under 6 Years | 190 (95.5%) | 9 (4.5%) |
| 6 to 18 Years | 461 (83.7%) | 90 (16.3%) |
| 19 to 25 Years | 363 (81.6%) | 82 (18.4%) |
| 26 to 34 Years | 524 (99.1%) | 5 (0.9%) |
| 35 to 44 Years | 282 (72.7%) | 106 (27.3%) |
| 45 to 54 Years | 204 (71.3%) | 82 (28.7%) |
| 55 to 64 Years | 313 (65.6%) | 164 (34.4%) |
| 65 to 74 Years | 190 (100.0%) | 0 (0.0%) |
| 75 Years and older | 95 (100.0%) | 0 (0.0%) |
| Total | 2,622 (83.0%) | 538 (17.0%) |
Health Insurance Coverage by Citizenship Status in Grantville
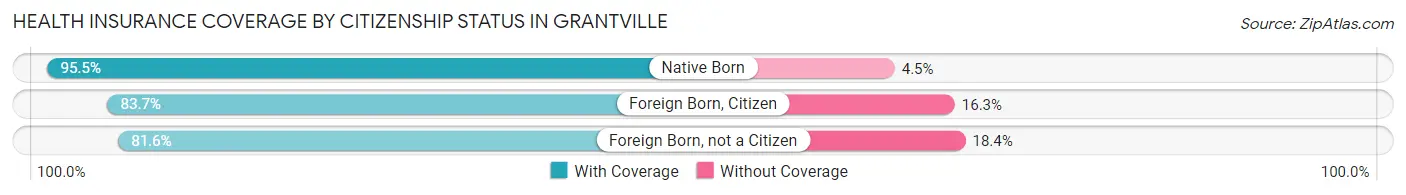
| Citizenship Status | With Coverage | Without Coverage |
| Native Born | 190 (95.5%) | 9 (4.5%) |
| Foreign Born, Citizen | 461 (83.7%) | 90 (16.3%) |
| Foreign Born, not a Citizen | 363 (81.6%) | 82 (18.4%) |
Health Insurance Coverage by Household Income in Grantville
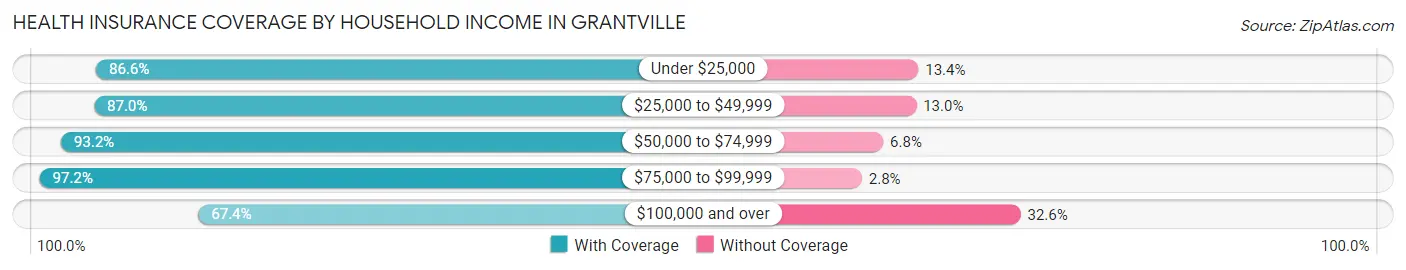
| Household Income | With Coverage | Without Coverage |
| Under $25,000 | 220 (86.6%) | 34 (13.4%) |
| $25,000 to $49,999 | 341 (87.0%) | 51 (13.0%) |
| $50,000 to $74,999 | 520 (93.2%) | 38 (6.8%) |
| $75,000 to $99,999 | 725 (97.2%) | 21 (2.8%) |
| $100,000 and over | 816 (67.4%) | 394 (32.6%) |
Public vs Private Health Insurance Coverage by Age in Grantville
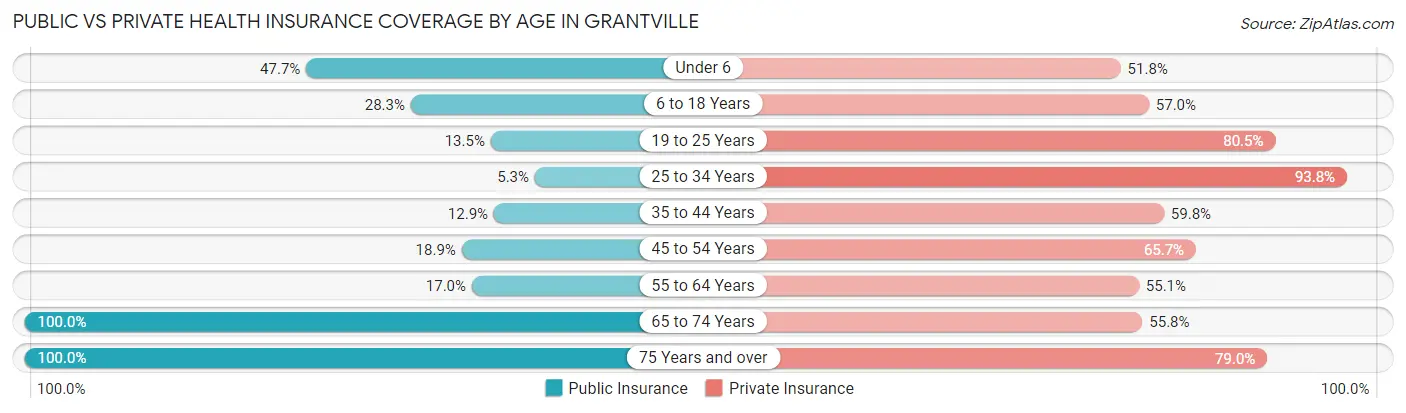
| Age Bracket | Public Insurance | Private Insurance |
| Under 6 | 95 (47.7%) | 103 (51.8%) |
| 6 to 18 Years | 156 (28.3%) | 314 (57.0%) |
| 19 to 25 Years | 60 (13.5%) | 358 (80.4%) |
| 25 to 34 Years | 28 (5.3%) | 496 (93.8%) |
| 35 to 44 Years | 50 (12.9%) | 232 (59.8%) |
| 45 to 54 Years | 54 (18.9%) | 188 (65.7%) |
| 55 to 64 Years | 81 (17.0%) | 263 (55.1%) |
| 65 to 74 Years | 190 (100.0%) | 106 (55.8%) |
| 75 Years and over | 95 (100.0%) | 75 (78.9%) |
| Total | 809 (25.6%) | 2,135 (67.6%) |
Disability Status by Sex by Age in Grantville
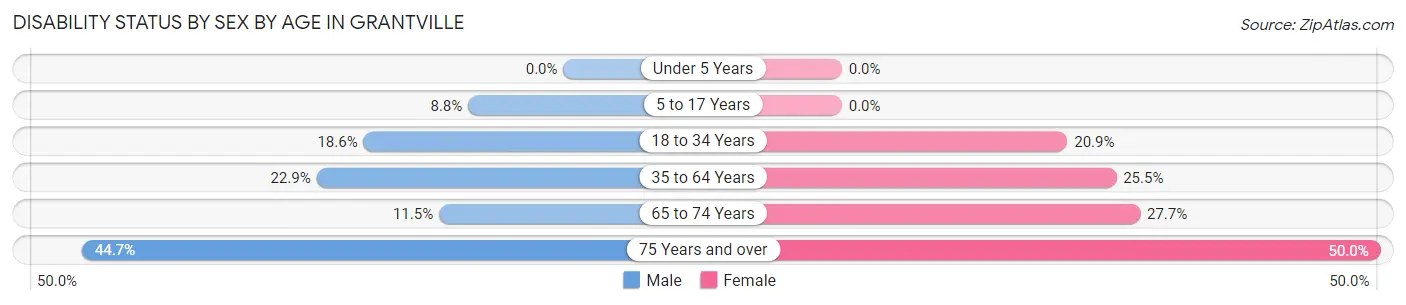
| Age Bracket | Male | Female |
| Under 5 Years | 0 (0.0%) | 0 (0.0%) |
| 5 to 17 Years | 26 (8.8%) | 0 (0.0%) |
| 18 to 34 Years | 82 (18.5%) | 121 (20.9%) |
| 35 to 64 Years | 118 (22.9%) | 162 (25.5%) |
| 65 to 74 Years | 9 (11.5%) | 31 (27.7%) |
| 75 Years and over | 21 (44.7%) | 24 (50.0%) |
Disability Class by Sex by Age in Grantville
Disability Class: Hearing Difficulty
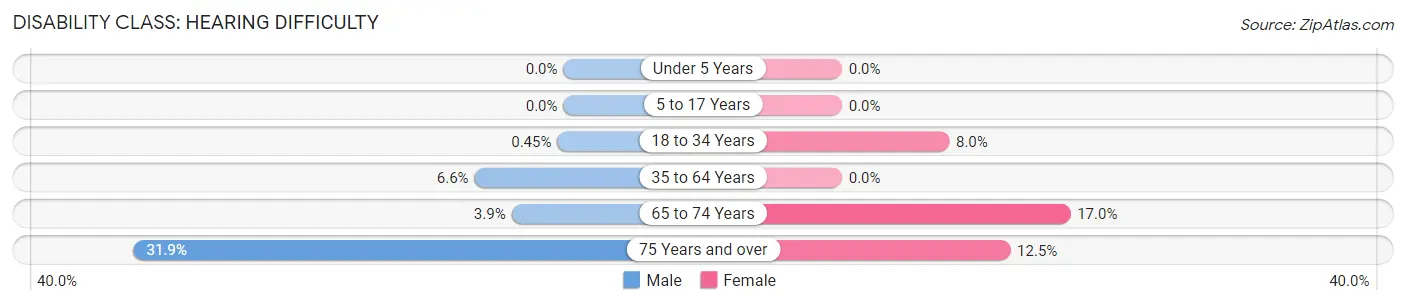
| Age Bracket | Male | Female |
| Under 5 Years | 0 (0.0%) | 0 (0.0%) |
| 5 to 17 Years | 0 (0.0%) | 0 (0.0%) |
| 18 to 34 Years | 2 (0.4%) | 46 (8.0%) |
| 35 to 64 Years | 34 (6.6%) | 0 (0.0%) |
| 65 to 74 Years | 3 (3.8%) | 19 (17.0%) |
| 75 Years and over | 15 (31.9%) | 6 (12.5%) |
Disability Class: Vision Difficulty
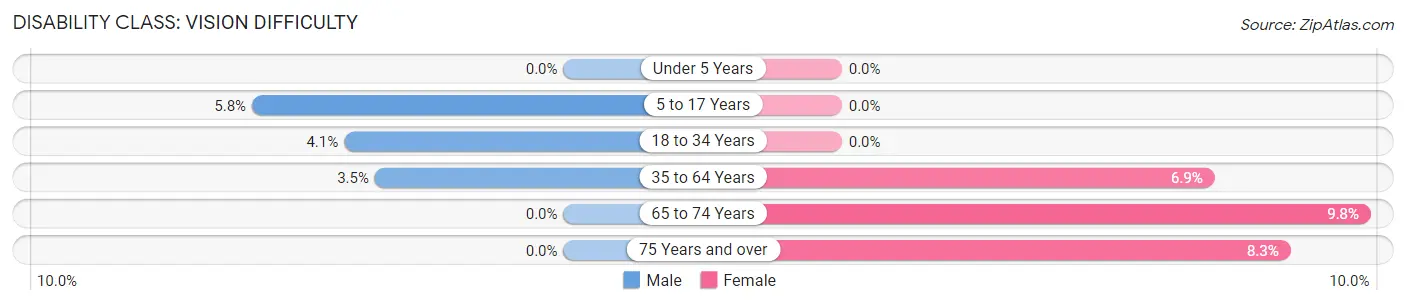
| Age Bracket | Male | Female |
| Under 5 Years | 0 (0.0%) | 0 (0.0%) |
| 5 to 17 Years | 17 (5.8%) | 0 (0.0%) |
| 18 to 34 Years | 18 (4.1%) | 0 (0.0%) |
| 35 to 64 Years | 18 (3.5%) | 44 (6.9%) |
| 65 to 74 Years | 0 (0.0%) | 11 (9.8%) |
| 75 Years and over | 0 (0.0%) | 4 (8.3%) |
Disability Class: Cognitive Difficulty
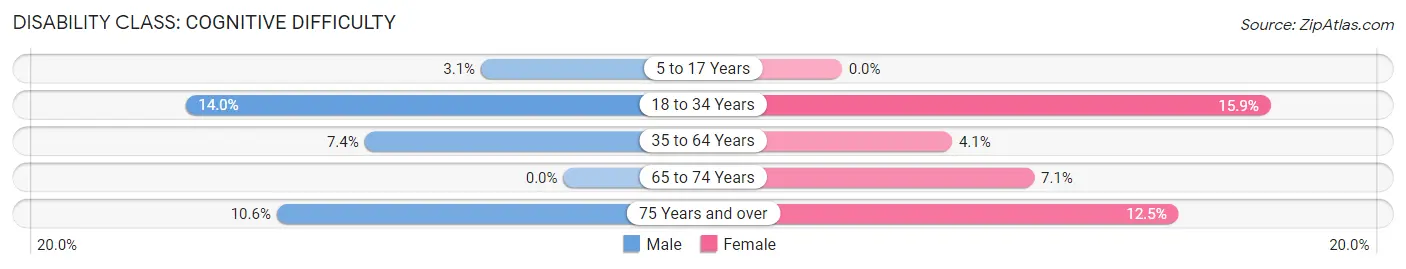
| Age Bracket | Male | Female |
| 5 to 17 Years | 9 (3.1%) | 0 (0.0%) |
| 18 to 34 Years | 62 (14.0%) | 92 (15.9%) |
| 35 to 64 Years | 38 (7.4%) | 26 (4.1%) |
| 65 to 74 Years | 0 (0.0%) | 8 (7.1%) |
| 75 Years and over | 5 (10.6%) | 6 (12.5%) |
Disability Class: Ambulatory Difficulty
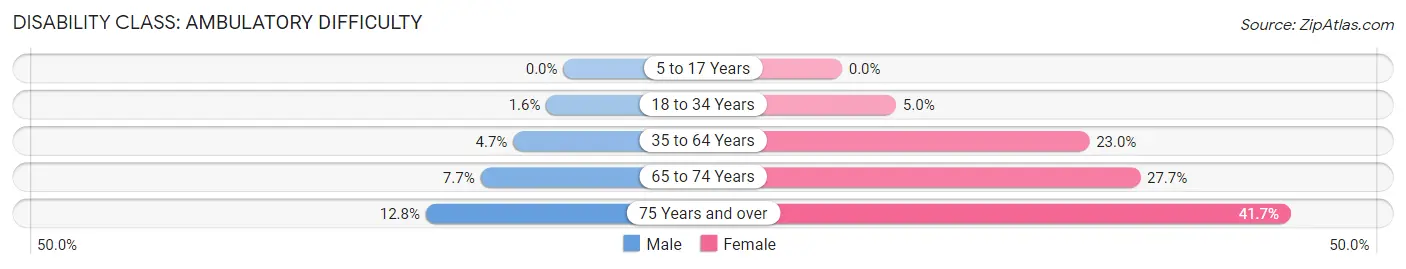
| Age Bracket | Male | Female |
| 5 to 17 Years | 0 (0.0%) | 0 (0.0%) |
| 18 to 34 Years | 7 (1.6%) | 29 (5.0%) |
| 35 to 64 Years | 24 (4.7%) | 146 (23.0%) |
| 65 to 74 Years | 6 (7.7%) | 31 (27.7%) |
| 75 Years and over | 6 (12.8%) | 20 (41.7%) |
Disability Class: Self-Care Difficulty
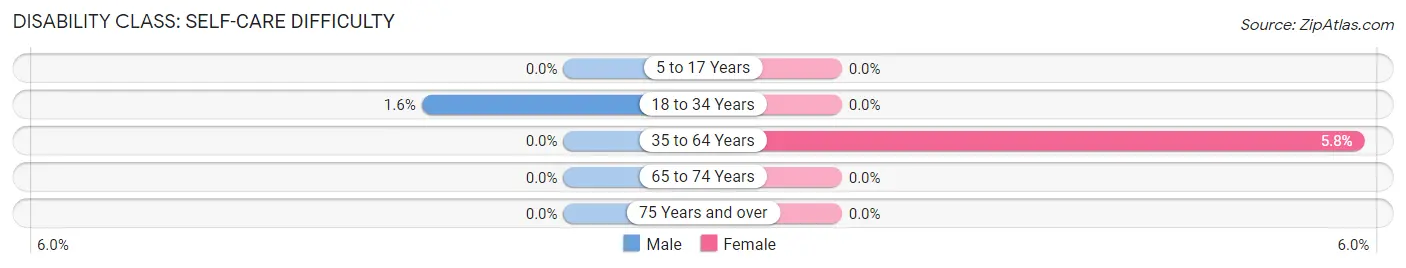
| Age Bracket | Male | Female |
| 5 to 17 Years | 0 (0.0%) | 0 (0.0%) |
| 18 to 34 Years | 7 (1.6%) | 0 (0.0%) |
| 35 to 64 Years | 0 (0.0%) | 37 (5.8%) |
| 65 to 74 Years | 0 (0.0%) | 0 (0.0%) |
| 75 Years and over | 0 (0.0%) | 0 (0.0%) |
Technology Access in Grantville
Computing Device Access in Grantville
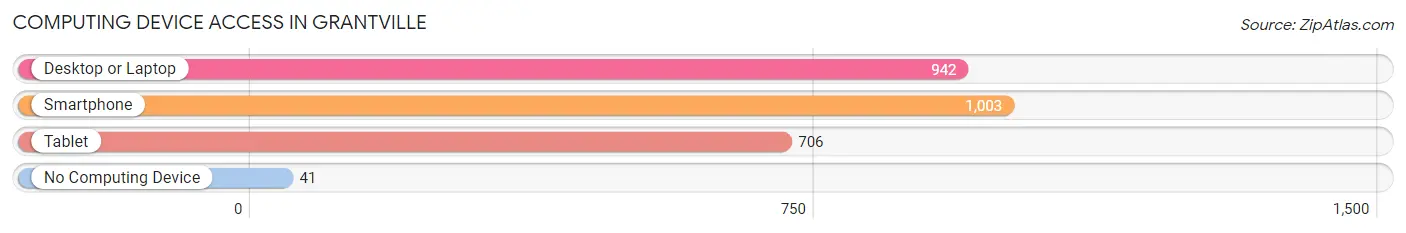
| Device Type | # Households | % Households |
| Desktop or Laptop | 942 | 87.6% |
| Smartphone | 1,003 | 93.3% |
| Tablet | 706 | 65.7% |
| No Computing Device | 41 | 3.8% |
| Total | 1,075 | 100.0% |
Internet Access in Grantville
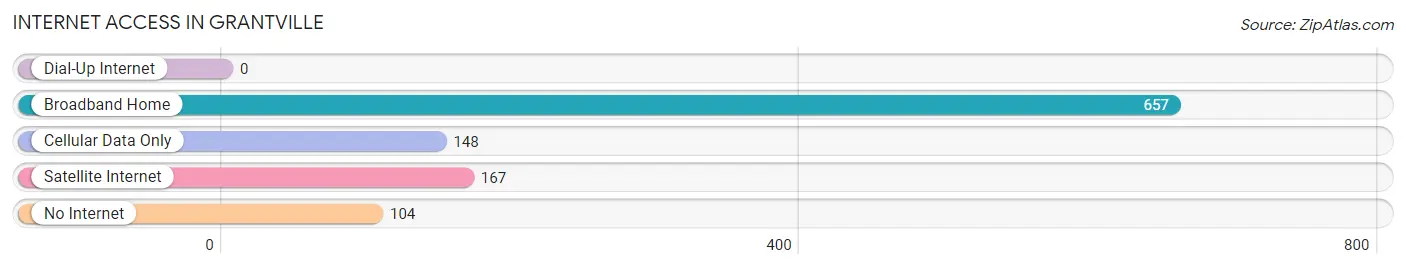
| Internet Type | # Households | % Households |
| Dial-Up Internet | 0 | 0.0% |
| Broadband Home | 657 | 61.1% |
| Cellular Data Only | 148 | 13.8% |
| Satellite Internet | 167 | 15.5% |
| No Internet | 104 | 9.7% |
| Total | 1,075 | 100.0% |
Grantville Summary
History
The town of Grantville, Georgia is located in Coweta County, approximately 40 miles southwest of Atlanta. The town was founded in 1884 by the Central of Georgia Railway and was named after Ulysses S. Grant, the 18th President of the United States. The town was originally a small farming community, but it quickly grew into a thriving industrial center. The town was home to several cotton mills, a brick factory, and a sawmill.
In the early 1900s, Grantville was a bustling town with a population of over 1,000 people. The town had a variety of stores, churches, and schools. The town was also home to a number of fraternal organizations, including the Masons, the Odd Fellows, and the Knights of Pythias.
In the 1920s, the town experienced a period of growth and prosperity. The population increased to over 2,000 people and the town was home to a variety of businesses, including a bank, a movie theater, and a hotel.
In the 1940s, the town experienced a period of decline. The cotton mills and other industries began to close and the population began to decline. By the 1950s, the population had dropped to just over 1,000 people.
In the 1960s, the town began to experience a period of revitalization. The town was home to a number of new businesses, including a shopping center and a hospital. The population began to increase and by the 1970s, the population had grown to over 2,000 people.
In the 1980s, the town experienced a period of growth and development. The population increased to over 3,000 people and the town was home to a variety of new businesses, including a golf course and a shopping mall.
Geography
Grantville is located in Coweta County, Georgia, approximately 40 miles southwest of Atlanta. The town is situated in the foothills of the Appalachian Mountains and is surrounded by rolling hills and forests. The town is located near the Chattahoochee River and is home to several parks and recreational areas.
The climate in Grantville is mild and temperate. The average temperature in the summer is around 80 degrees Fahrenheit and the average temperature in the winter is around 50 degrees Fahrenheit. The town receives an average of 48 inches of rain per year.
Economy
The economy of Grantville is largely based on manufacturing and retail. The town is home to several manufacturing companies, including a furniture manufacturer, a plastics manufacturer, and a paper products manufacturer. The town is also home to a variety of retail stores, including a grocery store, a hardware store, and a clothing store.
The town is also home to a number of service-based businesses, including a hospital, a bank, and a number of restaurants. The town is also home to a number of professional services, including lawyers, accountants, and real estate agents.
Demographics
As of the 2010 census, the population of Grantville was 3,521 people. The population is largely white (83.3%) and African American (14.2%). The median household income is $41,945 and the median age is 38.7 years. The town is home to a variety of religious denominations, including Baptist, Methodist, and Catholic.
Common Questions
What is Per Capita Income in Grantville?
Per Capita income in Grantville is $29,095.
What is the Median Family Income in Grantville?
Median Family Income in Grantville is $88,008.
What is the Median Household income in Grantville?
Median Household Income in Grantville is $81,815.
What is Income or Wage Gap in Grantville?
Income or Wage Gap in Grantville is 19.6%.
Women in Grantville earn 80.4 cents for every dollar earned by a man.
What is Inequality or Gini Index in Grantville?
Inequality or Gini Index in Grantville is 0.33.
What is the Total Population of Grantville?
Total Population of Grantville is 3,175.
What is the Total Male Population of Grantville?
Total Male Population of Grantville is 1,482.
What is the Total Female Population of Grantville?
Total Female Population of Grantville is 1,693.
What is the Ratio of Males per 100 Females in Grantville?
There are 87.54 Males per 100 Females in Grantville.
What is the Ratio of Females per 100 Males in Grantville?
There are 114.24 Females per 100 Males in Grantville.
What is the Median Population Age in Grantville?
Median Population Age in Grantville is 33.9 Years.
What is the Average Family Size in Grantville
Average Family Size in Grantville is 3.4 People.
What is the Average Household Size in Grantville
Average Household Size in Grantville is 3.0 People.
How Large is the Labor Force in Grantville?
There are 1,777 People in the Labor Forcein in Grantville.
What is the Percentage of People in the Labor Force in Grantville?
70.6% of People are in the Labor Force in Grantville.
What is the Unemployment Rate in Grantville?
Unemployment Rate in Grantville is 3.2%.