Sudanese vs Peruvian Female Disability
COMPARE
Sudanese
Peruvian
Female Disability
Female Disability Comparison
Sudanese
Peruvians
12.0%
FEMALE DISABILITY
79.1/ 100
METRIC RATING
153rd/ 347
METRIC RANK
11.3%
FEMALE DISABILITY
99.9/ 100
METRIC RATING
54th/ 347
METRIC RANK
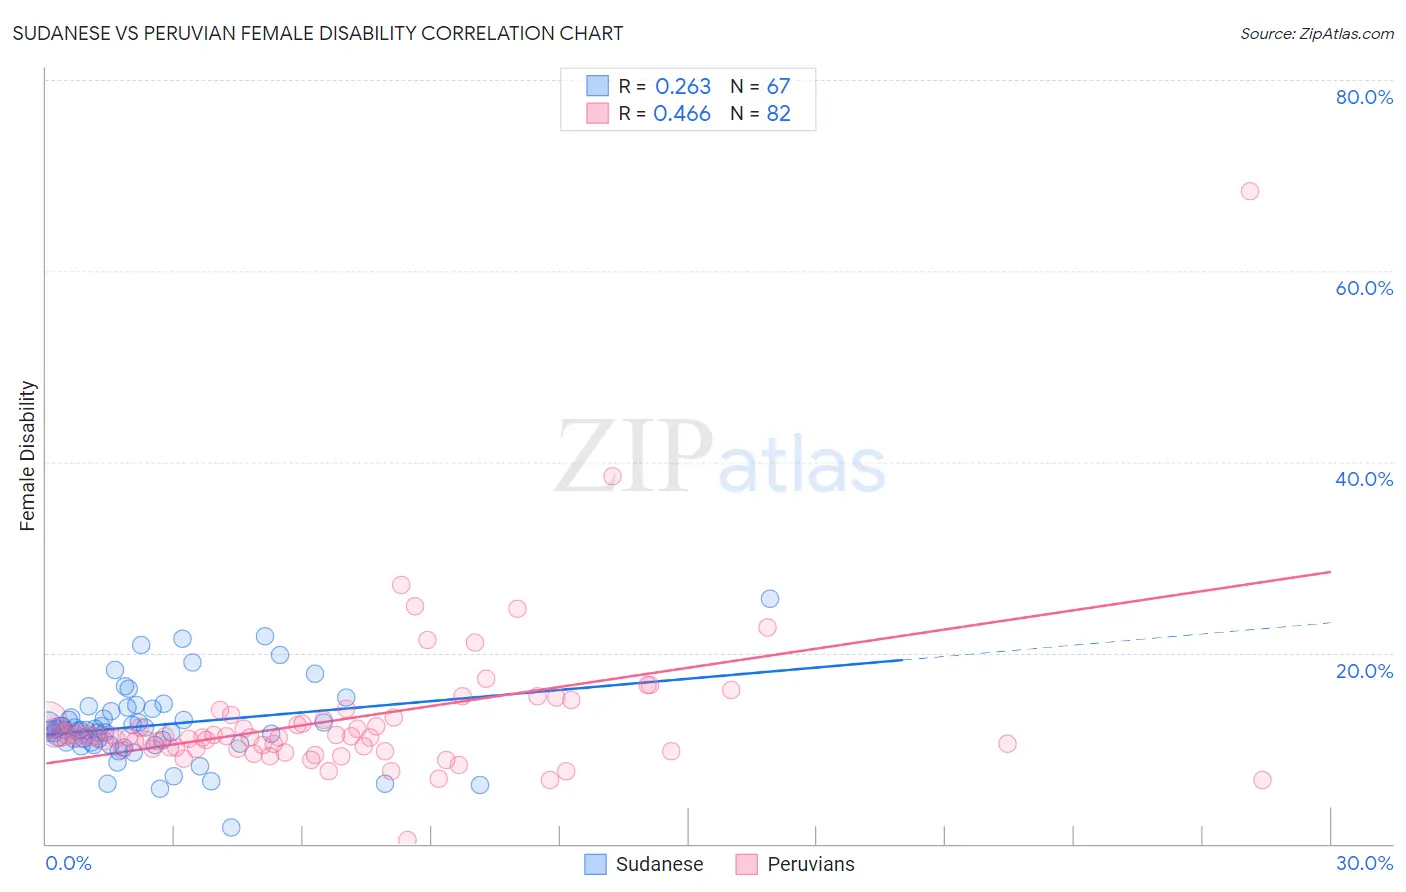
Sudanese vs Peruvian Female Disability Correlation Chart
The statistical analysis conducted on geographies consisting of 110,131,007 people shows a weak positive correlation between the proportion of Sudanese and percentage of females with a disability in the United States with a correlation coefficient (R) of 0.263 and weighted average of 12.0%. Similarly, the statistical analysis conducted on geographies consisting of 363,181,047 people shows a moderate positive correlation between the proportion of Peruvians and percentage of females with a disability in the United States with a correlation coefficient (R) of 0.466 and weighted average of 11.3%, a difference of 6.2%.
Female Disability Correlation Summary
| Measurement | Sudanese | Peruvian |
| Minimum | 1.7% | 0.45% |
| Maximum | 25.6% | 68.3% |
| Range | 23.9% | 67.8% |
| Mean | 12.4% | 13.0% |
| Median | 12.0% | 11.2% |
| Interquartile 25% (IQ1) | 10.4% | 9.9% |
| Interquartile 75% (IQ3) | 13.9% | 13.0% |
| Interquartile Range (IQR) | 3.5% | 3.1% |
| Standard Deviation (Sample) | 4.0% | 8.0% |
| Standard Deviation (Population) | 4.0% | 8.0% |
Similar Demographics by Female Disability
Demographics Similar to Sudanese by Female Disability
In terms of female disability, the demographic groups most similar to Sudanese are Immigrants from Scotland (12.0%, a difference of 0.010%), Icelander (12.0%, a difference of 0.090%), Syrian (12.1%, a difference of 0.13%), Immigrants from Moldova (12.0%, a difference of 0.14%), and Ghanaian (12.1%, a difference of 0.14%).
| Demographics | Rating | Rank | Female Disability |
| Pakistanis | 84.6 /100 | #146 | Excellent 12.0% |
| Nigerians | 84.0 /100 | #147 | Excellent 12.0% |
| Immigrants | Kenya | 83.1 /100 | #148 | Excellent 12.0% |
| Greeks | 82.0 /100 | #149 | Excellent 12.0% |
| Immigrants | Moldova | 81.4 /100 | #150 | Excellent 12.0% |
| Icelanders | 80.7 /100 | #151 | Excellent 12.0% |
| Immigrants | Scotland | 79.3 /100 | #152 | Good 12.0% |
| Sudanese | 79.1 /100 | #153 | Good 12.0% |
| Syrians | 76.9 /100 | #154 | Good 12.1% |
| Ghanaians | 76.6 /100 | #155 | Good 12.1% |
| Moroccans | 72.9 /100 | #156 | Good 12.1% |
| Danes | 72.5 /100 | #157 | Good 12.1% |
| Immigrants | Middle Africa | 72.4 /100 | #158 | Good 12.1% |
| Immigrants | Central America | 67.7 /100 | #159 | Good 12.1% |
| Immigrants | Guatemala | 66.0 /100 | #160 | Good 12.1% |
Demographics Similar to Peruvians by Female Disability
In terms of female disability, the demographic groups most similar to Peruvians are Bulgarian (11.3%, a difference of 0.020%), Immigrants from Saudi Arabia (11.3%, a difference of 0.060%), Immigrants from Peru (11.3%, a difference of 0.10%), Immigrants from Belgium (11.3%, a difference of 0.22%), and Taiwanese (11.4%, a difference of 0.25%).
| Demographics | Rating | Rank | Female Disability |
| Jordanians | 100.0 /100 | #47 | Exceptional 11.3% |
| Zimbabweans | 100.0 /100 | #48 | Exceptional 11.3% |
| Tongans | 100.0 /100 | #49 | Exceptional 11.3% |
| Inupiat | 100.0 /100 | #50 | Exceptional 11.3% |
| Immigrants | Belgium | 100.0 /100 | #51 | Exceptional 11.3% |
| Immigrants | Peru | 99.9 /100 | #52 | Exceptional 11.3% |
| Immigrants | Saudi Arabia | 99.9 /100 | #53 | Exceptional 11.3% |
| Peruvians | 99.9 /100 | #54 | Exceptional 11.3% |
| Bulgarians | 99.9 /100 | #55 | Exceptional 11.3% |
| Taiwanese | 99.9 /100 | #56 | Exceptional 11.4% |
| South Americans | 99.9 /100 | #57 | Exceptional 11.4% |
| Laotians | 99.9 /100 | #58 | Exceptional 11.4% |
| Immigrants | Spain | 99.9 /100 | #59 | Exceptional 11.4% |
| Immigrants | Bulgaria | 99.9 /100 | #60 | Exceptional 11.4% |
| Immigrants | France | 99.9 /100 | #61 | Exceptional 11.4% |