Serbian vs Immigrants from Guatemala Female Disability
COMPARE
Serbian
Immigrants from Guatemala
Female Disability
Female Disability Comparison
Serbians
Immigrants from Guatemala
12.3%
FEMALE DISABILITY
33.1/ 100
METRIC RATING
187th/ 347
METRIC RANK
12.1%
FEMALE DISABILITY
66.0/ 100
METRIC RATING
160th/ 347
METRIC RANK
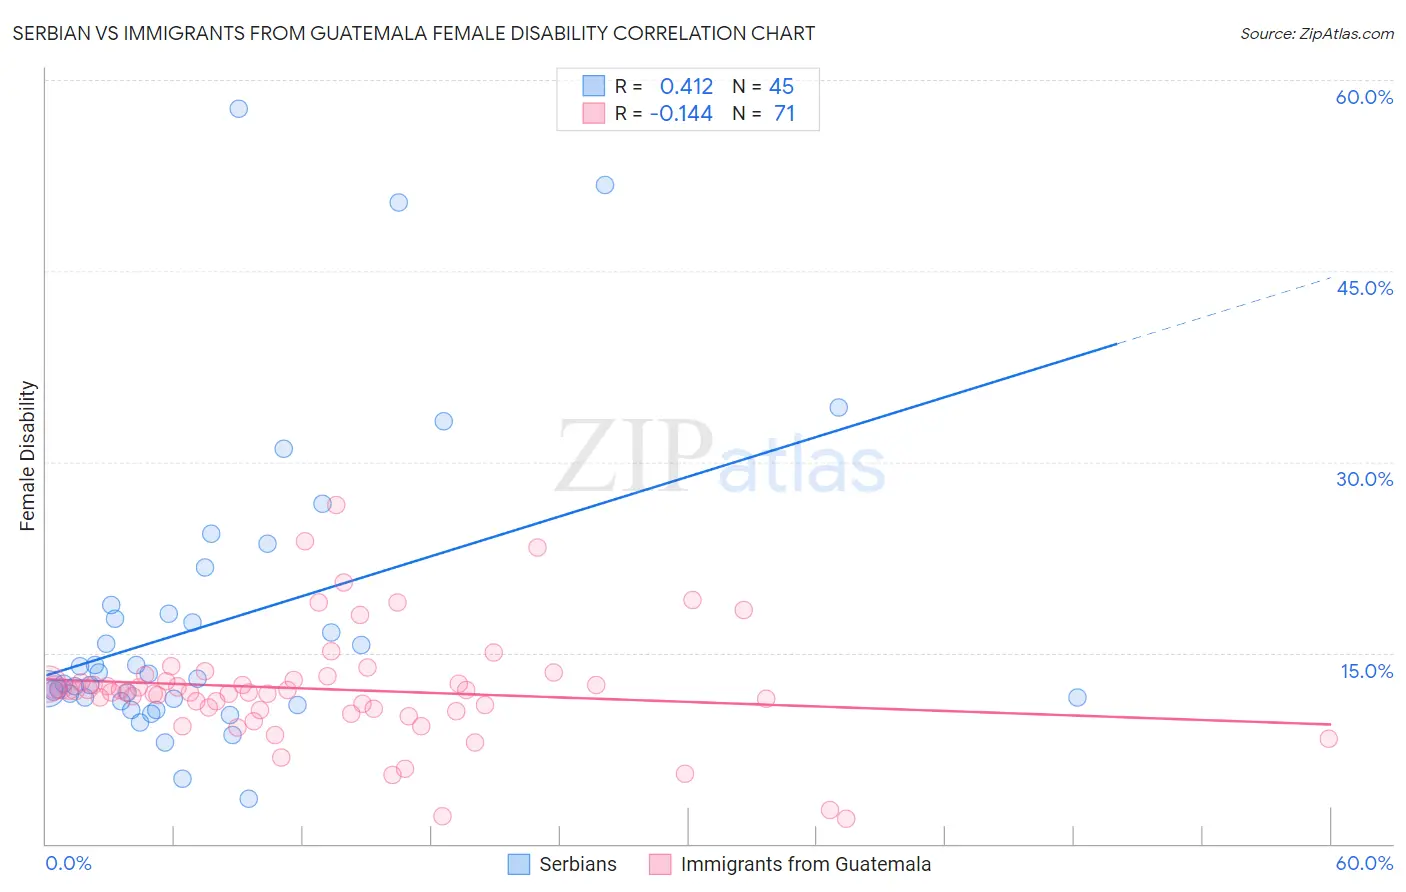
Serbian vs Immigrants from Guatemala Female Disability Correlation Chart
The statistical analysis conducted on geographies consisting of 267,642,282 people shows a moderate positive correlation between the proportion of Serbians and percentage of females with a disability in the United States with a correlation coefficient (R) of 0.412 and weighted average of 12.3%. Similarly, the statistical analysis conducted on geographies consisting of 377,228,850 people shows a poor negative correlation between the proportion of Immigrants from Guatemala and percentage of females with a disability in the United States with a correlation coefficient (R) of -0.144 and weighted average of 12.1%, a difference of 1.3%.
Female Disability Correlation Summary
| Measurement | Serbian | Immigrants from Guatemala |
| Minimum | 3.5% | 2.0% |
| Maximum | 57.7% | 26.6% |
| Range | 54.2% | 24.7% |
| Mean | 17.5% | 12.1% |
| Median | 12.9% | 12.0% |
| Interquartile 25% (IQ1) | 11.3% | 10.5% |
| Interquartile 75% (IQ3) | 18.4% | 12.9% |
| Interquartile Range (IQR) | 7.2% | 2.4% |
| Standard Deviation (Sample) | 11.8% | 4.4% |
| Standard Deviation (Population) | 11.6% | 4.3% |
Similar Demographics by Female Disability
Demographics Similar to Serbians by Female Disability
In terms of female disability, the demographic groups most similar to Serbians are Austrian (12.3%, a difference of 0.010%), Immigrants from North America (12.3%, a difference of 0.010%), Immigrants from Uzbekistan (12.3%, a difference of 0.030%), Immigrants from Albania (12.3%, a difference of 0.070%), and Immigrants from Honduras (12.3%, a difference of 0.080%).
| Demographics | Rating | Rank | Female Disability |
| Albanians | 37.9 /100 | #180 | Fair 12.3% |
| Immigrants | Canada | 37.2 /100 | #181 | Fair 12.3% |
| Norwegians | 36.9 /100 | #182 | Fair 12.3% |
| Cubans | 36.5 /100 | #183 | Fair 12.3% |
| Iraqis | 36.0 /100 | #184 | Fair 12.3% |
| Immigrants | Uzbekistan | 33.9 /100 | #185 | Fair 12.3% |
| Austrians | 33.3 /100 | #186 | Fair 12.3% |
| Serbians | 33.1 /100 | #187 | Fair 12.3% |
| Immigrants | North America | 32.8 /100 | #188 | Fair 12.3% |
| Immigrants | Albania | 31.6 /100 | #189 | Fair 12.3% |
| Immigrants | Honduras | 31.3 /100 | #190 | Fair 12.3% |
| Armenians | 29.7 /100 | #191 | Fair 12.3% |
| Immigrants | Western Africa | 29.2 /100 | #192 | Fair 12.3% |
| Northern Europeans | 27.5 /100 | #193 | Fair 12.3% |
| Ukrainians | 27.2 /100 | #194 | Fair 12.3% |
Demographics Similar to Immigrants from Guatemala by Female Disability
In terms of female disability, the demographic groups most similar to Immigrants from Guatemala are Guyanese (12.1%, a difference of 0.060%), Immigrants from Central America (12.1%, a difference of 0.070%), Immigrants from Ukraine (12.1%, a difference of 0.070%), Guatemalan (12.1%, a difference of 0.090%), and Czech (12.1%, a difference of 0.10%).
| Demographics | Rating | Rank | Female Disability |
| Sudanese | 79.1 /100 | #153 | Good 12.0% |
| Syrians | 76.9 /100 | #154 | Good 12.1% |
| Ghanaians | 76.6 /100 | #155 | Good 12.1% |
| Moroccans | 72.9 /100 | #156 | Good 12.1% |
| Danes | 72.5 /100 | #157 | Good 12.1% |
| Immigrants | Middle Africa | 72.4 /100 | #158 | Good 12.1% |
| Immigrants | Central America | 67.7 /100 | #159 | Good 12.1% |
| Immigrants | Guatemala | 66.0 /100 | #160 | Good 12.1% |
| Guyanese | 64.7 /100 | #161 | Good 12.1% |
| Immigrants | Ukraine | 64.3 /100 | #162 | Good 12.1% |
| Guatemalans | 63.8 /100 | #163 | Good 12.1% |
| Czechs | 63.6 /100 | #164 | Good 12.1% |
| Immigrants | Oceania | 61.8 /100 | #165 | Good 12.1% |
| Lithuanians | 59.5 /100 | #166 | Average 12.2% |
| Immigrants | Latin America | 59.0 /100 | #167 | Average 12.2% |