Northern European vs Immigrants from Haiti Female Disability

COMPARE

Northern European
Race
Ancestry
AfghanAfricanAlaska NativeAlaskan AthabascanAlbanianAleutAlsatianAmericanApacheArabArapahoArgentineanArmenianAssyrian/Chaldean/SyriacAustralianAustrianBahamianBangladeshiBarbadianBasqueBelgianBelizeanBermudanBhutaneseBlackfeetBolivianBrazilianBritishBritish West IndianBulgarianBurmeseCajunCambodianCanadianCape VerdeanCarpatho RusynCelticCentral AmericanCentral American IndianCherokeeCheyenneChickasawChileanChineseChippewaChoctawColombianColvilleComancheCosta RicanCreeCreekCroatianCrowCubanCypriotCzechCzechoslovakianDanishDelawareDominicanDutchDutch West IndianEastern EuropeanEcuadorianEgyptianEnglishEstonianEthiopianEuropeanFijianFilipinoFinnishFrenchFrench American IndianFrench CanadianGermanGerman RussianGhanaianGreekGuamanian/ChamorroGuatemalanGuyaneseHaitianHmongHonduranHopiHoumaHungarianIcelanderIndian (Asian)IndonesianInupiatIranianIraqiIrishIroquoisIsraeliItalianJamaicanJapaneseJordanianKenyanKiowaKoreanLaotianLatvianLebaneseLiberianLithuanianLumbeeLuxembourgerMacedonianMalaysianMalteseMarshalleseMenomineeMexicanMexican American IndianMongolianMoroccanNative HawaiianNavajoNepaleseNew ZealanderNicaraguanNigerianNorthern EuropeanNorwegianOkinawanOsageOttawaPaiutePakistaniPalestinianPanamanianParaguayanPennsylvania GermanPeruvianPimaPolishPortuguesePotawatomiPuebloPuerto RicanPuget Sound SalishRomanianRussianSalvadoranSamoanScandinavianScotch-IrishScottishSeminoleSenegaleseSerbianShoshoneSierra LeoneanSiouxSlavicSlovakSloveneSomaliSouth AfricanSouth AmericanSouth American IndianSoviet UnionSpaniardSpanishSpanish AmericanSpanish American IndianSri LankanSubsaharan AfricanSudaneseSwedishSwissSyrianTaiwaneseThaiTlingit-HaidaTohono O'OdhamTonganTrinidadian and TobagonianTsimshianTurkishU.S. Virgin IslanderUgandanUkrainianUruguayanUteVenezuelanVietnameseWelshWest IndianYakamaYaquiYugoslavianYumanYup'ikZimbabwean
Immigration
NonimmigrantsImmigrantsAfghanistanAfricaAlbaniaArgentinaArmeniaAsiaAustraliaAustriaBahamasBangladeshBarbadosBelarusBelgiumBelizeBoliviaBosnia and HerzegovinaBrazilBulgariaBurma/MyanmarCabo VerdeCambodiaCameroonCanadaCaribbeanCentral AmericaChileChinaColombiaCongoCosta RicaCroatiaCubaCzechoslovakiaDenmarkDominicaDominican RepublicEastern AfricaEastern AsiaEastern EuropeEcuadorEgyptEl SalvadorEnglandEritreaEthiopiaEuropeFijiFranceGermanyGhanaGreeceGrenadaGuatemalaGuyanaHondurasHong KongHungaryIndiaIndonesiaIranIraqIrelandIsraelItalyJamaicaJapanJordanKazakhstanKenyaKoreaKuwaitLaosLatin AmericaLatviaLebanonLiberiaLithuaniaMalaysiaMexicoMicronesiaMiddle AfricaMoldovaMoroccoNepalNetherlandsNicaraguaNigeriaNorth AmericaNorth MacedoniaNorthern AfricaNorthern EuropeNorwayOceaniaPakistanPanamaPeruPhilippinesPolandPortugalRomaniaRussiaSaudi ArabiaScotlandSenegalSerbiaSierra LeoneSingaporeSomaliaSouth AfricaSouth AmericaSouth Central AsiaSouth Eastern AsiaSouthern EuropeSpainSri LankaSt. Vincent and the GrenadinesSudanSwedenSwitzerlandSyriaTaiwanThailandTrinidad and TobagoTurkeyUgandaUkraineUruguayUzbekistanVenezuelaVietnamWest IndiesWestern AfricaWestern AsiaWestern EuropeYemenZaireZimbabweAzores
Immigrants from Haiti
Race
Ancestry
AfghanAfricanAlaska NativeAlaskan AthabascanAlbanianAleutAlsatianAmericanApacheArabArapahoArgentineanArmenianAssyrian/Chaldean/SyriacAustralianAustrianBahamianBangladeshiBarbadianBasqueBelgianBelizeanBermudanBhutaneseBlackfeetBolivianBrazilianBritishBritish West IndianBulgarianBurmeseCajunCambodianCanadianCape VerdeanCarpatho RusynCelticCentral AmericanCentral American IndianCherokeeCheyenneChickasawChileanChineseChippewaChoctawColombianColvilleComancheCosta RicanCreeCreekCroatianCrowCubanCypriotCzechCzechoslovakianDanishDelawareDominicanDutchDutch West IndianEastern EuropeanEcuadorianEgyptianEnglishEstonianEthiopianEuropeanFijianFilipinoFinnishFrenchFrench American IndianFrench CanadianGermanGerman RussianGhanaianGreekGuamanian/ChamorroGuatemalanGuyaneseHaitianHmongHonduranHopiHoumaHungarianIcelanderIndian (Asian)IndonesianInupiatIranianIraqiIrishIroquoisIsraeliItalianJamaicanJapaneseJordanianKenyanKiowaKoreanLaotianLatvianLebaneseLiberianLithuanianLumbeeLuxembourgerMacedonianMalaysianMalteseMarshalleseMenomineeMexicanMexican American IndianMongolianMoroccanNative HawaiianNavajoNepaleseNew ZealanderNicaraguanNigerianNorwegianOkinawanOsageOttawaPaiutePakistaniPalestinianPanamanianParaguayanPennsylvania GermanPeruvianPimaPolishPortuguesePotawatomiPuebloPuerto RicanPuget Sound SalishRomanianRussianSalvadoranSamoanScandinavianScotch-IrishScottishSeminoleSenegaleseSerbianShoshoneSierra LeoneanSiouxSlavicSlovakSloveneSomaliSouth AfricanSouth AmericanSouth American IndianSoviet UnionSpaniardSpanishSpanish AmericanSpanish American IndianSri LankanSubsaharan AfricanSudaneseSwedishSwissSyrianTaiwaneseThaiTlingit-HaidaTohono O'OdhamTonganTrinidadian and TobagonianTsimshianTurkishU.S. Virgin IslanderUgandanUkrainianUruguayanUteVenezuelanVietnameseWelshWest IndianYakamaYaquiYugoslavianYumanYup'ikZimbabwean
Immigration
NonimmigrantsImmigrantsAfghanistanAfricaAlbaniaArgentinaArmeniaAsiaAustraliaAustriaBahamasBangladeshBarbadosBelarusBelgiumBelizeBoliviaBosnia and HerzegovinaBrazilBulgariaBurma/MyanmarCabo VerdeCambodiaCameroonCanadaCaribbeanCentral AmericaChileChinaColombiaCongoCosta RicaCroatiaCubaCzechoslovakiaDenmarkDominicaDominican RepublicEastern AfricaEastern AsiaEastern EuropeEcuadorEgyptEl SalvadorEnglandEritreaEthiopiaEuropeFijiFranceGermanyGhanaGreeceGrenadaGuatemalaGuyanaHaitiHondurasHong KongHungaryIndiaIndonesiaIranIraqIrelandIsraelItalyJamaicaJapanJordanKazakhstanKenyaKoreaKuwaitLaosLatin AmericaLatviaLebanonLiberiaLithuaniaMalaysiaMexicoMicronesiaMiddle AfricaMoldovaMoroccoNepalNetherlandsNicaraguaNigeriaNorth AmericaNorth MacedoniaNorthern AfricaNorthern EuropeNorwayOceaniaPakistanPanamaPeruPhilippinesPolandPortugalRomaniaRussiaSaudi ArabiaScotlandSenegalSerbiaSierra LeoneSingaporeSomaliaSouth AfricaSouth AmericaSouth Central AsiaSouth Eastern AsiaSouthern EuropeSpainSri LankaSt. Vincent and the GrenadinesSudanSwedenSwitzerlandSyriaTaiwanThailandTrinidad and TobagoTurkeyUgandaUkraineUruguayUzbekistanVenezuelaVietnamWest IndiesWestern AfricaWestern AsiaWestern EuropeYemenZaireZimbabweAzores
Female Disability
Income
Poverty
Unemployment
Labor Participation
Family Structure
Vehicle Availability
Education Level
Disability

Female Disability Comparison

Northern Europeans

Immigrants from Haiti

Fair
Average
12.3%
FEMALE DISABILITY
27.5/ 100
METRIC RATING
193rd/ 347
METRIC RANK
12.2%
FEMALE DISABILITY
58.8/ 100
METRIC RATING
168th/ 347
METRIC RANK

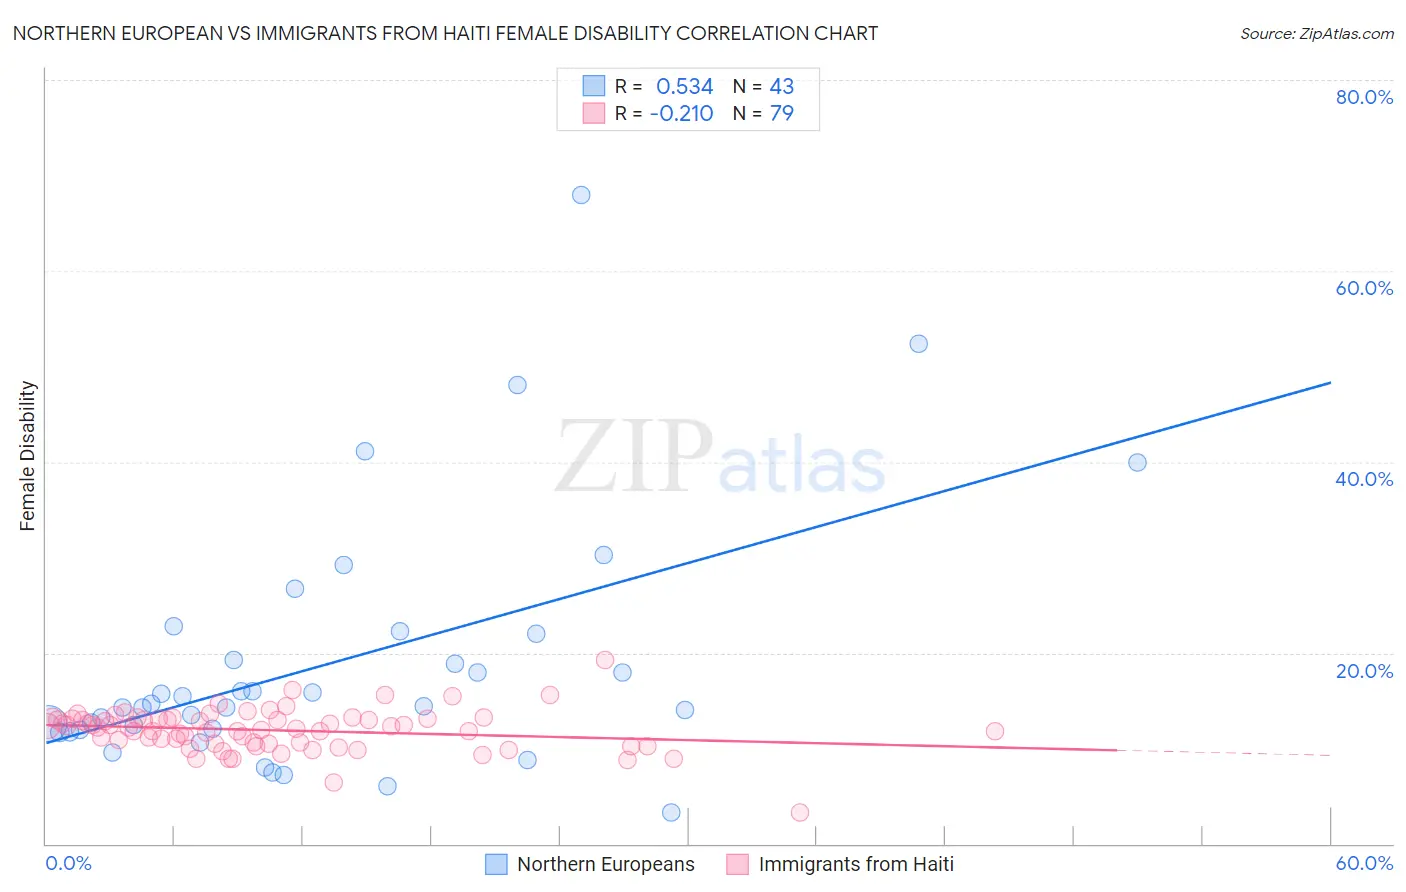
Northern European vs Immigrants from Haiti Female Disability Correlation Chart

The statistical analysis conducted on geographies consisting of 406,028,817 people shows a substantial positive correlation between the proportion of Northern Europeans and percentage of females with a disability in the United States with a correlation coefficient (R) of 0.534 and weighted average of 12.3%. Similarly, the statistical analysis conducted on geographies consisting of 225,238,794 people shows a weak negative correlation between the proportion of Immigrants from Haiti and percentage of females with a disability in the United States with a correlation coefficient (R) of -0.210 and weighted average of 12.2%, a difference of 1.3%.
Northern European vs Immigrants from Haiti Female Disability

Female Disability Correlation Summary

MeasurementNorthern EuropeanImmigrants from Haiti
Minimum3.3%3.3%
Maximum68.0%19.2%
Range64.7%15.9%
Mean18.9%11.9%
Median14.4%12.1%
Interquartile 25% (IQ1)12.0%10.5%
Interquartile 75% (IQ3)22.0%13.1%
Interquartile Range (IQR)10.0%2.6%
Standard Deviation (Sample)13.1%2.2%
Standard Deviation (Population)13.0%2.2%

Similar Demographics by Female Disability

Demographics Similar to Northern Europeans by Female Disability

In terms of female disability, the demographic groups most similar to Northern Europeans are Ukrainian (12.3%, a difference of 0.010%), Swedish (12.3%, a difference of 0.040%), Immigrants from Western Africa (12.3%, a difference of 0.080%), Armenian (12.3%, a difference of 0.10%), and Immigrants from Panama (12.3%, a difference of 0.10%).
DemographicsRating | RankFemale Disability
Austrians
33.3
/100
|
#186
Fair
12.3%
Serbians
33.1
/100
|
#187
Fair
12.3%
Immigrants | North America
32.8
/100
|
#188
Fair
12.3%
Immigrants | Albania
31.6
/100
|
#189
Fair
12.3%
Immigrants | Honduras
31.3
/100
|
#190
Fair
12.3%
Armenians
29.7
/100
|
#191
Fair
12.3%
Immigrants | Western Africa
29.2
/100
|
#192
Fair
12.3%
Northern Europeans
27.5
/100
|
#193
Fair
12.3%
Ukrainians
27.2
/100
|
#194
Fair
12.3%
Swedes
26.6
/100
|
#195
Fair
12.3%
Immigrants | Panama
25.5
/100
|
#196
Fair
12.3%
Hondurans
25.4
/100
|
#197
Fair
12.3%
Mexican American Indians
24.9
/100
|
#198
Fair
12.3%
Immigrants | Trinidad and Tobago
24.7
/100
|
#199
Fair
12.3%
Trinidadians and Tobagonians
22.4
/100
|
#200
Fair
12.3%

Demographics Similar to Immigrants from Haiti by Female Disability

In terms of female disability, the demographic groups most similar to Immigrants from Haiti are Immigrants from Latin America (12.2%, a difference of 0.010%), Lithuanian (12.2%, a difference of 0.030%), Lebanese (12.2%, a difference of 0.030%), Maltese (12.2%, a difference of 0.070%), and Immigrants from Southern Europe (12.2%, a difference of 0.10%).
DemographicsRating | RankFemale Disability
Guyanese
64.7
/100
|
#161
Good
12.1%
Immigrants | Ukraine
64.3
/100
|
#162
Good
12.1%
Guatemalans
63.8
/100
|
#163
Good
12.1%
Czechs
63.6
/100
|
#164
Good
12.1%
Immigrants | Oceania
61.8
/100
|
#165
Good
12.1%
Lithuanians
59.5
/100
|
#166
Average
12.2%
Immigrants | Latin America
59.0
/100
|
#167
Average
12.2%
Immigrants | Haiti
58.8
/100
|
#168
Average
12.2%
Lebanese
58.1
/100
|
#169
Average
12.2%
Maltese
57.0
/100
|
#170
Average
12.2%
Immigrants | Southern Europe
56.3
/100
|
#171
Average
12.2%
Haitians
51.9
/100
|
#172
Average
12.2%
Immigrants | Mexico
50.8
/100
|
#173
Average
12.2%
Immigrants | England
50.0
/100
|
#174
Average
12.2%
Immigrants | St. Vincent and the Grenadines
49.7
/100
|
#175
Average
12.2%