Northern European Male Disability
COMPARE
Northern European
Select to Compare
Male Disability
Northern European Male Disability
11.9%
DISABILITY | MALES
1.1/ 100
METRIC RATING
242nd/ 347
METRIC RANK
Northern European Male Disability Correlation Chart
The statistical analysis conducted on geographies consisting of 406,040,370 people shows a strong positive correlation between the proportion of Northern Europeans and percentage of males with a disability in the United States with a correlation coefficient (R) of 0.707 and weighted average of 11.9%. On average, for every 1% (one percent) increase in Northern Europeans within a typical geography, there is an increase of 1.1% in percentage of males with a disability.
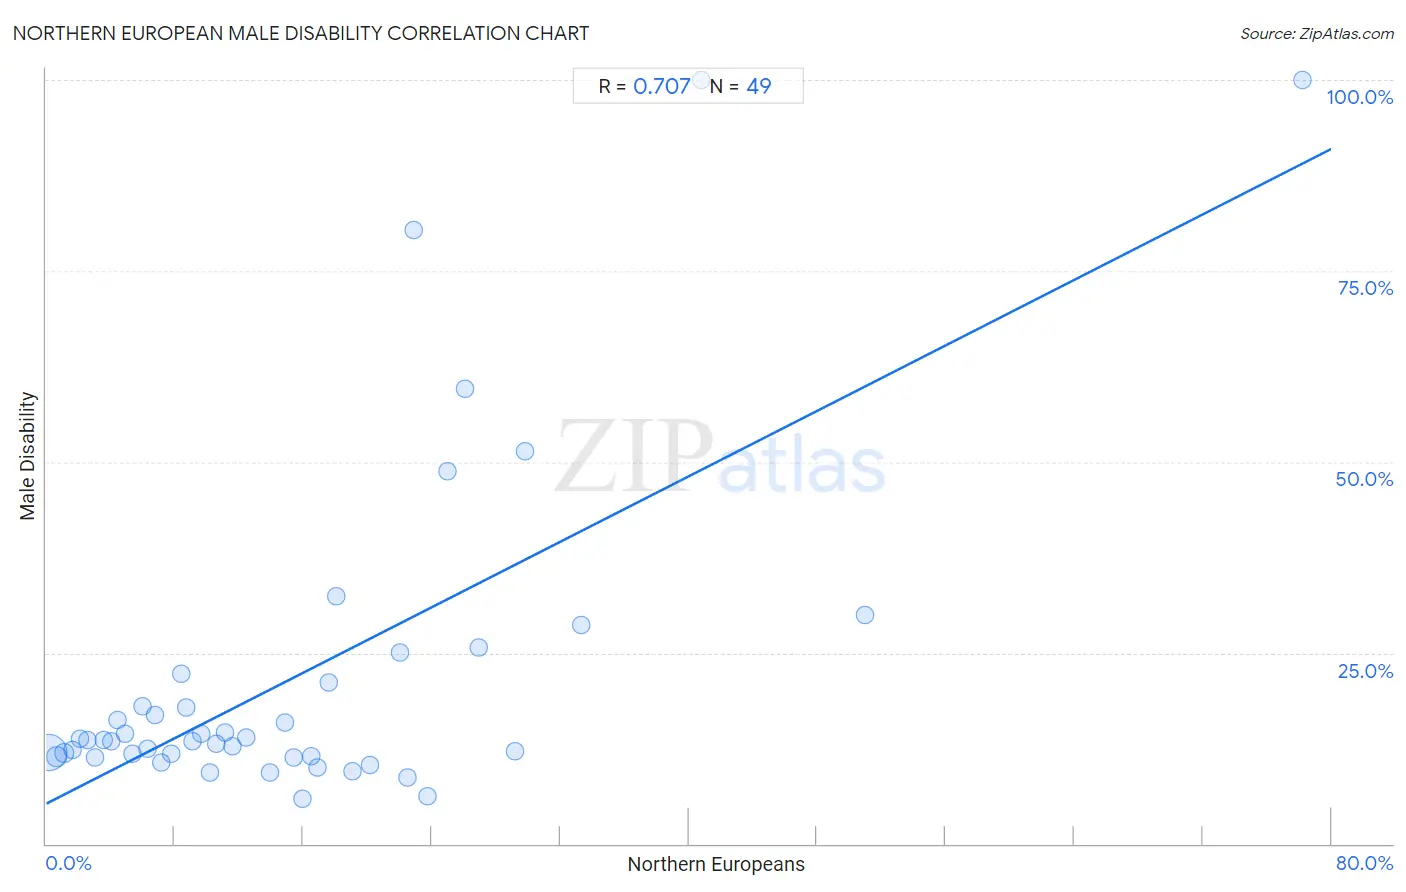
It is essential to understand that the correlation between the percentage of Northern Europeans and percentage of males with a disability does not imply a direct cause-and-effect relationship. It remains uncertain whether the presence of Northern Europeans influences an upward or downward trend in the level of percentage of males with a disability within an area, or if Northern Europeans simply ended up residing in those areas with higher or lower levels of percentage of males with a disability due to other factors.
Demographics Similar to Northern Europeans by Male Disability
In terms of male disability, the demographic groups most similar to Northern Europeans are Bahamian (11.9%, a difference of 0.010%), Samoan (11.9%, a difference of 0.030%), Czech (11.9%, a difference of 0.050%), Italian (11.9%, a difference of 0.10%), and Immigrants from Laos (11.9%, a difference of 0.14%).
| Demographics | Rating | Rank | Male Disability |
| Immigrants from North America | 1.5 /100 | #235 | Tragic 11.9% |
| U.S. Virgin Islanders | 1.3 /100 | #236 | Tragic 11.9% |
| Carpatho Rusyns | 1.3 /100 | #237 | Tragic 11.9% |
| Yugoslavians | 1.2 /100 | #238 | Tragic 11.9% |
| Italians | 1.2 /100 | #239 | Tragic 11.9% |
| Czechs | 1.1 /100 | #240 | Tragic 11.9% |
| Bahamians | 1.1 /100 | #241 | Tragic 11.9% |
| Northern Europeans | 1.1 /100 | #242 | Tragic 11.9% |
| Samoans | 1.1 /100 | #243 | Tragic 11.9% |
| Immigrants from Laos | 1.0 /100 | #244 | Tragic 11.9% |
| Immigrants from Liberia | 1.0 /100 | #245 | Tragic 11.9% |
| Danes | 0.9 /100 | #246 | Tragic 11.9% |
| Hungarians | 0.8 /100 | #247 | Tragic 12.0% |
| Poles | 0.7 /100 | #248 | Tragic 12.0% |
| Immigrants from Yemen | 0.5 /100 | #249 | Tragic 12.0% |
Northern European Male Disability Correlation Summary
| Measurement | Northern European Data | Male Disability Data |
| Minimum | 0.15% | 5.8% |
| Maximum | 78.2% | 100.0% |
| Range | 78.1% | 94.2% |
| Mean | 15.5% | 21.8% |
| Median | 11.6% | 13.6% |
| Interquartile 25% (IQ1) | 5.7% | 11.5% |
| Interquartile 75% (IQ3) | 22.2% | 21.7% |
| Interquartile Range (IQR) | 16.6% | 10.3% |
| Standard Deviation (Sample) | 14.3% | 21.6% |
| Standard Deviation (Population) | 14.1% | 21.4% |
Correlation Details
| Northern European Percentile | Sample Size | Male Disability |
[ 0.0% - 0.5% ] 0.15% | 366,542,481 | 11.9% |
[ 0.5% - 1.0% ] 0.64% | 31,296,619 | 11.4% |
[ 1.0% - 1.5% ] 1.12% | 5,039,032 | 11.9% |
[ 1.5% - 2.0% ] 1.60% | 1,806,916 | 12.3% |
[ 2.0% - 2.5% ] 2.09% | 512,665 | 13.7% |
[ 2.5% - 3.0% ] 2.55% | 274,330 | 13.6% |
[ 3.0% - 3.5% ] 3.07% | 150,100 | 11.4% |
[ 3.5% - 4.0% ] 3.54% | 137,387 | 13.6% |
[ 4.0% - 4.5% ] 4.07% | 100,180 | 13.5% |
[ 4.0% - 4.5% ] 4.47% | 35,053 | 16.2% |
[ 4.5% - 5.0% ] 4.91% | 42,265 | 14.5% |
[ 5.0% - 5.5% ] 5.37% | 35,815 | 11.8% |
[ 5.5% - 6.0% ] 5.96% | 8,232 | 17.9% |
[ 6.0% - 6.5% ] 6.33% | 4,405 | 12.5% |
[ 6.5% - 7.0% ] 6.80% | 9,238 | 16.8% |
[ 7.0% - 7.5% ] 7.17% | 4,576 | 10.6% |
[ 7.5% - 8.0% ] 7.76% | 3,262 | 11.7% |
[ 8.0% - 8.5% ] 8.38% | 4,678 | 22.3% |
[ 8.5% - 9.0% ] 8.74% | 4,464 | 17.9% |
[ 9.0% - 9.5% ] 9.08% | 3,027 | 13.5% |
[ 9.5% - 10.0% ] 9.62% | 2,548 | 14.4% |
[ 10.0% - 10.5% ] 10.21% | 656 | 9.4% |
[ 10.5% - 11.0% ] 10.56% | 4,234 | 13.1% |
[ 11.0% - 11.5% ] 11.10% | 3,127 | 14.6% |
[ 11.5% - 12.0% ] 11.60% | 3,077 | 12.8% |
[ 12.0% - 12.5% ] 12.49% | 961 | 14.0% |
[ 13.5% - 14.0% ] 13.89% | 1,087 | 9.3% |
[ 14.5% - 15.0% ] 14.86% | 276 | 15.9% |
[ 15.0% - 15.5% ] 15.38% | 156 | 11.4% |
[ 15.5% - 16.0% ] 15.93% | 1,023 | 5.8% |
[ 16.0% - 16.5% ] 16.50% | 1,370 | 11.5% |
[ 16.5% - 17.0% ] 16.92% | 130 | 10.1% |
[ 17.5% - 18.0% ] 17.61% | 1,198 | 21.1% |
[ 18.0% - 18.5% ] 18.03% | 61 | 32.4% |
[ 19.0% - 19.5% ] 19.07% | 813 | 9.5% |
[ 20.0% - 20.5% ] 20.14% | 422 | 10.3% |
[ 22.0% - 22.5% ] 22.03% | 454 | 25.1% |
[ 22.0% - 22.5% ] 22.47% | 1,286 | 8.7% |
[ 22.5% - 23.0% ] 22.89% | 249 | 80.3% |
[ 23.5% - 24.0% ] 23.73% | 118 | 6.2% |
[ 25.0% - 25.5% ] 25.00% | 68 | 48.8% |
[ 26.0% - 26.5% ] 26.05% | 906 | 59.5% |
[ 26.5% - 27.0% ] 26.92% | 78 | 25.6% |
[ 29.0% - 29.5% ] 29.20% | 565 | 12.0% |
[ 29.5% - 30.0% ] 29.83% | 352 | 51.3% |
[ 33.0% - 33.5% ] 33.33% | 12 | 28.6% |
[ 40.5% - 41.0% ] 40.74% | 54 | 100.0% |
[ 50.5% - 51.0% ] 50.95% | 263 | 30.0% |
[ 78.0% - 78.5% ] 78.22% | 101 | 100.0% |