Chinese vs Immigrants from Venezuela Female Disability
COMPARE
Chinese
Immigrants from Venezuela
Female Disability
Female Disability Comparison
Chinese
Immigrants from Venezuela
12.3%
FEMALE DISABILITY
22.1/ 100
METRIC RATING
201st/ 347
METRIC RANK
10.9%
FEMALE DISABILITY
100.0/ 100
METRIC RATING
19th/ 347
METRIC RANK
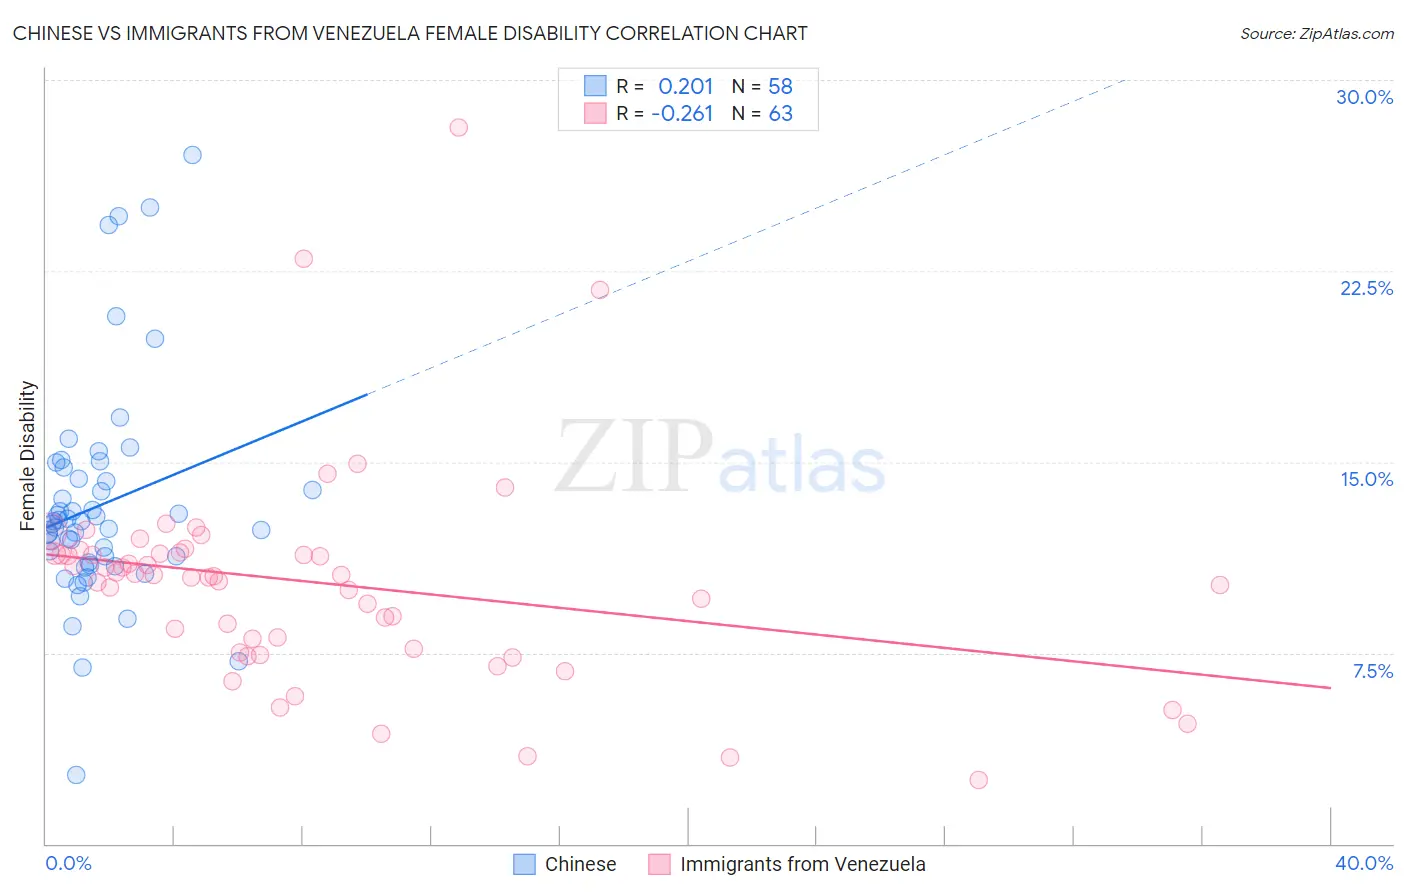
Chinese vs Immigrants from Venezuela Female Disability Correlation Chart
The statistical analysis conducted on geographies consisting of 64,802,500 people shows a weak positive correlation between the proportion of Chinese and percentage of females with a disability in the United States with a correlation coefficient (R) of 0.201 and weighted average of 12.3%. Similarly, the statistical analysis conducted on geographies consisting of 287,842,421 people shows a weak negative correlation between the proportion of Immigrants from Venezuela and percentage of females with a disability in the United States with a correlation coefficient (R) of -0.261 and weighted average of 10.9%, a difference of 13.7%.
Female Disability Correlation Summary
| Measurement | Chinese | Immigrants from Venezuela |
| Minimum | 2.7% | 2.5% |
| Maximum | 27.1% | 28.1% |
| Range | 24.4% | 25.6% |
| Mean | 13.3% | 10.2% |
| Median | 12.6% | 10.5% |
| Interquartile 25% (IQ1) | 11.1% | 7.7% |
| Interquartile 75% (IQ3) | 14.3% | 11.4% |
| Interquartile Range (IQR) | 3.3% | 3.7% |
| Standard Deviation (Sample) | 4.3% | 4.2% |
| Standard Deviation (Population) | 4.3% | 4.2% |
Similar Demographics by Female Disability
Demographics Similar to Chinese by Female Disability
In terms of female disability, the demographic groups most similar to Chinese are Trinidadian and Tobagonian (12.3%, a difference of 0.010%), Somali (12.3%, a difference of 0.030%), Immigrants from Barbados (12.3%, a difference of 0.050%), Immigrants from Zaire (12.3%, a difference of 0.070%), and Immigrants from Grenada (12.4%, a difference of 0.090%).
| Demographics | Rating | Rank | Female Disability |
| Ukrainians | 27.2 /100 | #194 | Fair 12.3% |
| Swedes | 26.6 /100 | #195 | Fair 12.3% |
| Immigrants | Panama | 25.5 /100 | #196 | Fair 12.3% |
| Hondurans | 25.4 /100 | #197 | Fair 12.3% |
| Mexican American Indians | 24.9 /100 | #198 | Fair 12.3% |
| Immigrants | Trinidad and Tobago | 24.7 /100 | #199 | Fair 12.3% |
| Trinidadians and Tobagonians | 22.4 /100 | #200 | Fair 12.3% |
| Chinese | 22.1 /100 | #201 | Fair 12.3% |
| Somalis | 21.5 /100 | #202 | Fair 12.3% |
| Immigrants | Barbados | 21.1 /100 | #203 | Fair 12.3% |
| Immigrants | Zaire | 20.9 /100 | #204 | Fair 12.3% |
| Immigrants | Grenada | 20.5 /100 | #205 | Fair 12.4% |
| Immigrants | Cuba | 20.2 /100 | #206 | Fair 12.4% |
| Croatians | 20.2 /100 | #207 | Fair 12.4% |
| Basques | 17.5 /100 | #208 | Poor 12.4% |
Demographics Similar to Immigrants from Venezuela by Female Disability
In terms of female disability, the demographic groups most similar to Immigrants from Venezuela are Immigrants from Pakistan (10.9%, a difference of 0.17%), Immigrants from Iran (10.8%, a difference of 0.21%), Asian (10.9%, a difference of 0.54%), Indian (Asian) (10.8%, a difference of 0.60%), and Immigrants from Sri Lanka (10.9%, a difference of 0.66%).
| Demographics | Rating | Rank | Female Disability |
| Immigrants | Israel | 100.0 /100 | #12 | Exceptional 10.7% |
| Immigrants | Eastern Asia | 100.0 /100 | #13 | Exceptional 10.7% |
| Immigrants | China | 100.0 /100 | #14 | Exceptional 10.7% |
| Burmese | 100.0 /100 | #15 | Exceptional 10.7% |
| Okinawans | 100.0 /100 | #16 | Exceptional 10.8% |
| Indians (Asian) | 100.0 /100 | #17 | Exceptional 10.8% |
| Immigrants | Iran | 100.0 /100 | #18 | Exceptional 10.8% |
| Immigrants | Venezuela | 100.0 /100 | #19 | Exceptional 10.9% |
| Immigrants | Pakistan | 100.0 /100 | #20 | Exceptional 10.9% |
| Asians | 100.0 /100 | #21 | Exceptional 10.9% |
| Immigrants | Sri Lanka | 100.0 /100 | #22 | Exceptional 10.9% |
| Venezuelans | 100.0 /100 | #23 | Exceptional 11.0% |
| Immigrants | Argentina | 100.0 /100 | #24 | Exceptional 11.0% |
| Immigrants | Asia | 100.0 /100 | #25 | Exceptional 11.0% |
| Argentineans | 100.0 /100 | #26 | Exceptional 11.0% |