Red Butte, WY Map & Demographics
Red Butte Map
Red Butte Overview
$36,045
PER CAPITA INCOME
$177,689
AVG FAMILY INCOME
$177,631
AVG HOUSEHOLD INCOME
0.24
INEQUALITY / GINI INDEX
758
TOTAL POPULATION
380
MALE POPULATION
378
FEMALE POPULATION
100.53
MALES / 100 FEMALES
99.47
FEMALES / 100 MALES
15.7
MEDIAN AGE
3.8
AVG FAMILY SIZE
3.7
AVG HOUSEHOLD SIZE
260
LABOR FORCE [ PEOPLE ]
70.3%
PERCENT IN LABOR FORCE
Income in Red Butte
Income Overview in Red Butte
Per Capita Income in Red Butte is $36,045, while median incomes of families and households are $177,689 and $177,631 respectively.
| Characteristic | Number | Measure |
| Per Capita Income | 758 | $36,045 |
| Median Family Income | 185 | $177,689 |
| Mean Family Income | 185 | $133,494 |
| Median Household Income | 203 | $177,631 |
| Mean Household Income | 203 | $136,005 |
| Income Deficit | 185 | $0 |
| Wage / Income Gap (%) | 758 | 0.00% |
| Wage / Income Gap ($) | 758 | 100.00¢ per $1 |
| Gini / Inequality Index | 758 | 0.24 |
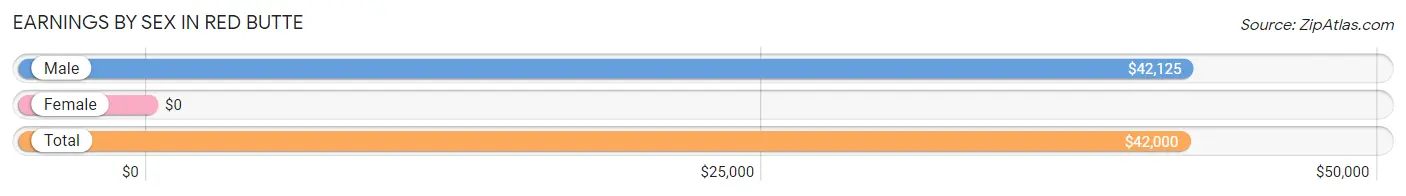
Earnings by Sex in Red Butte
| Sex | Number | Average Earnings |
| Male | 179 (67.3%) | $42,125 |
| Female | 87 (32.7%) | $0 |
| Total | 266 (100.0%) | $42,000 |
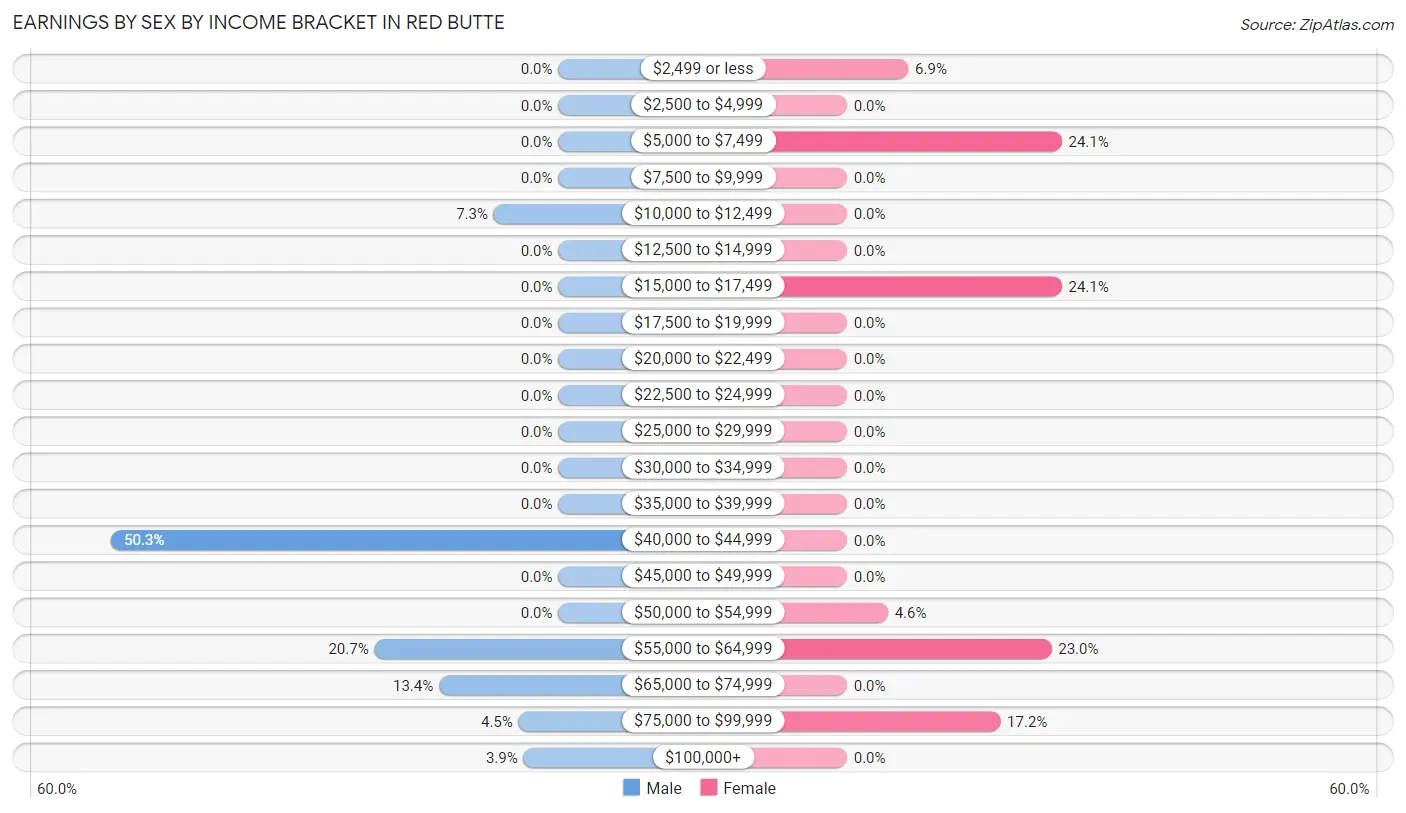
Earnings by Sex by Income Bracket in Red Butte
The most common earnings brackets in Red Butte are $40,000 to $44,999 for men (90 | 50.3%) and $5,000 to $7,499 for women (21 | 24.1%).
| Income | Male | Female |
| $2,499 or less | 0 (0.0%) | 6 (6.9%) |
| $2,500 to $4,999 | 0 (0.0%) | 0 (0.0%) |
| $5,000 to $7,499 | 0 (0.0%) | 21 (24.1%) |
| $7,500 to $9,999 | 0 (0.0%) | 0 (0.0%) |
| $10,000 to $12,499 | 13 (7.3%) | 0 (0.0%) |
| $12,500 to $14,999 | 0 (0.0%) | 0 (0.0%) |
| $15,000 to $17,499 | 0 (0.0%) | 21 (24.1%) |
| $17,500 to $19,999 | 0 (0.0%) | 0 (0.0%) |
| $20,000 to $22,499 | 0 (0.0%) | 0 (0.0%) |
| $22,500 to $24,999 | 0 (0.0%) | 0 (0.0%) |
| $25,000 to $29,999 | 0 (0.0%) | 0 (0.0%) |
| $30,000 to $34,999 | 0 (0.0%) | 0 (0.0%) |
| $35,000 to $39,999 | 0 (0.0%) | 0 (0.0%) |
| $40,000 to $44,999 | 90 (50.3%) | 0 (0.0%) |
| $45,000 to $49,999 | 0 (0.0%) | 0 (0.0%) |
| $50,000 to $54,999 | 0 (0.0%) | 4 (4.6%) |
| $55,000 to $64,999 | 37 (20.7%) | 20 (23.0%) |
| $65,000 to $74,999 | 24 (13.4%) | 0 (0.0%) |
| $75,000 to $99,999 | 8 (4.5%) | 15 (17.2%) |
| $100,000+ | 7 (3.9%) | 0 (0.0%) |
| Total | 179 (100.0%) | 87 (100.0%) |
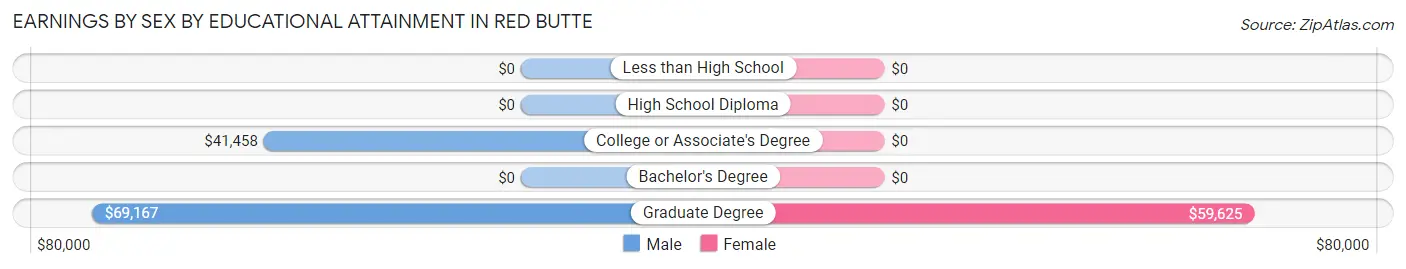
Earnings by Sex by Educational Attainment in Red Butte
| Educational Attainment | Male Income | Female Income |
| Less than High School | - | - |
| High School Diploma | - | - |
| College or Associate's Degree | $41,458 | $0 |
| Bachelor's Degree | - | - |
| Graduate Degree | $69,167 | $59,625 |
| Total | $42,125 | $0 |
Family Income in Red Butte
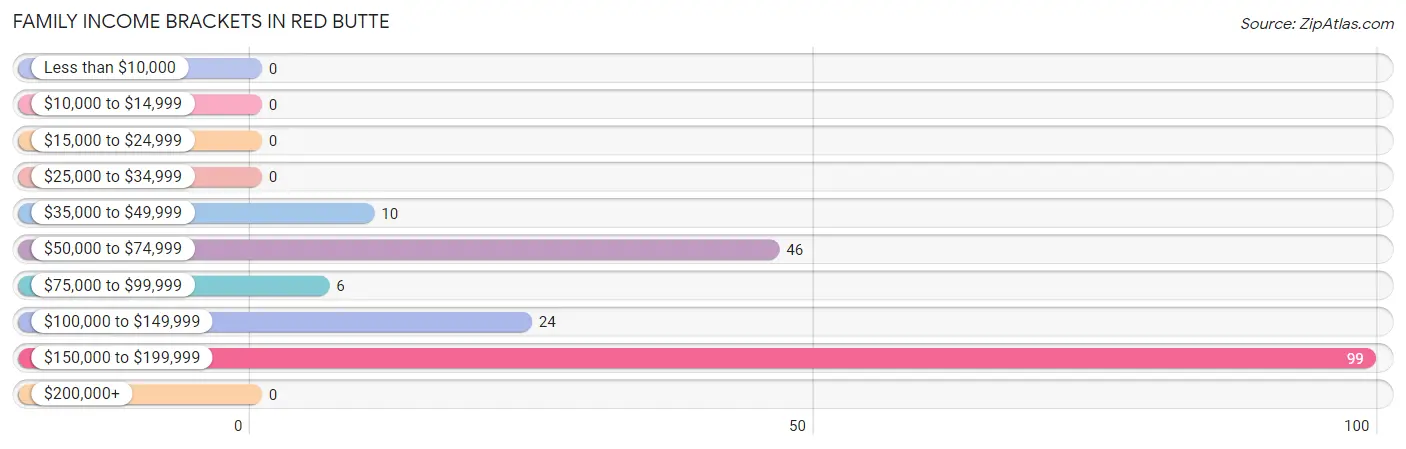
Family Income Brackets in Red Butte
According to the Red Butte family income data, there are 99 families falling into the $150,000 to $199,999 income range, which is the most common income bracket and makes up 53.5% of all families.
| Income Bracket | # Families | % Families |
| Less than $10,000 | 0 | 0.0% |
| $10,000 to $14,999 | 0 | 0.0% |
| $15,000 to $24,999 | 0 | 0.0% |
| $25,000 to $34,999 | 0 | 0.0% |
| $35,000 to $49,999 | 10 | 5.4% |
| $50,000 to $74,999 | 46 | 24.9% |
| $75,000 to $99,999 | 6 | 3.2% |
| $100,000 to $149,999 | 24 | 13.0% |
| $150,000 to $199,999 | 99 | 53.5% |
| $200,000+ | 0 | 0.0% |
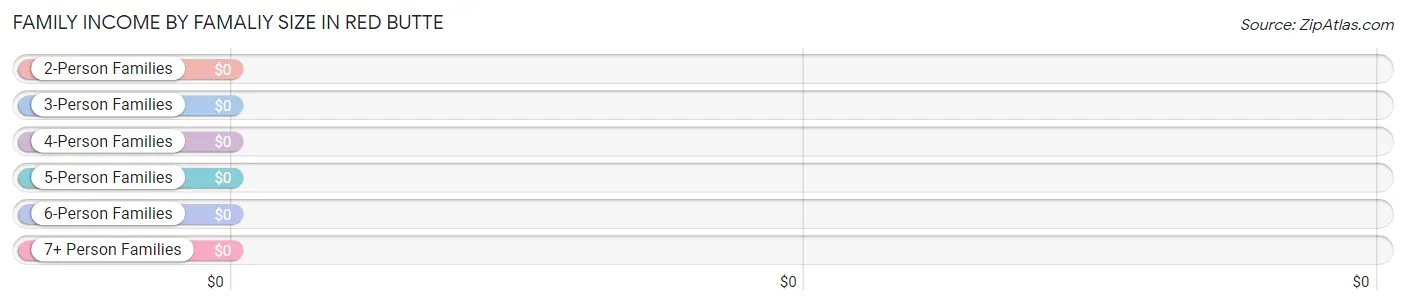
Family Income by Famaliy Size in Red Butte
| Income Bracket | # Families | Median Income |
| 2-Person Families | 29 (15.7%) | $0 |
| 3-Person Families | 22 (11.9%) | $0 |
| 4-Person Families | 4 (2.2%) | $0 |
| 5-Person Families | 106 (57.3%) | $0 |
| 6-Person Families | 24 (13.0%) | $0 |
| 7+ Person Families | 0 (0.0%) | $0 |
| Total | 185 (100.0%) | $177,689 |
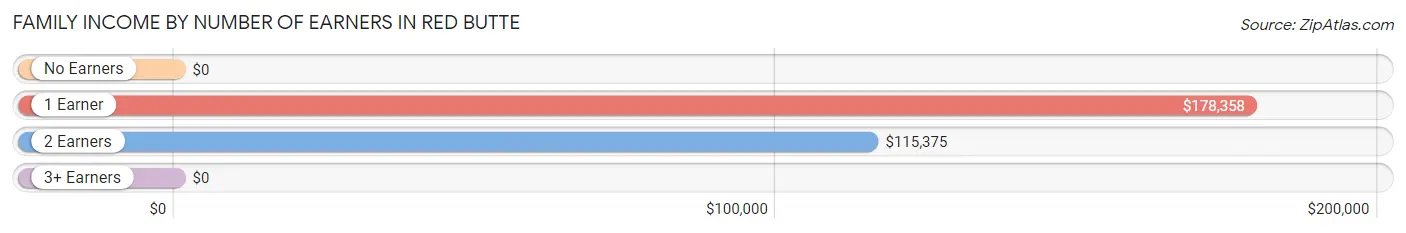
Family Income by Number of Earners in Red Butte
| Number of Earners | # Families | Median Income |
| No Earners | 16 (8.6%) | $0 |
| 1 Earner | 113 (61.1%) | $178,358 |
| 2 Earners | 56 (30.3%) | $115,375 |
| 3+ Earners | 0 (0.0%) | $0 |
| Total | 185 (100.0%) | $177,689 |
Household Income in Red Butte
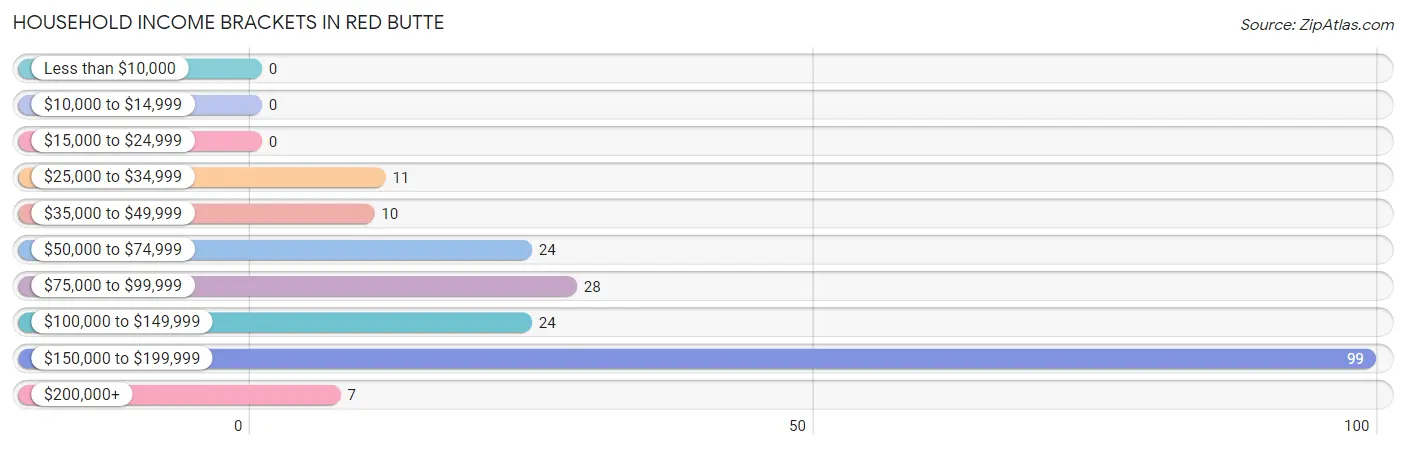
Household Income Brackets in Red Butte
With 99 households falling in the category, the $150,000 to $199,999 income range is the most frequent in Red Butte, accounting for 48.8% of all households.
| Income Bracket | # Households | % Households |
| Less than $10,000 | 0 | 0.0% |
| $10,000 to $14,999 | 0 | 0.0% |
| $15,000 to $24,999 | 0 | 0.0% |
| $25,000 to $34,999 | 11 | 5.4% |
| $35,000 to $49,999 | 10 | 4.9% |
| $50,000 to $74,999 | 24 | 11.8% |
| $75,000 to $99,999 | 28 | 13.8% |
| $100,000 to $149,999 | 24 | 11.8% |
| $150,000 to $199,999 | 99 | 48.8% |
| $200,000+ | 7 | 3.4% |
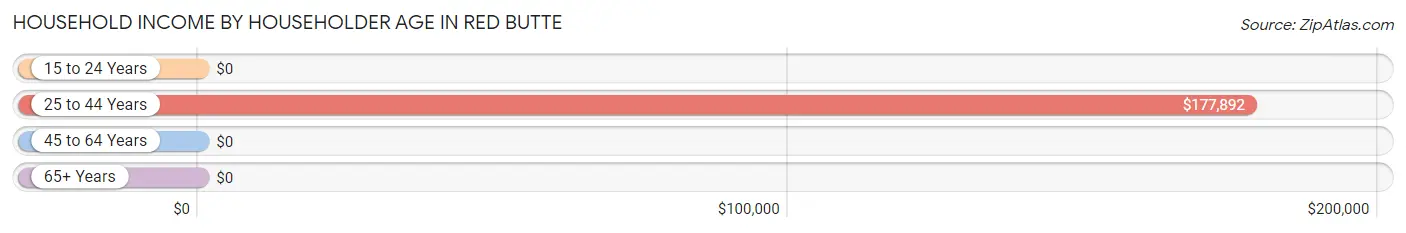
Household Income by Householder Age in Red Butte
The median household income in Red Butte is $177,631, with the highest median household income of $177,892 found in the 25 to 44 years age bracket for the primary householder. A total of 159 households (78.3%) fall into this category.
| Income Bracket | # Households | Median Income |
| 15 to 24 Years | 0 (0.0%) | $0 |
| 25 to 44 Years | 159 (78.3%) | $177,892 |
| 45 to 64 Years | 11 (5.4%) | $0 |
| 65+ Years | 33 (16.3%) | $0 |
| Total | 203 (100.0%) | $177,631 |
Poverty in Red Butte
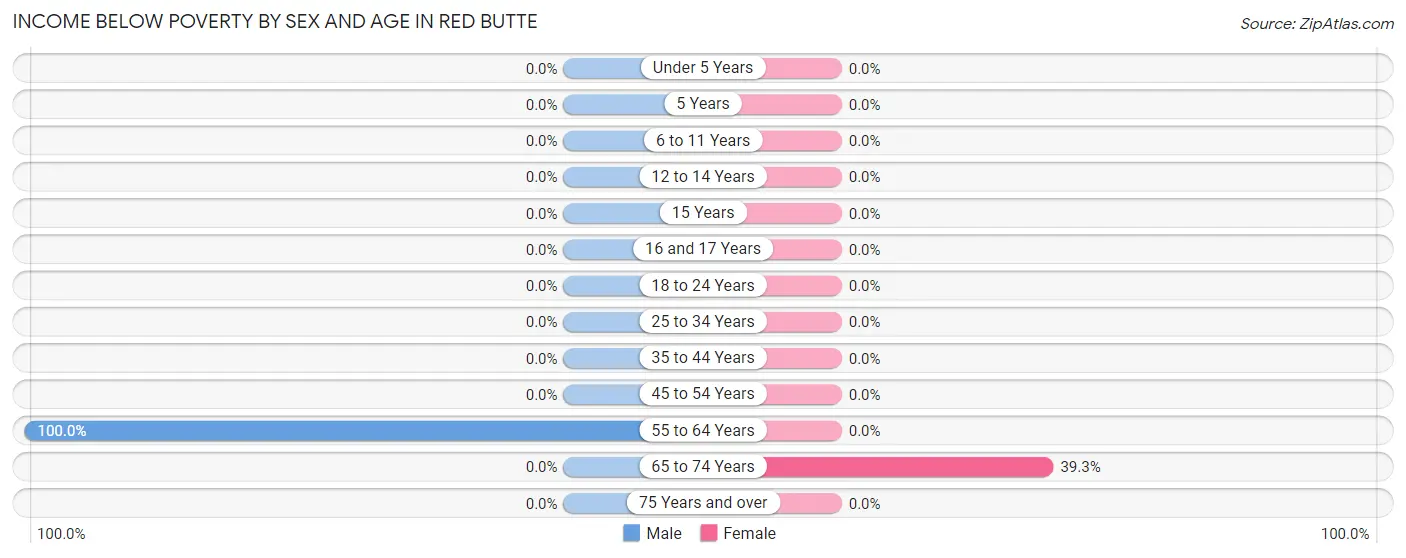
Income Below Poverty by Sex and Age in Red Butte
With 3.4% poverty level for males and 2.9% for females among the residents of Red Butte, 55 to 64 year old males and 65 to 74 year old females are the most vulnerable to poverty, with 13 males (100.0%) and 11 females (39.3%) in their respective age groups living below the poverty level.
| Age Bracket | Male | Female |
| Under 5 Years | 0 (0.0%) | 0 (0.0%) |
| 5 Years | 0 (0.0%) | 0 (0.0%) |
| 6 to 11 Years | 0 (0.0%) | 0 (0.0%) |
| 12 to 14 Years | 0 (0.0%) | 0 (0.0%) |
| 15 Years | 0 (0.0%) | 0 (0.0%) |
| 16 and 17 Years | 0 (0.0%) | 0 (0.0%) |
| 18 to 24 Years | 0 (0.0%) | 0 (0.0%) |
| 25 to 34 Years | 0 (0.0%) | 0 (0.0%) |
| 35 to 44 Years | 0 (0.0%) | 0 (0.0%) |
| 45 to 54 Years | 0 (0.0%) | 0 (0.0%) |
| 55 to 64 Years | 13 (100.0%) | 0 (0.0%) |
| 65 to 74 Years | 0 (0.0%) | 11 (39.3%) |
| 75 Years and over | 0 (0.0%) | 0 (0.0%) |
| Total | 13 (3.4%) | 11 (2.9%) |
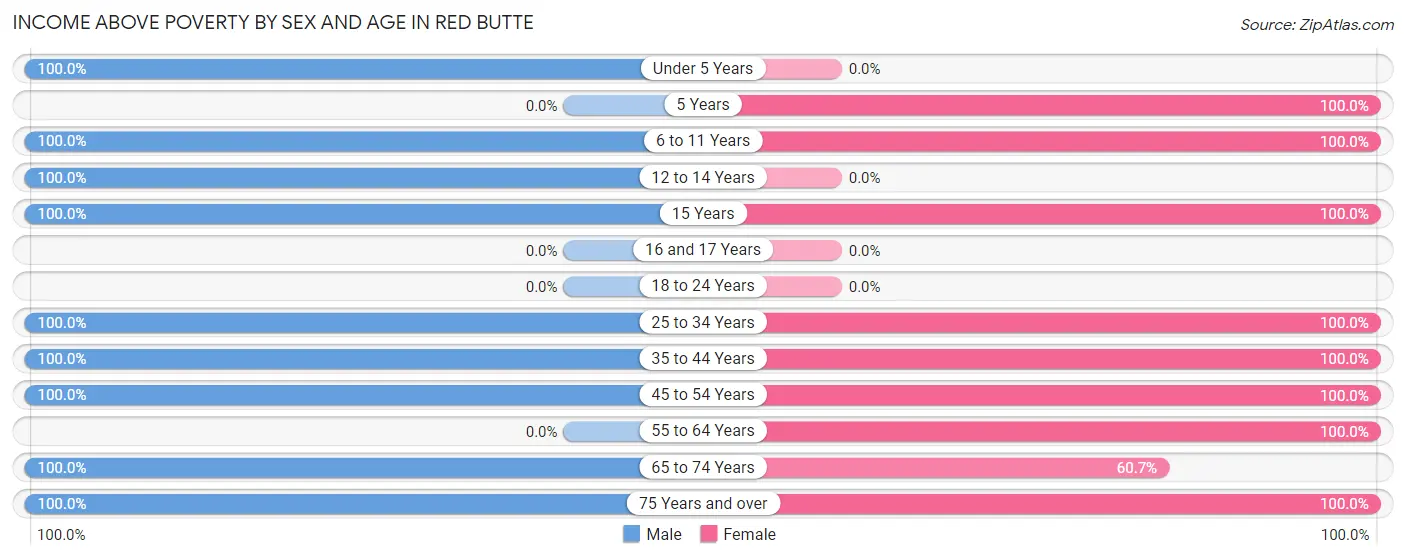
Income Above Poverty by Sex and Age in Red Butte
According to the poverty statistics in Red Butte, males aged under 5 years and females aged 5 years are the age groups that are most secure financially, with 100.0% of males and 100.0% of females in these age groups living above the poverty line.
| Age Bracket | Male | Female |
| Under 5 Years | 31 (100.0%) | 0 (0.0%) |
| 5 Years | 0 (0.0%) | 18 (100.0%) |
| 6 to 11 Years | 42 (100.0%) | 182 (100.0%) |
| 12 to 14 Years | 84 (100.0%) | 0 (0.0%) |
| 15 Years | 27 (100.0%) | 4 (100.0%) |
| 16 and 17 Years | 0 (0.0%) | 0 (0.0%) |
| 18 to 24 Years | 0 (0.0%) | 0 (0.0%) |
| 25 to 34 Years | 15 (100.0%) | 20 (100.0%) |
| 35 to 44 Years | 139 (100.0%) | 50 (100.0%) |
| 45 to 54 Years | 11 (100.0%) | 60 (100.0%) |
| 55 to 64 Years | 0 (0.0%) | 10 (100.0%) |
| 65 to 74 Years | 13 (100.0%) | 17 (60.7%) |
| 75 Years and over | 5 (100.0%) | 6 (100.0%) |
| Total | 367 (96.6%) | 367 (97.1%) |
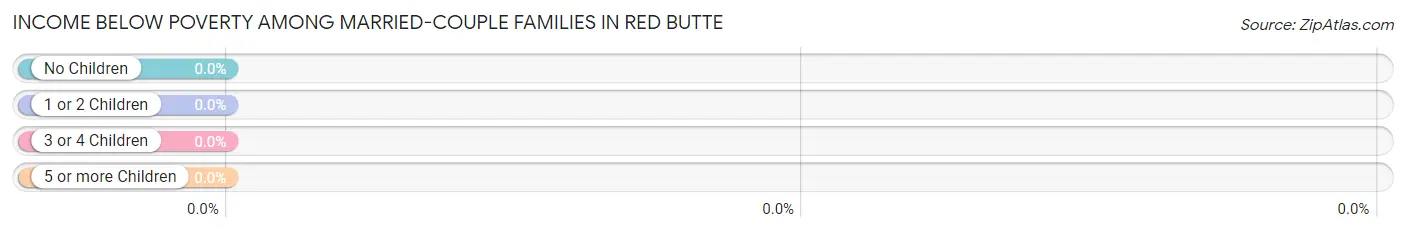
Income Below Poverty Among Married-Couple Families in Red Butte
| Children | Above Poverty | Below Poverty |
| No Children | 29 (100.0%) | 0 (0.0%) |
| 1 or 2 Children | 4 (100.0%) | 0 (0.0%) |
| 3 or 4 Children | 130 (100.0%) | 0 (0.0%) |
| 5 or more Children | 0 (0.0%) | 0 (0.0%) |
| Total | 163 (100.0%) | 0 (0.0%) |
Income Below Poverty Among Single-Parent Households in Red Butte
| Children | Single Father | Single Mother |
| No Children | 0 (0.0%) | 0 (0.0%) |
| 1 or 2 Children | 0 (0.0%) | 0 (0.0%) |
| 3 or 4 Children | 0 (0.0%) | 0 (0.0%) |
| 5 or more Children | 0 (0.0%) | 0 (0.0%) |
| Total | 0 (0.0%) | 0 (0.0%) |
Income Below Poverty Among Married-Couple vs Single-Parent Households in Red Butte
| Children | Married-Couple Families | Single-Parent Households |
| No Children | 0 (0.0%) | 0 (0.0%) |
| 1 or 2 Children | 0 (0.0%) | 0 (0.0%) |
| 3 or 4 Children | 0 (0.0%) | 0 (0.0%) |
| 5 or more Children | 0 (0.0%) | 0 (0.0%) |
| Total | 0 (0.0%) | 0 (0.0%) |
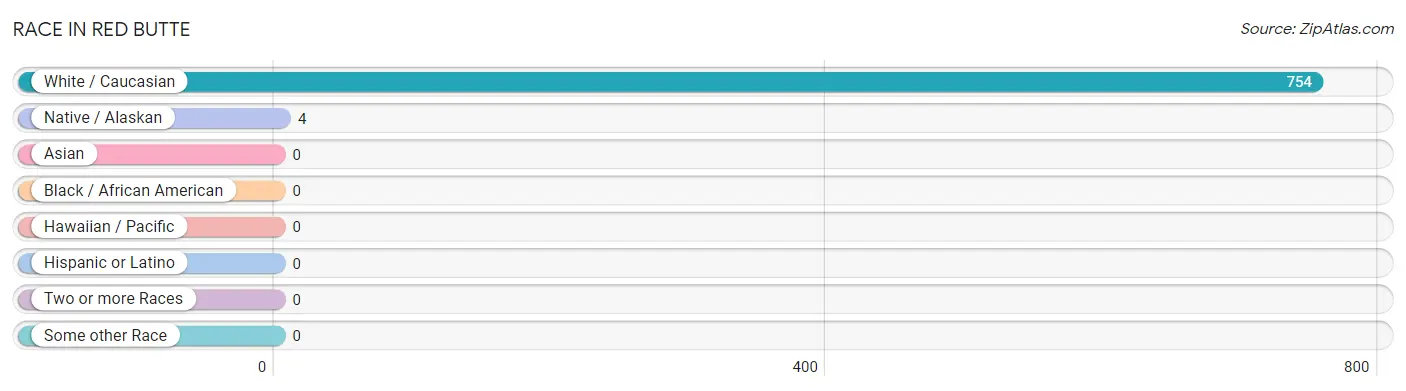
Race in Red Butte
The most populous races in Red Butte are White / Caucasian (754 | 99.5%), and Native / Alaskan (4 | 0.5%).
| Race | # Population | % Population |
| Asian | 0 | 0.0% |
| Black / African American | 0 | 0.0% |
| Hawaiian / Pacific | 0 | 0.0% |
| Hispanic or Latino | 0 | 0.0% |
| Native / Alaskan | 4 | 0.5% |
| White / Caucasian | 754 | 99.5% |
| Two or more Races | 0 | 0.0% |
| Some other Race | 0 | 0.0% |
| Total | 758 | 100.0% |
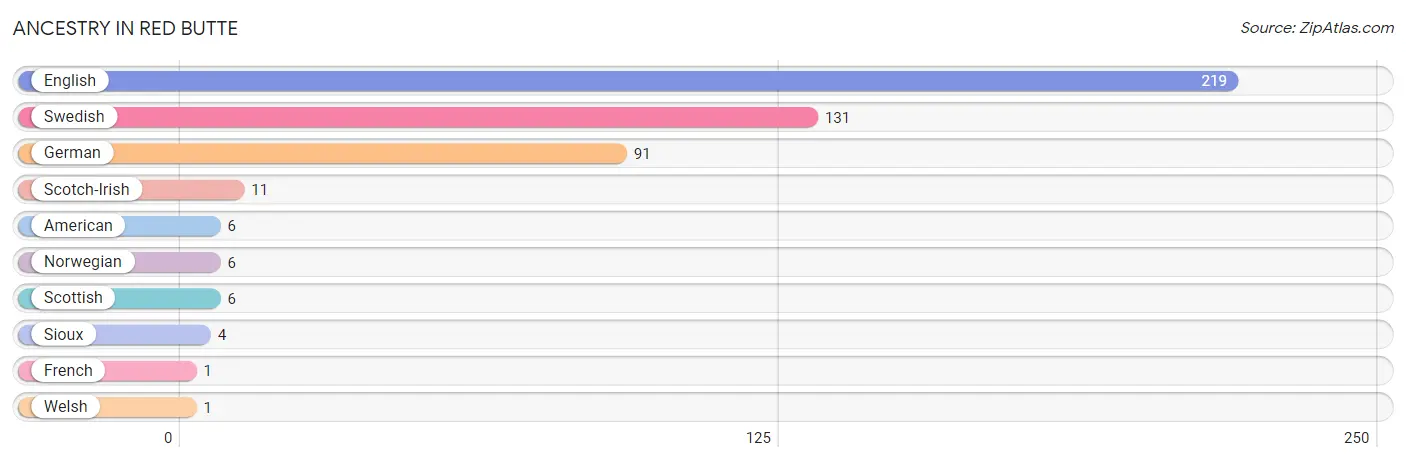
Ancestry in Red Butte
The most populous ancestries reported in Red Butte are English (219 | 28.9%), Swedish (131 | 17.3%), German (91 | 12.0%), Scotch-Irish (11 | 1.5%), and American (6 | 0.8%), together accounting for 60.4% of all Red Butte residents.
| Ancestry | # Population | % Population |
| American | 6 | 0.8% |
| English | 219 | 28.9% |
| French | 1 | 0.1% |
| German | 91 | 12.0% |
| Norwegian | 6 | 0.8% |
| Scotch-Irish | 11 | 1.5% |
| Scottish | 6 | 0.8% |
| Sioux | 4 | 0.5% |
| Swedish | 131 | 17.3% |
| Welsh | 1 | 0.1% | View All 10 Rows |
Immigrants in Red Butte

| Immigration Origin | # Population | % Population | View All 0 Rows |
Sex and Age in Red Butte
Sex and Age in Red Butte
The most populous age groups in Red Butte are 40 to 44 Years (139 | 36.6%) for men and 5 to 9 Years (138 | 36.5%) for women.
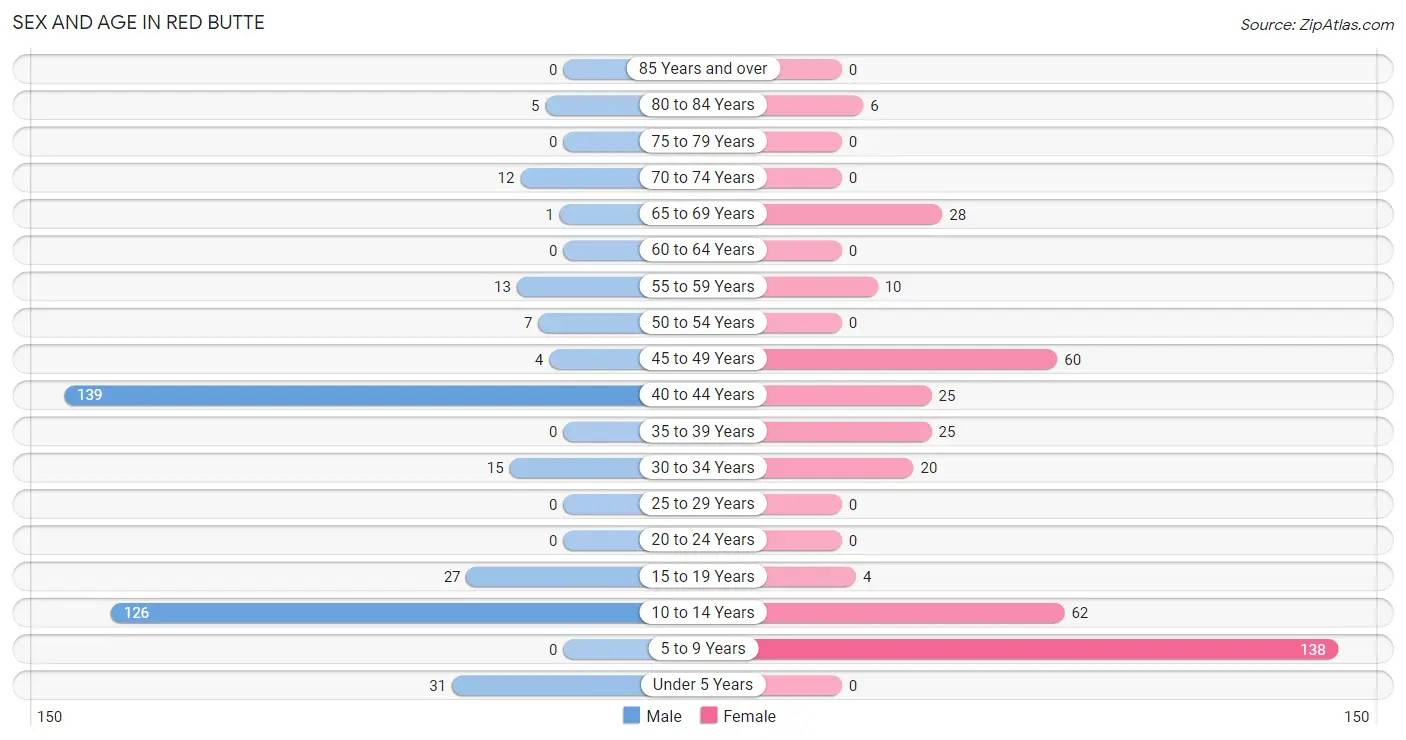
| Age Bracket | Male | Female |
| Under 5 Years | 31 (8.2%) | 0 (0.0%) |
| 5 to 9 Years | 0 (0.0%) | 138 (36.5%) |
| 10 to 14 Years | 126 (33.2%) | 62 (16.4%) |
| 15 to 19 Years | 27 (7.1%) | 4 (1.1%) |
| 20 to 24 Years | 0 (0.0%) | 0 (0.0%) |
| 25 to 29 Years | 0 (0.0%) | 0 (0.0%) |
| 30 to 34 Years | 15 (4.0%) | 20 (5.3%) |
| 35 to 39 Years | 0 (0.0%) | 25 (6.6%) |
| 40 to 44 Years | 139 (36.6%) | 25 (6.6%) |
| 45 to 49 Years | 4 (1.1%) | 60 (15.9%) |
| 50 to 54 Years | 7 (1.8%) | 0 (0.0%) |
| 55 to 59 Years | 13 (3.4%) | 10 (2.6%) |
| 60 to 64 Years | 0 (0.0%) | 0 (0.0%) |
| 65 to 69 Years | 1 (0.3%) | 28 (7.4%) |
| 70 to 74 Years | 12 (3.2%) | 0 (0.0%) |
| 75 to 79 Years | 0 (0.0%) | 0 (0.0%) |
| 80 to 84 Years | 5 (1.3%) | 6 (1.6%) |
| 85 Years and over | 0 (0.0%) | 0 (0.0%) |
| Total | 380 (100.0%) | 378 (100.0%) |
Families and Households in Red Butte
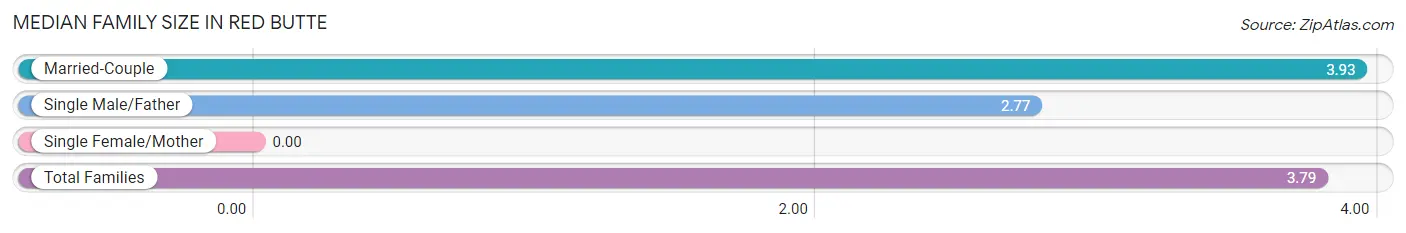
Median Family Size in Red Butte
| Family Type | # Families | Family Size |
| Married-Couple | 163 (88.1%) | 3.93 |
| Single Male/Father | 22 (11.9%) | 2.77 |
| Single Female/Mother | 0 (0.0%) | - |
| Total Families | 185 (100.0%) | 3.79 |
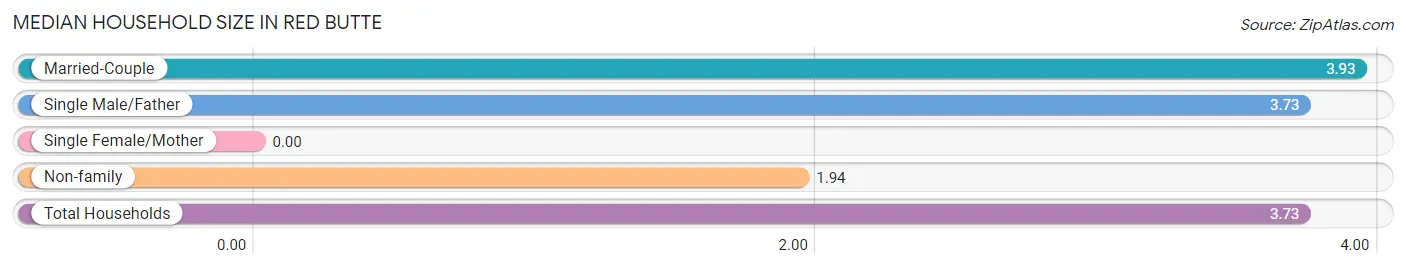
Median Household Size in Red Butte
| Household Type | # Households | Household Size |
| Married-Couple | 163 (80.3%) | 3.93 |
| Single Male/Father | 22 (10.8%) | 3.73 |
| Single Female/Mother | 0 (0.0%) | - |
| Non-family | 18 (8.9%) | 1.94 |
| Total Households | 203 (100.0%) | 3.73 |
Household Size by Marriage Status in Red Butte
Out of a total of 203 households in Red Butte, 185 (91.1%) are family households, while 18 (8.9%) are nonfamily households. The most numerous type of family households are 5-person households, comprising 106, and the most common type of nonfamily households are 2-person households, comprising 18.
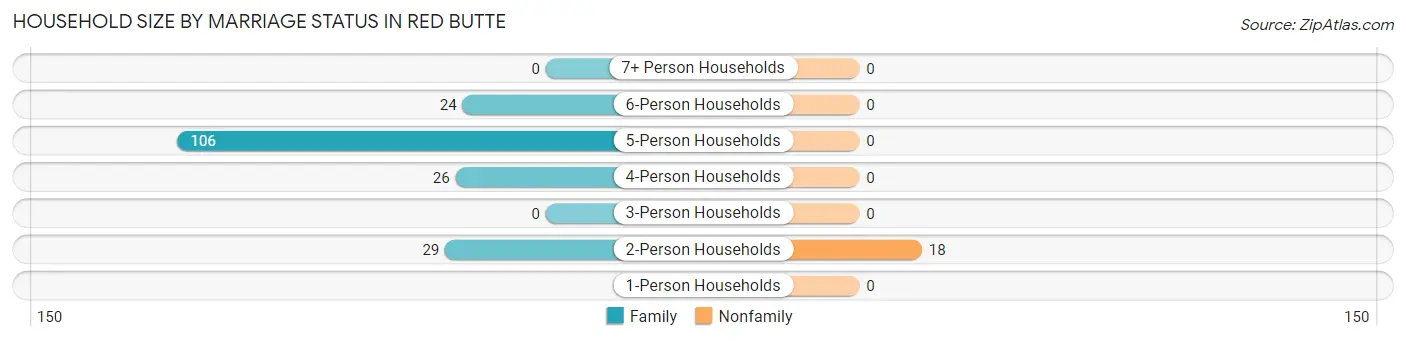
| Household Size | Family Households | Nonfamily Households |
| 1-Person Households | - | 0 (0.0%) |
| 2-Person Households | 29 (14.3%) | 18 (8.9%) |
| 3-Person Households | 0 (0.0%) | 0 (0.0%) |
| 4-Person Households | 26 (12.8%) | 0 (0.0%) |
| 5-Person Households | 106 (52.2%) | 0 (0.0%) |
| 6-Person Households | 24 (11.8%) | 0 (0.0%) |
| 7+ Person Households | 0 (0.0%) | 0 (0.0%) |
| Total | 185 (91.1%) | 18 (8.9%) |
Female Fertility in Red Butte
Fertility by Age in Red Butte
Average fertility rate in Red Butte is 149.0 births per 1,000 women. Women in the age bracket of 35 to 50 years have the highest fertility rate with 182.0 births per 1,000 women. Women in the age bracket of 35 to 50 years acount for 100.0% of all women with births.
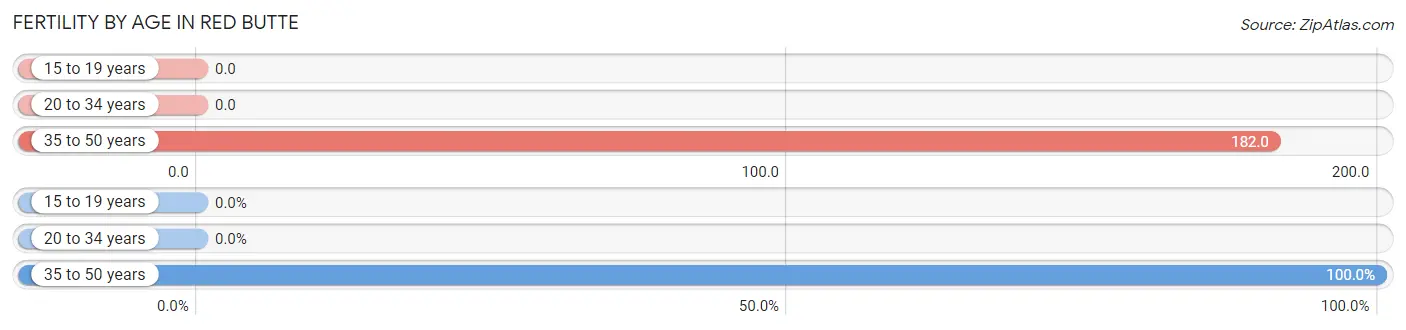
| Age Bracket | Women with Births | Births / 1,000 Women |
| 15 to 19 years | 0 (0.0%) | 0.0 |
| 20 to 34 years | 0 (0.0%) | 0.0 |
| 35 to 50 years | 20 (100.0%) | 182.0 |
| Total | 20 (100.0%) | 149.0 |
Fertility by Age by Marriage Status in Red Butte
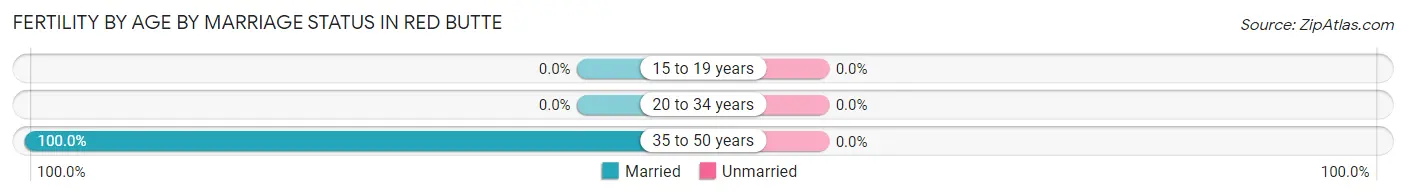
| Age Bracket | Married | Unmarried |
| 15 to 19 years | 0 (0.0%) | 0 (0.0%) |
| 20 to 34 years | 0 (0.0%) | 0 (0.0%) |
| 35 to 50 years | 20 (100.0%) | 0 (0.0%) |
| Total | 20 (100.0%) | 0 (0.0%) |
Fertility by Education in Red Butte
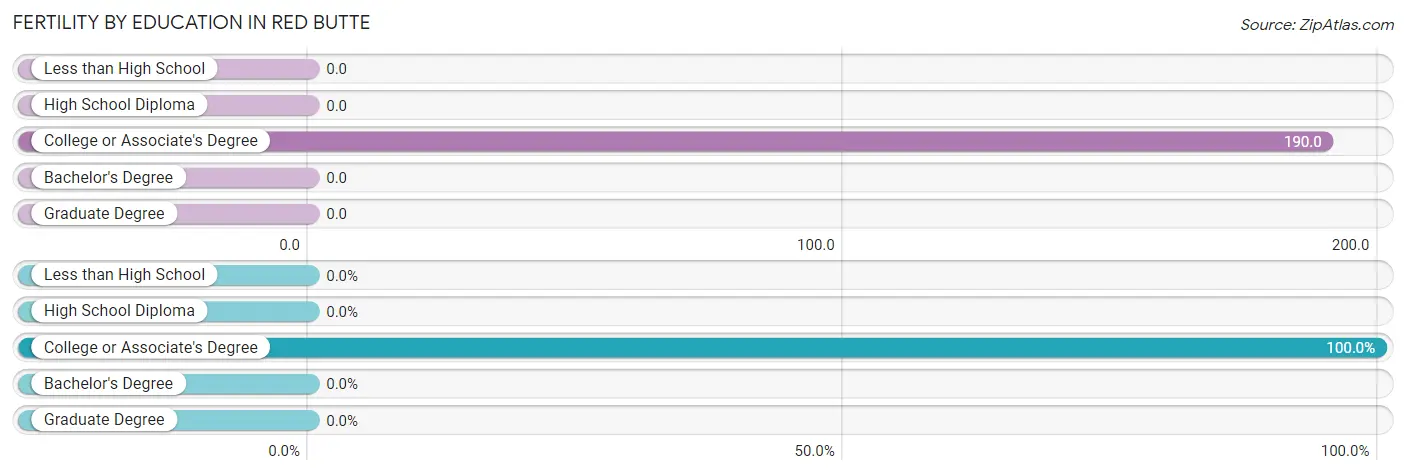
| Educational Attainment | Women with Births | Births / 1,000 Women |
| Less than High School | 0 (0.0%) | 0.0 |
| High School Diploma | 0 (0.0%) | 0.0 |
| College or Associate's Degree | 20 (100.0%) | 190.0 |
| Bachelor's Degree | 0 (0.0%) | 0.0 |
| Graduate Degree | 0 (0.0%) | 0.0 |
| Total | 20 (100.0%) | 149.0 |
Fertility by Education by Marriage Status in Red Butte
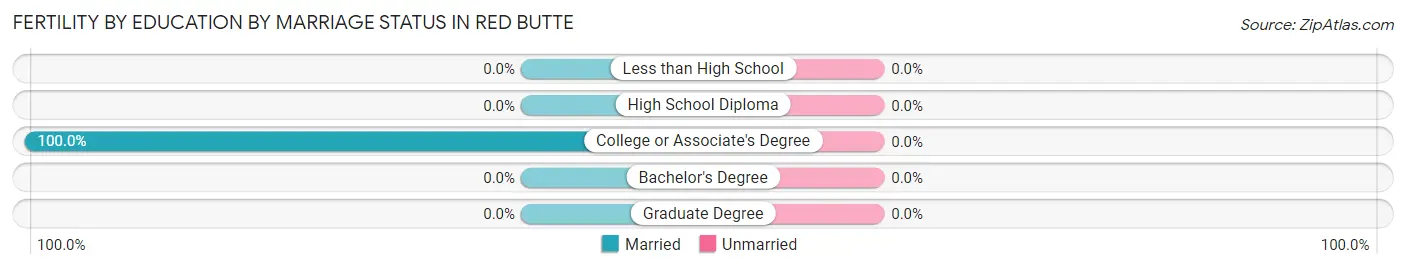
| Educational Attainment | Married | Unmarried |
| Less than High School | 0 (0.0%) | 0 (0.0%) |
| High School Diploma | 0 (0.0%) | 0 (0.0%) |
| College or Associate's Degree | 20 (100.0%) | 0 (0.0%) |
| Bachelor's Degree | 0 (0.0%) | 0 (0.0%) |
| Graduate Degree | 0 (0.0%) | 0 (0.0%) |
| Total | 20 (100.0%) | 0 (0.0%) |
Employment Characteristics in Red Butte
Employment by Class of Employer in Red Butte
Among the 260 employed individuals in Red Butte, local government employees (139 | 53.5%), private company employees (67 | 25.8%), and self-employed (incorporated) (45 | 17.3%) make up the most common classes of employment.
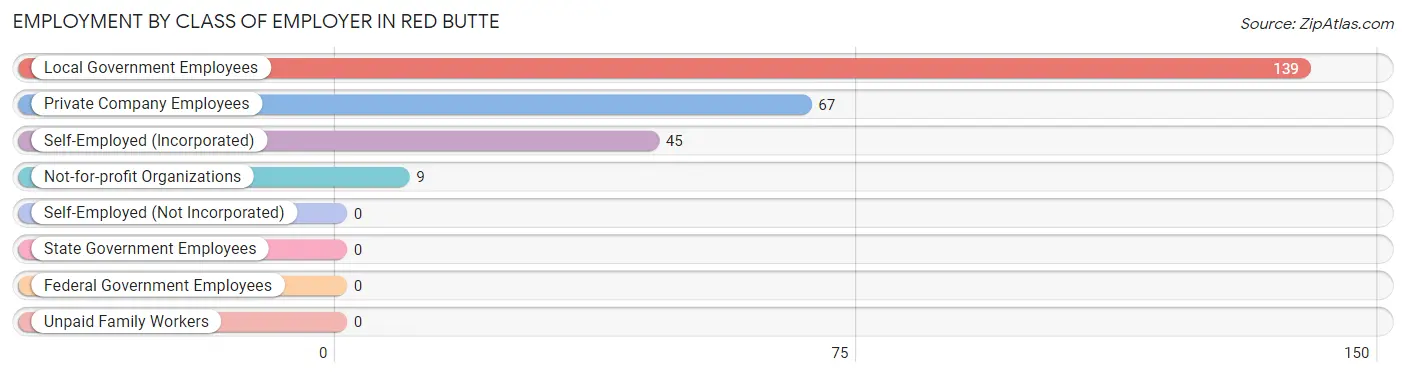
| Employer Class | # Employees | % Employees |
| Private Company Employees | 67 | 25.8% |
| Self-Employed (Incorporated) | 45 | 17.3% |
| Self-Employed (Not Incorporated) | 0 | 0.0% |
| Not-for-profit Organizations | 9 | 3.5% |
| Local Government Employees | 139 | 53.5% |
| State Government Employees | 0 | 0.0% |
| Federal Government Employees | 0 | 0.0% |
| Unpaid Family Workers | 0 | 0.0% |
| Total | 260 | 100.0% |
Employment Status by Age in Red Butte
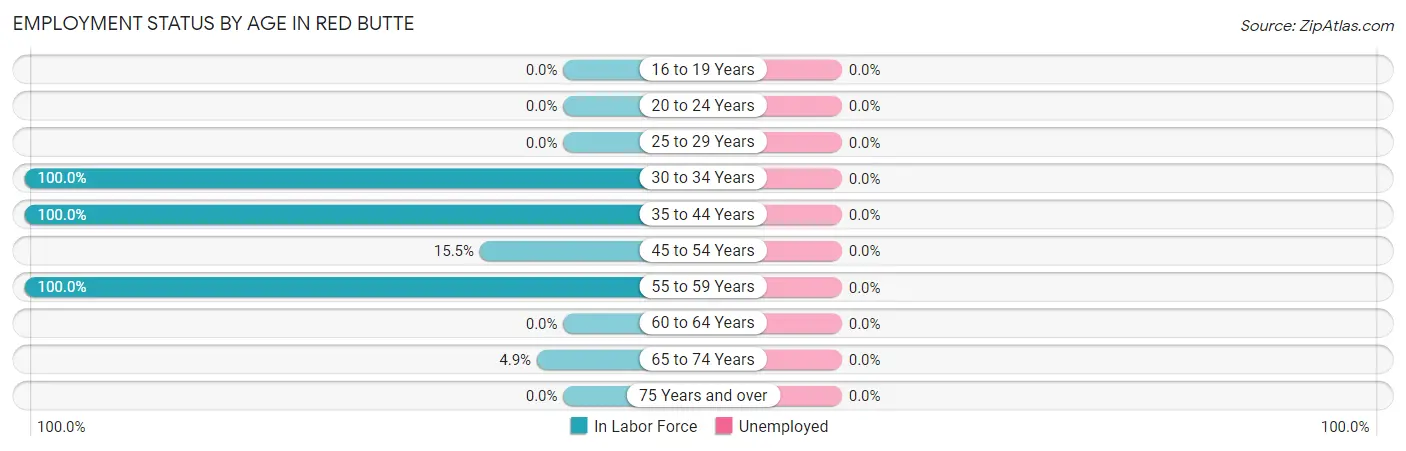
| Age Bracket | In Labor Force | Unemployed |
| 16 to 19 Years | 0 (0.0%) | 0 (0.0%) |
| 20 to 24 Years | 0 (0.0%) | 0 (0.0%) |
| 25 to 29 Years | 0 (0.0%) | 0 (0.0%) |
| 30 to 34 Years | 35 (100.0%) | 0 (0.0%) |
| 35 to 44 Years | 189 (100.0%) | 0 (0.0%) |
| 45 to 54 Years | 11 (15.5%) | 0 (0.0%) |
| 55 to 59 Years | 23 (100.0%) | 0 (0.0%) |
| 60 to 64 Years | 0 (0.0%) | 0 (0.0%) |
| 65 to 74 Years | 2 (4.9%) | 0 (0.0%) |
| 75 Years and over | 0 (0.0%) | 0 (0.0%) |
| Total | 260 (70.3%) | 0 (0.0%) |
Employment Status by Educational Attainment in Red Butte
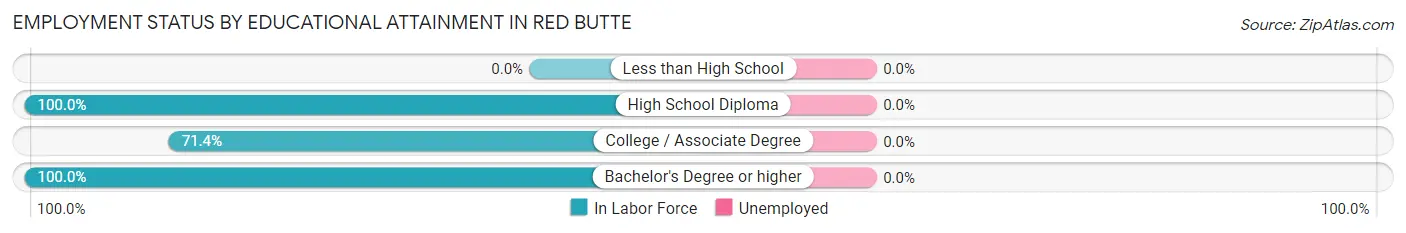
| Educational Attainment | In Labor Force | Unemployed |
| Less than High School | 0 (0.0%) | 0 (0.0%) |
| High School Diploma | 35 (100.0%) | 0 (0.0%) |
| College / Associate Degree | 150 (71.4%) | 0 (0.0%) |
| Bachelor's Degree or higher | 73 (100.0%) | 0 (0.0%) |
| Total | 258 (81.1%) | 0 (0.0%) |
Employment Occupations by Sex in Red Butte
Management, Business, Science and Arts Occupations
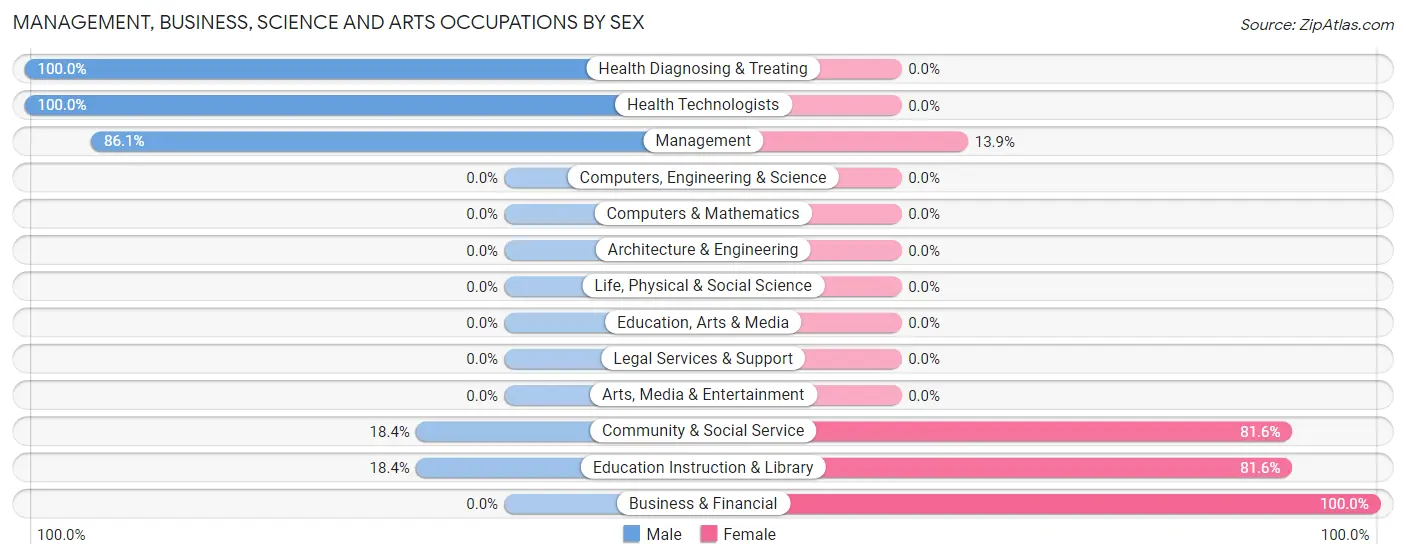
The most common Management, Business, Science and Arts occupations in Red Butte are Community & Social Service (38 | 14.6%), Education Instruction & Library (38 | 14.6%), Management (36 | 13.9%), Business & Financial (4 | 1.5%), and Health Diagnosing & Treating (1 | 0.4%).
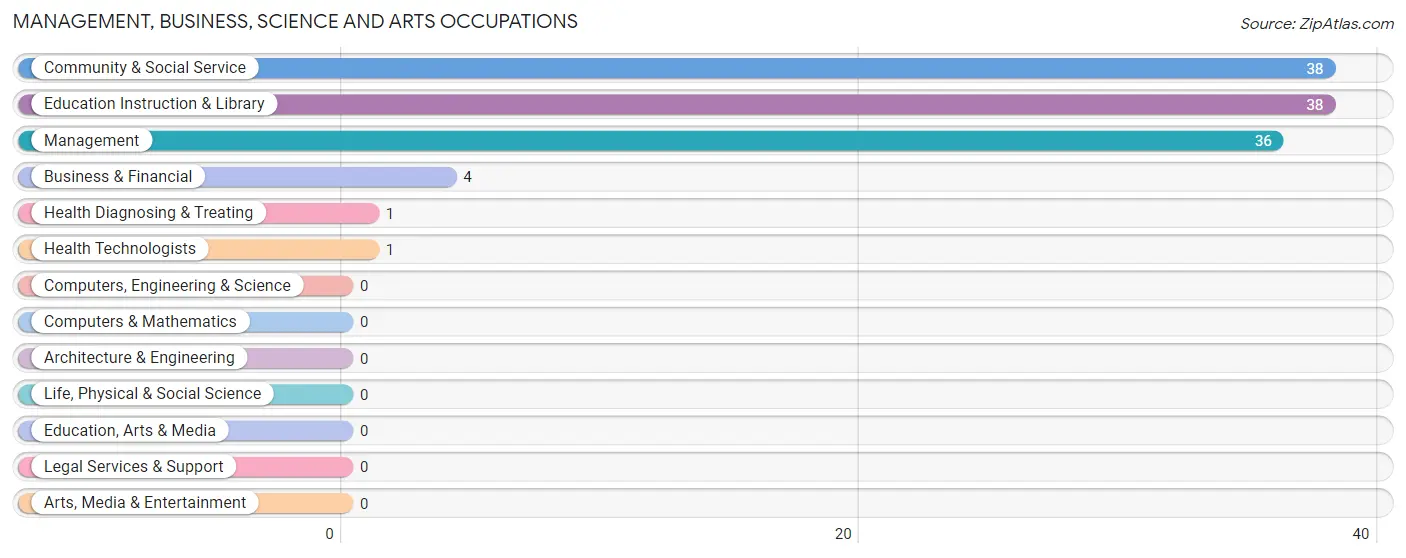
Management, Business, Science and Arts Occupations by Sex
Within the Management, Business, Science and Arts occupations in Red Butte, the most male-oriented occupations are Health Diagnosing & Treating (100.0%), Health Technologists (100.0%), and Management (86.1%), while the most female-oriented occupations are Business & Financial (100.0%), Community & Social Service (81.6%), and Education Instruction & Library (81.6%).
| Occupation | Male | Female |
| Management | 31 (86.1%) | 5 (13.9%) |
| Business & Financial | 0 (0.0%) | 4 (100.0%) |
| Computers, Engineering & Science | 0 (0.0%) | 0 (0.0%) |
| Computers & Mathematics | 0 (0.0%) | 0 (0.0%) |
| Architecture & Engineering | 0 (0.0%) | 0 (0.0%) |
| Life, Physical & Social Science | 0 (0.0%) | 0 (0.0%) |
| Community & Social Service | 7 (18.4%) | 31 (81.6%) |
| Education, Arts & Media | 0 (0.0%) | 0 (0.0%) |
| Legal Services & Support | 0 (0.0%) | 0 (0.0%) |
| Education Instruction & Library | 7 (18.4%) | 31 (81.6%) |
| Arts, Media & Entertainment | 0 (0.0%) | 0 (0.0%) |
| Health Diagnosing & Treating | 1 (100.0%) | 0 (0.0%) |
| Health Technologists | 1 (100.0%) | 0 (0.0%) |
| Total (Category) | 39 (49.4%) | 40 (50.6%) |
| Total (Overall) | 179 (68.9%) | 81 (31.1%) |
Services Occupations
The most common Services occupations in Red Butte are Security & Protection (86 | 33.1%), and Law Enforcement (86 | 33.1%).
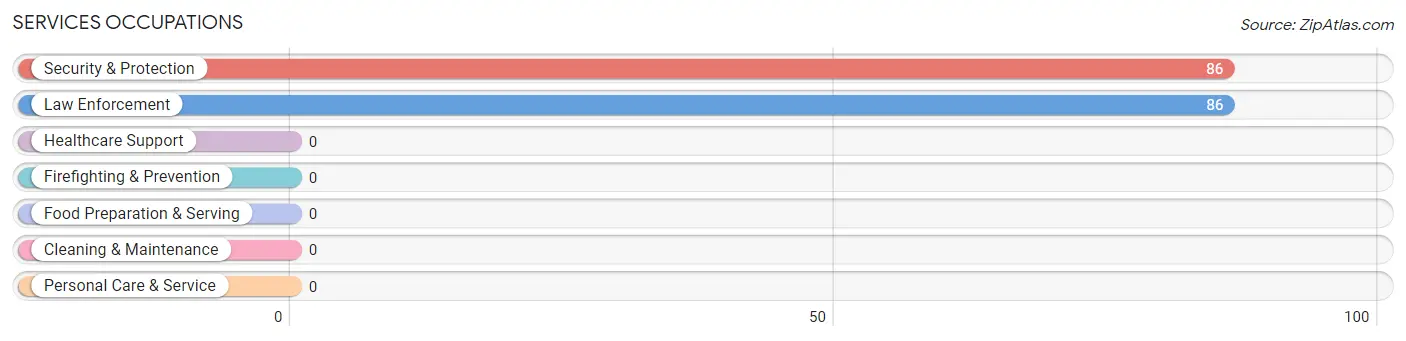
Services Occupations by Sex
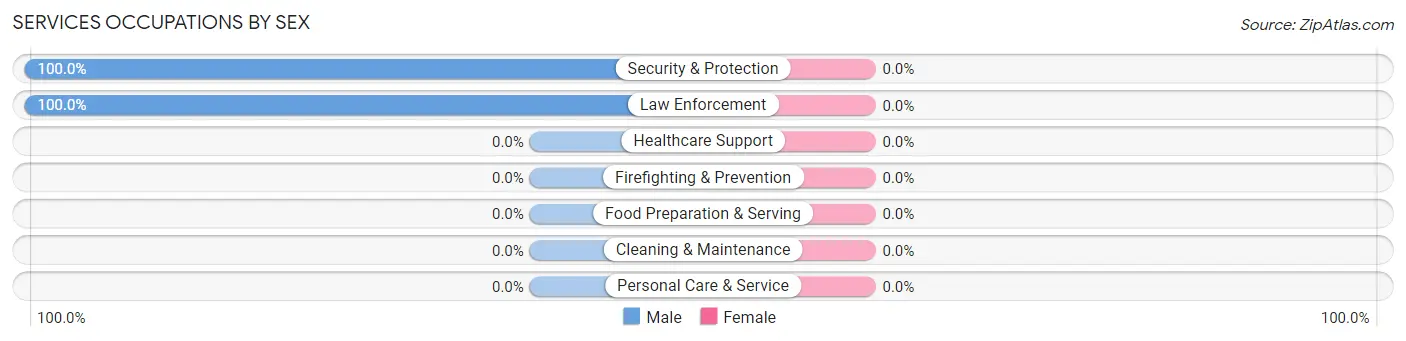
| Occupation | Male | Female |
| Healthcare Support | 0 (0.0%) | 0 (0.0%) |
| Security & Protection | 86 (100.0%) | 0 (0.0%) |
| Firefighting & Prevention | 0 (0.0%) | 0 (0.0%) |
| Law Enforcement | 86 (100.0%) | 0 (0.0%) |
| Food Preparation & Serving | 0 (0.0%) | 0 (0.0%) |
| Cleaning & Maintenance | 0 (0.0%) | 0 (0.0%) |
| Personal Care & Service | 0 (0.0%) | 0 (0.0%) |
| Total (Category) | 86 (100.0%) | 0 (0.0%) |
| Total (Overall) | 179 (68.9%) | 81 (31.1%) |
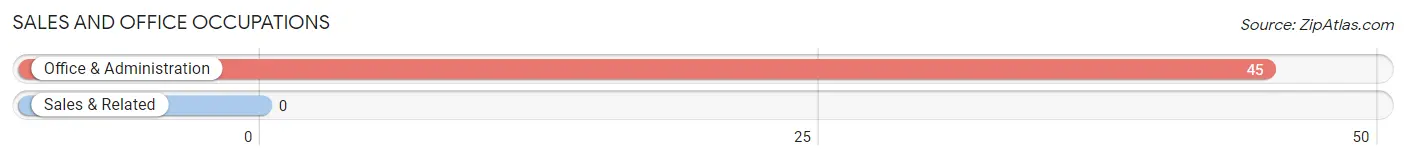
Sales and Office Occupations
The most common Sales and Office occupations in Red Butte are , and Office & Administration (45 | 17.3%).
Sales and Office Occupations by Sex
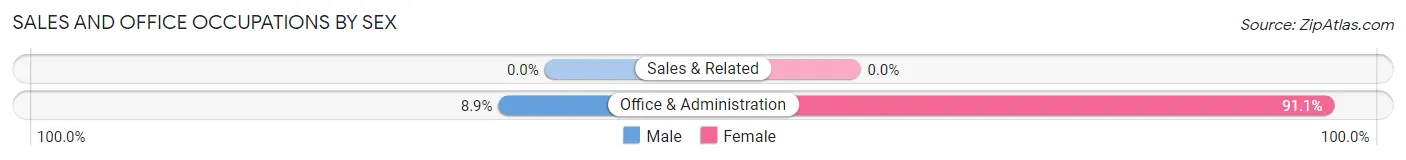
| Occupation | Male | Female |
| Sales & Related | 0 (0.0%) | 0 (0.0%) |
| Office & Administration | 4 (8.9%) | 41 (91.1%) |
| Total (Category) | 4 (8.9%) | 41 (91.1%) |
| Total (Overall) | 179 (68.9%) | 81 (31.1%) |
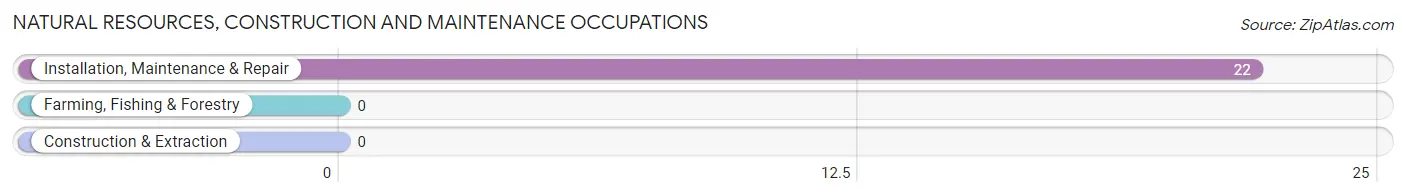
Natural Resources, Construction and Maintenance Occupations
The most common Natural Resources, Construction and Maintenance occupations in Red Butte are , and Installation, Maintenance & Repair (22 | 8.5%).
Natural Resources, Construction and Maintenance Occupations by Sex
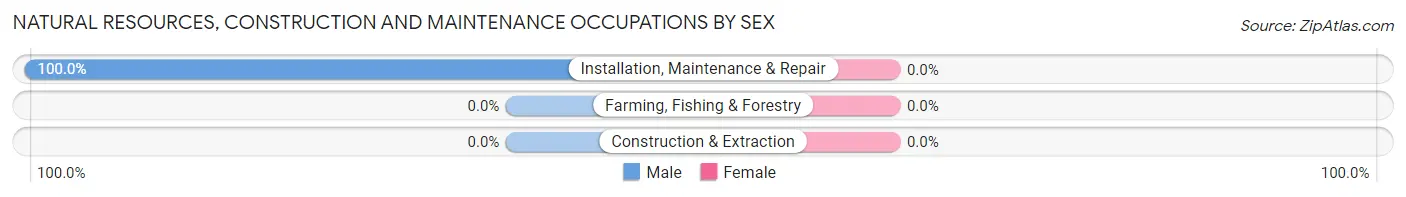
| Occupation | Male | Female |
| Farming, Fishing & Forestry | 0 (0.0%) | 0 (0.0%) |
| Construction & Extraction | 0 (0.0%) | 0 (0.0%) |
| Installation, Maintenance & Repair | 22 (100.0%) | 0 (0.0%) |
| Total (Category) | 22 (100.0%) | 0 (0.0%) |
| Total (Overall) | 179 (68.9%) | 81 (31.1%) |
Production, Transportation and Moving Occupations
The most common Production, Transportation and Moving occupations in Red Butte are Production (15 | 5.8%), and Transportation (13 | 5.0%).
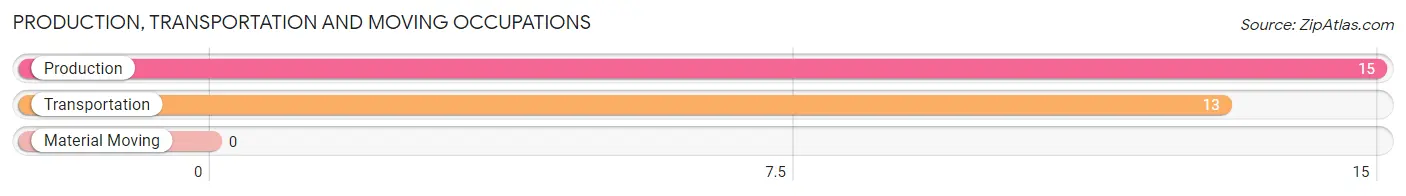
Production, Transportation and Moving Occupations by Sex
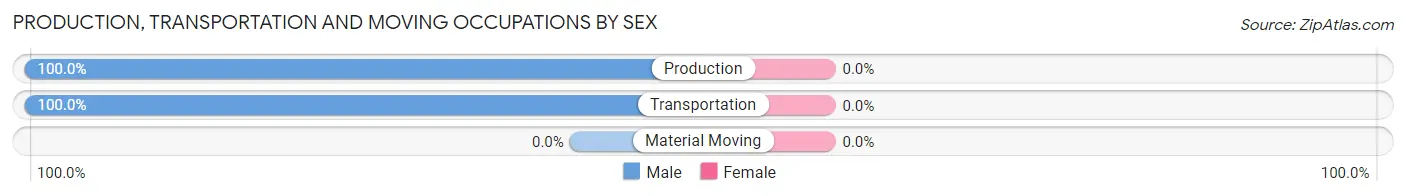
| Occupation | Male | Female |
| Production | 15 (100.0%) | 0 (0.0%) |
| Transportation | 13 (100.0%) | 0 (0.0%) |
| Material Moving | 0 (0.0%) | 0 (0.0%) |
| Total (Category) | 28 (100.0%) | 0 (0.0%) |
| Total (Overall) | 179 (68.9%) | 81 (31.1%) |
Employment Industries by Sex in Red Butte
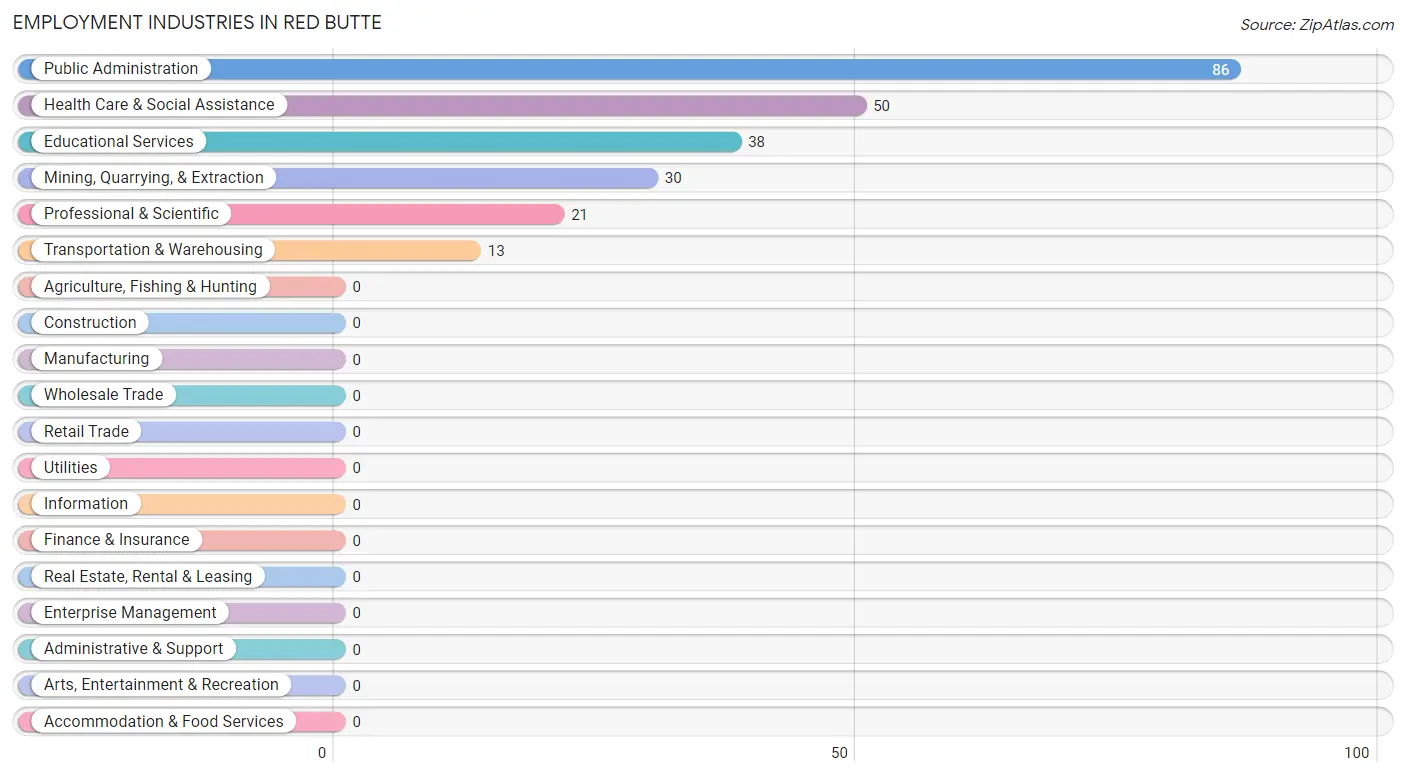
Employment Industries in Red Butte
The major employment industries in Red Butte include Public Administration (86 | 33.1%), Health Care & Social Assistance (50 | 19.2%), Educational Services (38 | 14.6%), Mining, Quarrying, & Extraction (30 | 11.5%), and Professional & Scientific (21 | 8.1%).
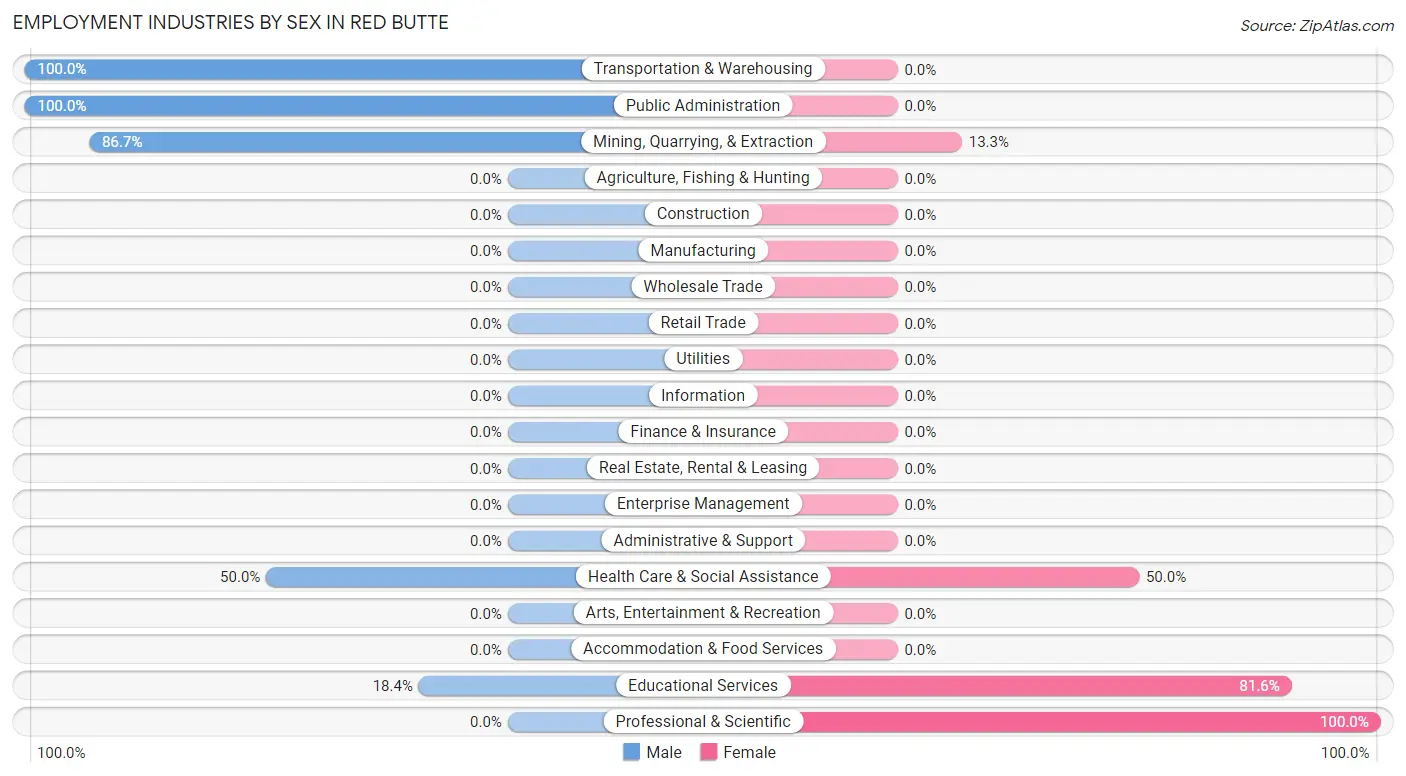
Employment Industries by Sex in Red Butte
The Red Butte industries that see more men than women are Transportation & Warehousing (100.0%), Public Administration (100.0%), and Mining, Quarrying, & Extraction (86.7%), whereas the industries that tend to have a higher number of women are Professional & Scientific (100.0%), Educational Services (81.6%), and Health Care & Social Assistance (50.0%).
| Industry | Male | Female |
| Agriculture, Fishing & Hunting | 0 (0.0%) | 0 (0.0%) |
| Mining, Quarrying, & Extraction | 26 (86.7%) | 4 (13.3%) |
| Construction | 0 (0.0%) | 0 (0.0%) |
| Manufacturing | 0 (0.0%) | 0 (0.0%) |
| Wholesale Trade | 0 (0.0%) | 0 (0.0%) |
| Retail Trade | 0 (0.0%) | 0 (0.0%) |
| Transportation & Warehousing | 13 (100.0%) | 0 (0.0%) |
| Utilities | 0 (0.0%) | 0 (0.0%) |
| Information | 0 (0.0%) | 0 (0.0%) |
| Finance & Insurance | 0 (0.0%) | 0 (0.0%) |
| Real Estate, Rental & Leasing | 0 (0.0%) | 0 (0.0%) |
| Professional & Scientific | 0 (0.0%) | 21 (100.0%) |
| Enterprise Management | 0 (0.0%) | 0 (0.0%) |
| Administrative & Support | 0 (0.0%) | 0 (0.0%) |
| Educational Services | 7 (18.4%) | 31 (81.6%) |
| Health Care & Social Assistance | 25 (50.0%) | 25 (50.0%) |
| Arts, Entertainment & Recreation | 0 (0.0%) | 0 (0.0%) |
| Accommodation & Food Services | 0 (0.0%) | 0 (0.0%) |
| Public Administration | 86 (100.0%) | 0 (0.0%) |
| Total | 179 (68.9%) | 81 (31.1%) |
Education in Red Butte
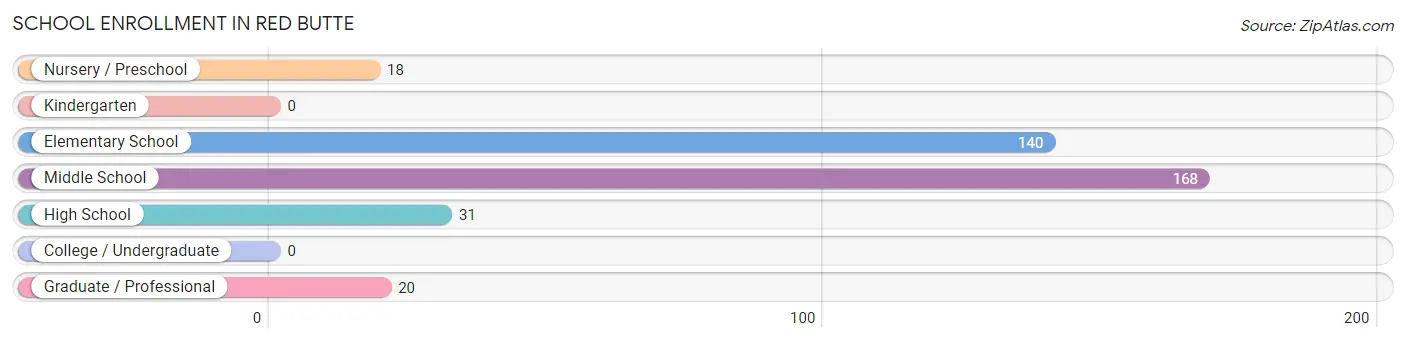
School Enrollment in Red Butte
The most common levels of schooling among the 377 students in Red Butte are middle school (168 | 44.6%), elementary school (140 | 37.1%), and high school (31 | 8.2%).
| School Level | # Students | % Students |
| Nursery / Preschool | 18 | 4.8% |
| Kindergarten | 0 | 0.0% |
| Elementary School | 140 | 37.1% |
| Middle School | 168 | 44.6% |
| High School | 31 | 8.2% |
| College / Undergraduate | 0 | 0.0% |
| Graduate / Professional | 20 | 5.3% |
| Total | 377 | 100.0% |
School Enrollment by Age by Funding Source in Red Butte
Out of a total of 377 students who are enrolled in schools in Red Butte, 154 (40.8%) attend a private institution, while the remaining 223 (59.2%) are enrolled in public schools. The age group of 15 to 17 year olds has the highest likelihood of being enrolled in private schools, with 27 (87.1% in the age bracket) enrolled. Conversely, the age group of 25 to 34 year olds has the lowest likelihood of being enrolled in a private school, with 20 (100.0% in the age bracket) attending a public institution.
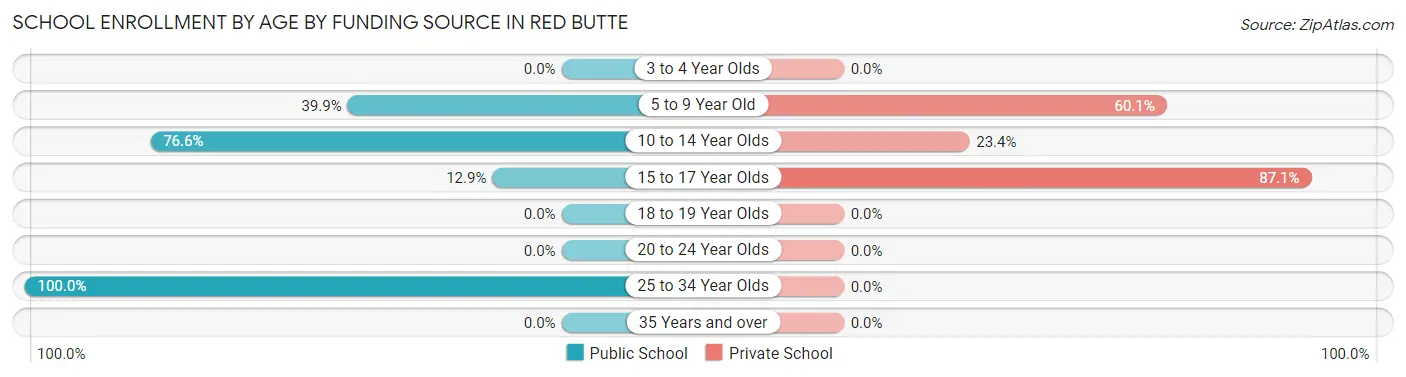
| Age Bracket | Public School | Private School |
| 3 to 4 Year Olds | 0 (0.0%) | 0 (0.0%) |
| 5 to 9 Year Old | 55 (39.9%) | 83 (60.1%) |
| 10 to 14 Year Olds | 144 (76.6%) | 44 (23.4%) |
| 15 to 17 Year Olds | 4 (12.9%) | 27 (87.1%) |
| 18 to 19 Year Olds | 0 (0.0%) | 0 (0.0%) |
| 20 to 24 Year Olds | 0 (0.0%) | 0 (0.0%) |
| 25 to 34 Year Olds | 20 (100.0%) | 0 (0.0%) |
| 35 Years and over | 0 (0.0%) | 0 (0.0%) |
| Total | 223 (59.2%) | 154 (40.8%) |
Educational Attainment by Field of Study in Red Butte
Education (37 | 45.7%), computers & mathematics (24 | 29.6%), science & technology (19 | 23.5%), and bio, nature & agricultural (1 | 1.2%) are the most common fields of study among 81 individuals in Red Butte who have obtained a bachelor's degree or higher.
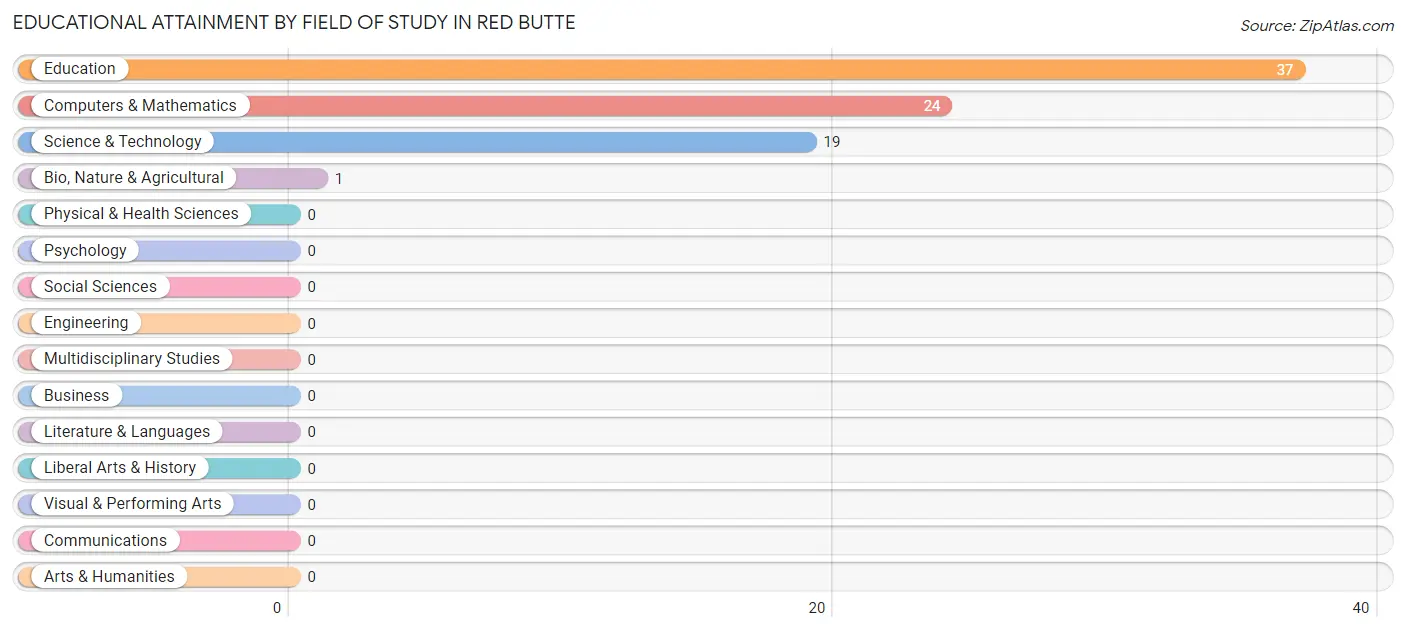
| Field of Study | # Graduates | % Graduates |
| Computers & Mathematics | 24 | 29.6% |
| Bio, Nature & Agricultural | 1 | 1.2% |
| Physical & Health Sciences | 0 | 0.0% |
| Psychology | 0 | 0.0% |
| Social Sciences | 0 | 0.0% |
| Engineering | 0 | 0.0% |
| Multidisciplinary Studies | 0 | 0.0% |
| Science & Technology | 19 | 23.5% |
| Business | 0 | 0.0% |
| Education | 37 | 45.7% |
| Literature & Languages | 0 | 0.0% |
| Liberal Arts & History | 0 | 0.0% |
| Visual & Performing Arts | 0 | 0.0% |
| Communications | 0 | 0.0% |
| Arts & Humanities | 0 | 0.0% |
| Total | 81 | 100.0% |
Transportation & Commute in Red Butte
Vehicle Availability by Sex in Red Butte
The most prevalent vehicle ownership categories in Red Butte are males with 4 vehicles (102, accounting for 57.0%) and females with 4 vehicles (21, making up 125.9%).
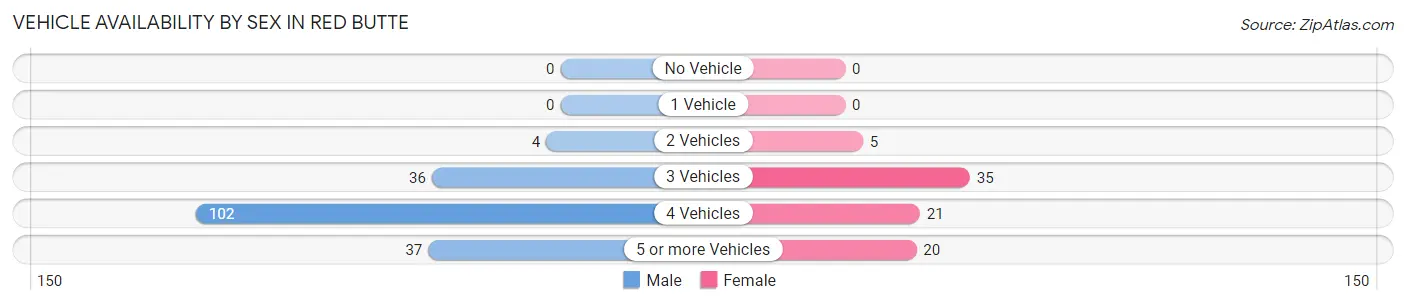
| Vehicles Available | Male | Female |
| No Vehicle | 0 (0.0%) | 0 (0.0%) |
| 1 Vehicle | 0 (0.0%) | 0 (0.0%) |
| 2 Vehicles | 4 (2.2%) | 5 (6.2%) |
| 3 Vehicles | 36 (20.1%) | 35 (43.2%) |
| 4 Vehicles | 102 (57.0%) | 21 (25.9%) |
| 5 or more Vehicles | 37 (20.7%) | 20 (24.7%) |
| Total | 179 (100.0%) | 81 (100.0%) |
Commute Time in Red Butte
The most frequently occuring commute durations in Red Butte are 15 to 19 minutes (87 commuters, 40.3%), 20 to 24 minutes (42 commuters, 19.4%), and 10 to 14 minutes (28 commuters, 13.0%).
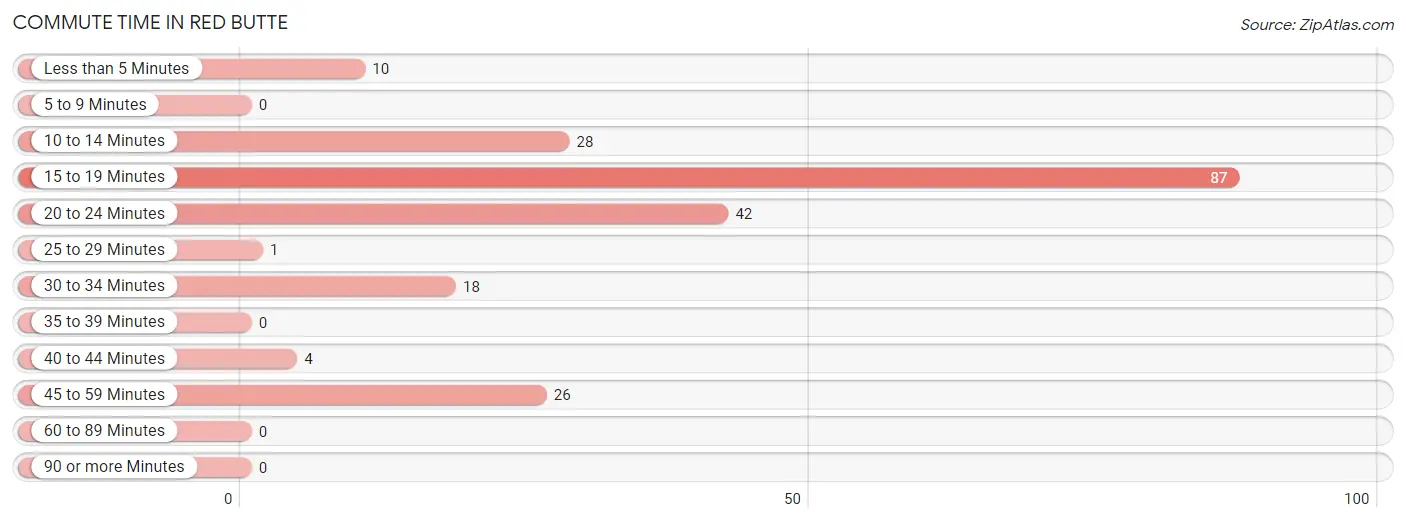
| Commute Time | # Commuters | % Commuters |
| Less than 5 Minutes | 10 | 4.6% |
| 5 to 9 Minutes | 0 | 0.0% |
| 10 to 14 Minutes | 28 | 13.0% |
| 15 to 19 Minutes | 87 | 40.3% |
| 20 to 24 Minutes | 42 | 19.4% |
| 25 to 29 Minutes | 1 | 0.5% |
| 30 to 34 Minutes | 18 | 8.3% |
| 35 to 39 Minutes | 0 | 0.0% |
| 40 to 44 Minutes | 4 | 1.8% |
| 45 to 59 Minutes | 26 | 12.0% |
| 60 to 89 Minutes | 0 | 0.0% |
| 90 or more Minutes | 0 | 0.0% |
Commute Time by Sex in Red Butte
The most common commute times in Red Butte are 15 to 19 minutes (86 commuters, 55.5%) for males and 10 to 14 minutes (21 commuters, 34.4%) for females.
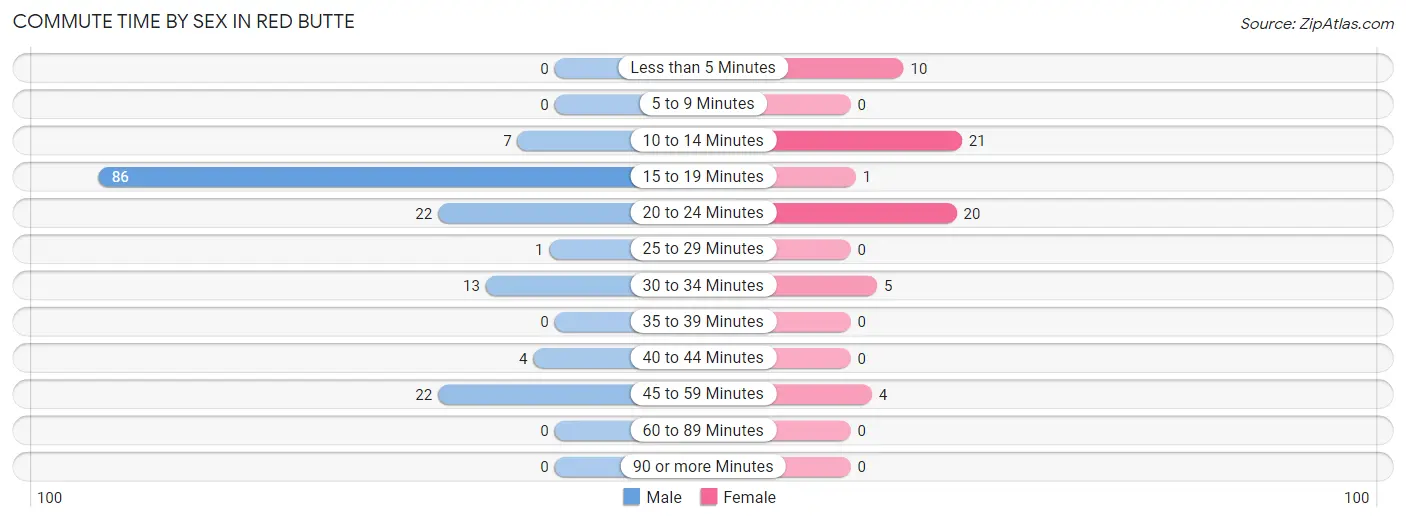
| Commute Time | Male | Female |
| Less than 5 Minutes | 0 (0.0%) | 10 (16.4%) |
| 5 to 9 Minutes | 0 (0.0%) | 0 (0.0%) |
| 10 to 14 Minutes | 7 (4.5%) | 21 (34.4%) |
| 15 to 19 Minutes | 86 (55.5%) | 1 (1.6%) |
| 20 to 24 Minutes | 22 (14.2%) | 20 (32.8%) |
| 25 to 29 Minutes | 1 (0.6%) | 0 (0.0%) |
| 30 to 34 Minutes | 13 (8.4%) | 5 (8.2%) |
| 35 to 39 Minutes | 0 (0.0%) | 0 (0.0%) |
| 40 to 44 Minutes | 4 (2.6%) | 0 (0.0%) |
| 45 to 59 Minutes | 22 (14.2%) | 4 (6.6%) |
| 60 to 89 Minutes | 0 (0.0%) | 0 (0.0%) |
| 90 or more Minutes | 0 (0.0%) | 0 (0.0%) |
Time of Departure to Work by Sex in Red Butte
The most frequent times of departure to work in Red Butte are 5:00 AM to 5:29 AM (86, 55.5%) for males and 6:00 AM to 6:29 AM (24, 39.3%) for females.
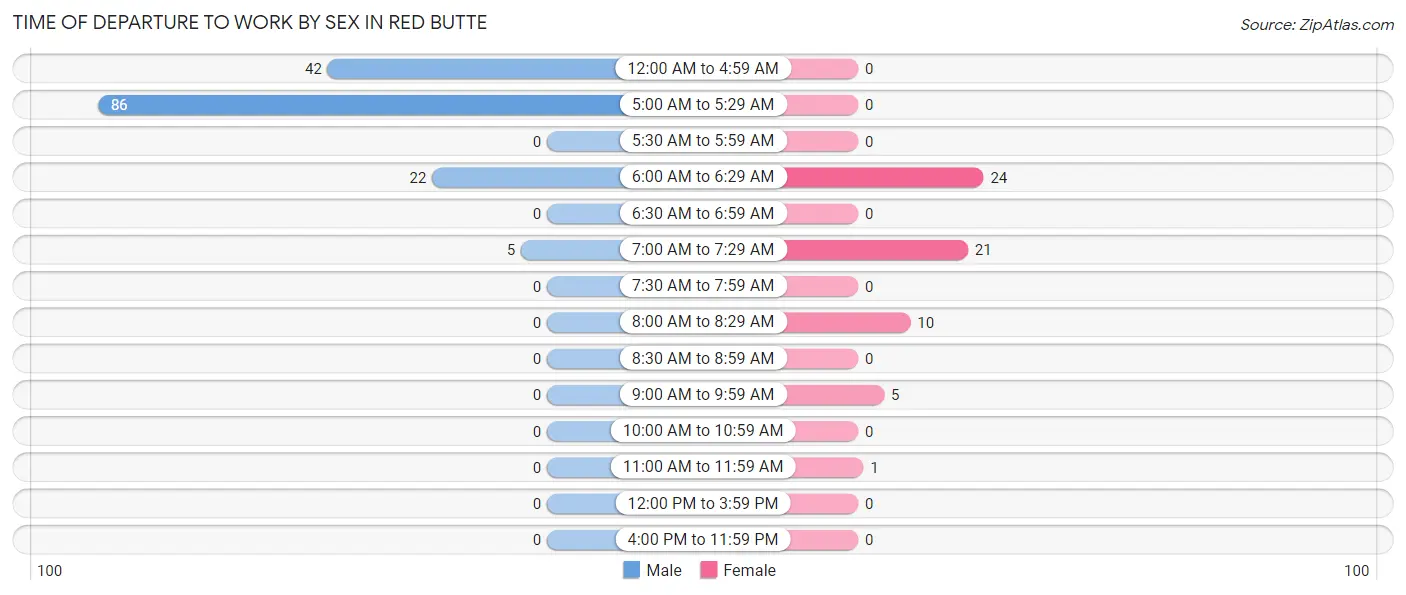
| Time of Departure | Male | Female |
| 12:00 AM to 4:59 AM | 42 (27.1%) | 0 (0.0%) |
| 5:00 AM to 5:29 AM | 86 (55.5%) | 0 (0.0%) |
| 5:30 AM to 5:59 AM | 0 (0.0%) | 0 (0.0%) |
| 6:00 AM to 6:29 AM | 22 (14.2%) | 24 (39.3%) |
| 6:30 AM to 6:59 AM | 0 (0.0%) | 0 (0.0%) |
| 7:00 AM to 7:29 AM | 5 (3.2%) | 21 (34.4%) |
| 7:30 AM to 7:59 AM | 0 (0.0%) | 0 (0.0%) |
| 8:00 AM to 8:29 AM | 0 (0.0%) | 10 (16.4%) |
| 8:30 AM to 8:59 AM | 0 (0.0%) | 0 (0.0%) |
| 9:00 AM to 9:59 AM | 0 (0.0%) | 5 (8.2%) |
| 10:00 AM to 10:59 AM | 0 (0.0%) | 0 (0.0%) |
| 11:00 AM to 11:59 AM | 0 (0.0%) | 1 (1.6%) |
| 12:00 PM to 3:59 PM | 0 (0.0%) | 0 (0.0%) |
| 4:00 PM to 11:59 PM | 0 (0.0%) | 0 (0.0%) |
| Total | 155 (100.0%) | 61 (100.0%) |
Housing Occupancy in Red Butte
Occupancy by Ownership in Red Butte
Of the total 203 dwellings in Red Butte, owner-occupied units account for 178 (87.7%), while renter-occupied units make up 25 (12.3%).
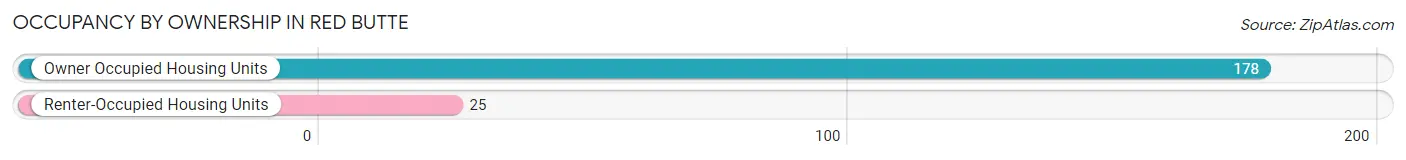
| Occupancy | # Housing Units | % Housing Units |
| Owner Occupied Housing Units | 178 | 87.7% |
| Renter-Occupied Housing Units | 25 | 12.3% |
| Total Occupied Housing Units | 203 | 100.0% |
Occupancy by Household Size in Red Butte
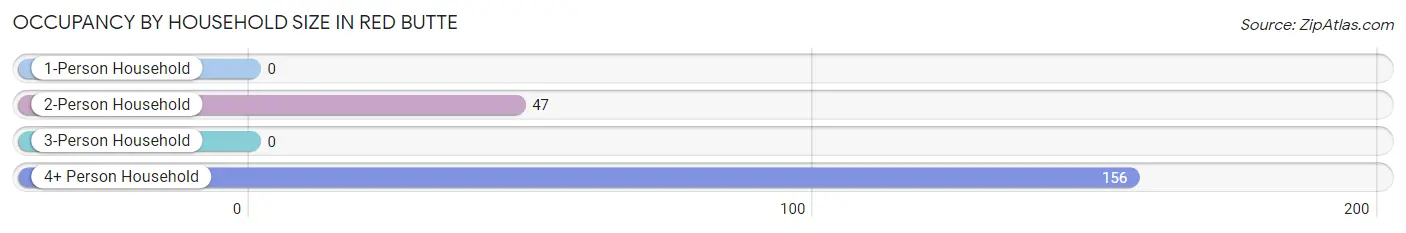
| Household Size | # Housing Units | % Housing Units |
| 1-Person Household | 0 | 0.0% |
| 2-Person Household | 47 | 23.2% |
| 3-Person Household | 0 | 0.0% |
| 4+ Person Household | 156 | 76.8% |
| Total Housing Units | 203 | 100.0% |
Occupancy by Ownership by Household Size in Red Butte
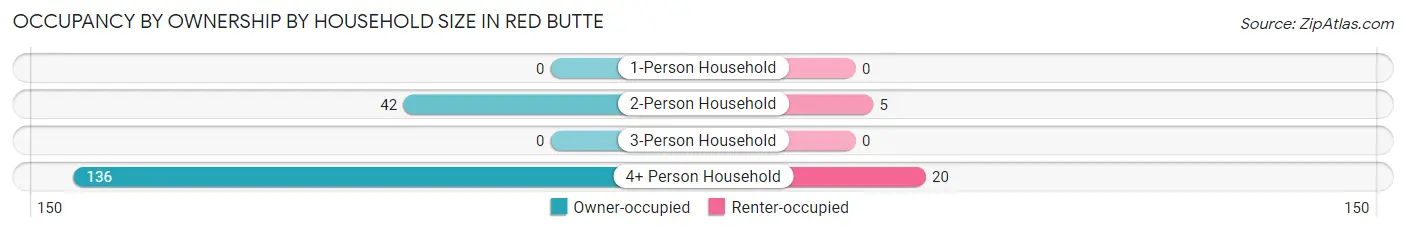
| Household Size | Owner-occupied | Renter-occupied |
| 1-Person Household | 0 (0.0%) | 0 (0.0%) |
| 2-Person Household | 42 (89.4%) | 5 (10.6%) |
| 3-Person Household | 0 (0.0%) | 0 (0.0%) |
| 4+ Person Household | 136 (87.2%) | 20 (12.8%) |
| Total Housing Units | 178 (87.7%) | 25 (12.3%) |
Occupancy by Educational Attainment in Red Butte
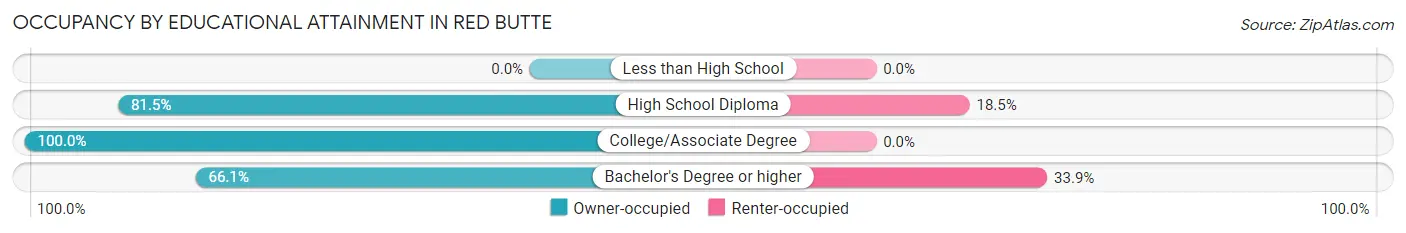
| Household Size | Owner-occupied | Renter-occupied |
| Less than High School | 0 (0.0%) | 0 (0.0%) |
| High School Diploma | 22 (81.5%) | 5 (18.5%) |
| College/Associate Degree | 117 (100.0%) | 0 (0.0%) |
| Bachelor's Degree or higher | 39 (66.1%) | 20 (33.9%) |
Occupancy by Age of Householder in Red Butte
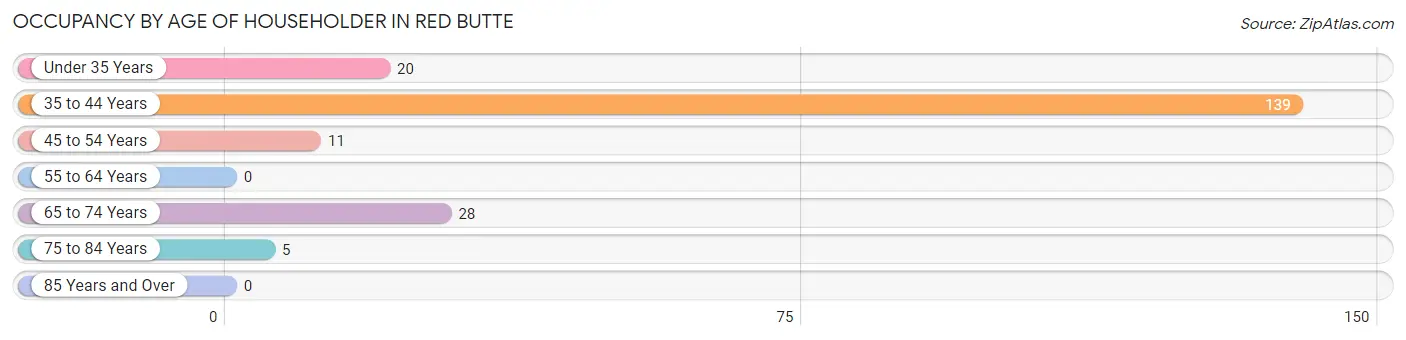
| Age Bracket | # Households | % Households |
| Under 35 Years | 20 | 9.9% |
| 35 to 44 Years | 139 | 68.5% |
| 45 to 54 Years | 11 | 5.4% |
| 55 to 64 Years | 0 | 0.0% |
| 65 to 74 Years | 28 | 13.8% |
| 75 to 84 Years | 5 | 2.5% |
| 85 Years and Over | 0 | 0.0% |
| Total | 203 | 100.0% |
Housing Finances in Red Butte
Median Income by Occupancy in Red Butte
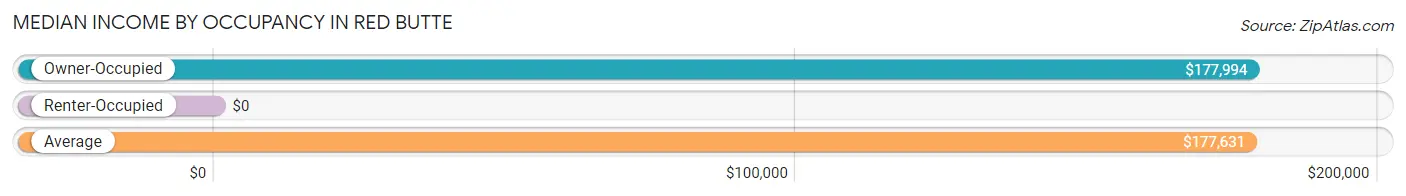
| Occupancy Type | # Households | Median Income |
| Owner-Occupied | 178 (87.7%) | $177,994 |
| Renter-Occupied | 25 (12.3%) | $0 |
| Average | 203 (100.0%) | $177,631 |
Occupancy by Householder Income Bracket in Red Butte
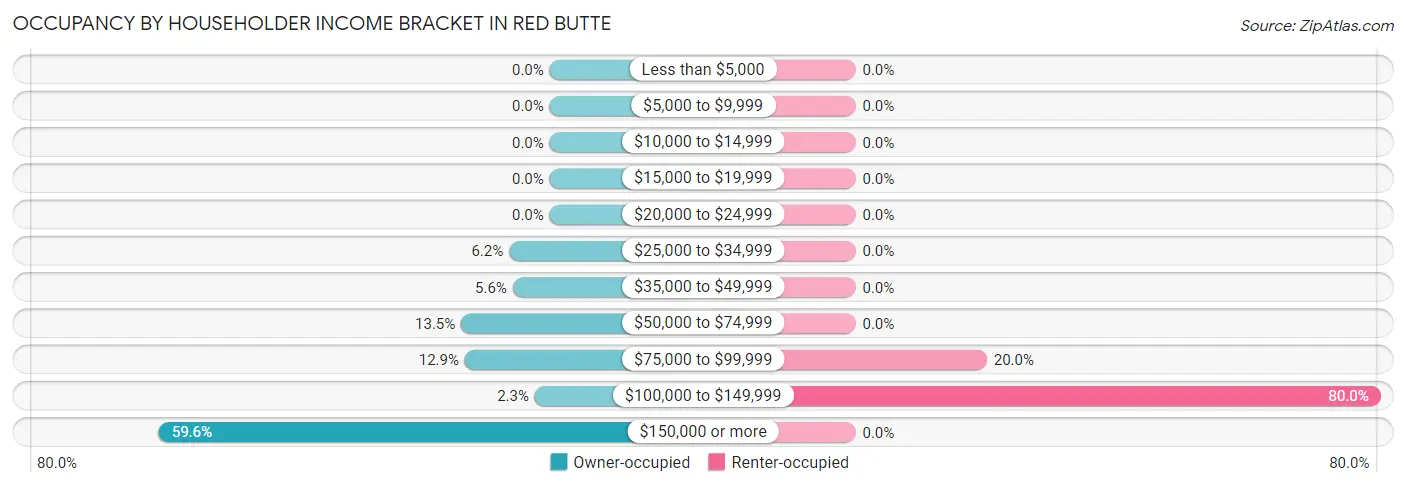
| Income Bracket | Owner-occupied | Renter-occupied |
| Less than $5,000 | 0 (0.0%) | 0 (0.0%) |
| $5,000 to $9,999 | 0 (0.0%) | 0 (0.0%) |
| $10,000 to $14,999 | 0 (0.0%) | 0 (0.0%) |
| $15,000 to $19,999 | 0 (0.0%) | 0 (0.0%) |
| $20,000 to $24,999 | 0 (0.0%) | 0 (0.0%) |
| $25,000 to $34,999 | 11 (6.2%) | 0 (0.0%) |
| $35,000 to $49,999 | 10 (5.6%) | 0 (0.0%) |
| $50,000 to $74,999 | 24 (13.5%) | 0 (0.0%) |
| $75,000 to $99,999 | 23 (12.9%) | 5 (20.0%) |
| $100,000 to $149,999 | 4 (2.2%) | 20 (80.0%) |
| $150,000 or more | 106 (59.6%) | 0 (0.0%) |
| Total | 178 (100.0%) | 25 (100.0%) |
Monthly Housing Cost Tiers in Red Butte
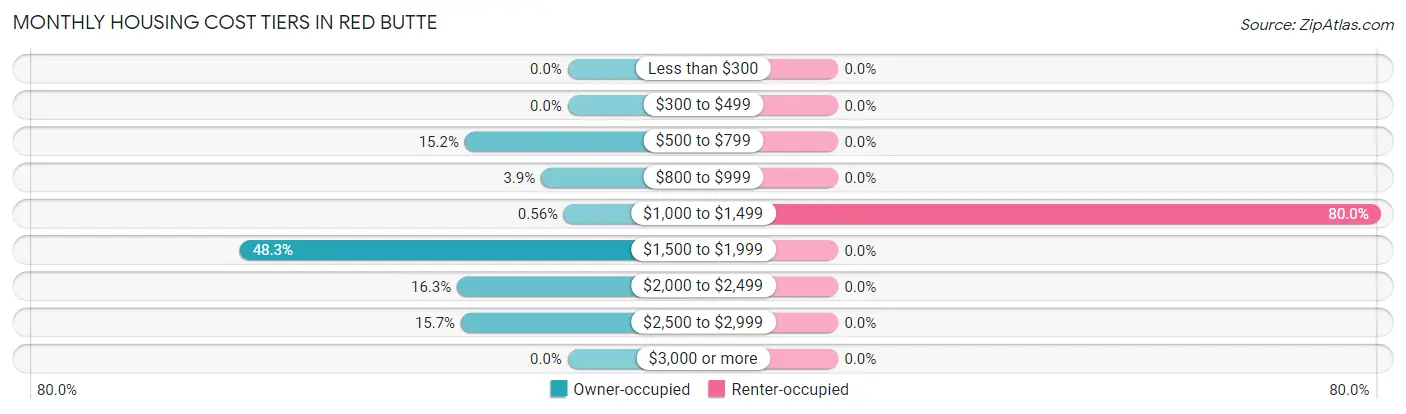
| Monthly Cost | Owner-occupied | Renter-occupied |
| Less than $300 | 0 (0.0%) | 0 (0.0%) |
| $300 to $499 | 0 (0.0%) | 0 (0.0%) |
| $500 to $799 | 27 (15.2%) | 0 (0.0%) |
| $800 to $999 | 7 (3.9%) | 0 (0.0%) |
| $1,000 to $1,499 | 1 (0.6%) | 20 (80.0%) |
| $1,500 to $1,999 | 86 (48.3%) | 0 (0.0%) |
| $2,000 to $2,499 | 29 (16.3%) | 0 (0.0%) |
| $2,500 to $2,999 | 28 (15.7%) | 0 (0.0%) |
| $3,000 or more | 0 (0.0%) | 0 (0.0%) |
| Total | 178 (100.0%) | 25 (100.0%) |
Physical Housing Characteristics in Red Butte
Housing Structures in Red Butte
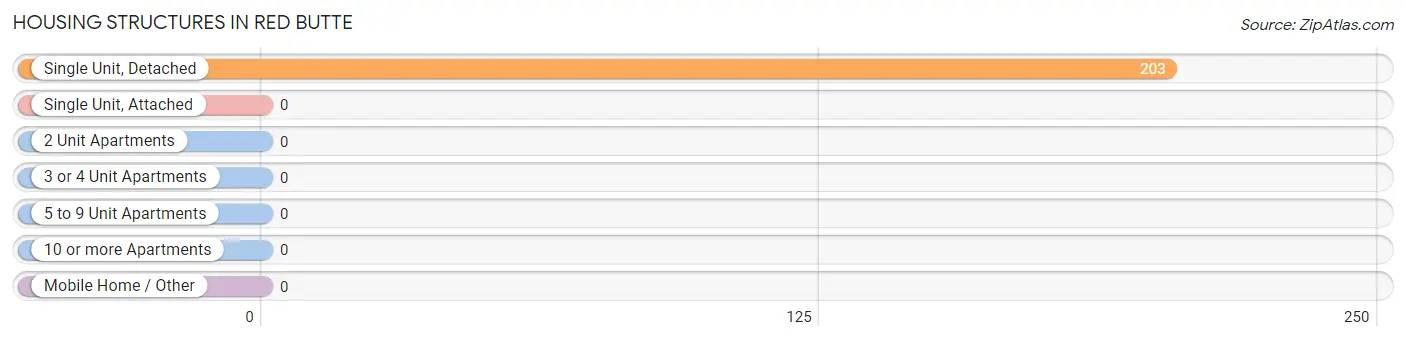
| Structure Type | # Housing Units | % Housing Units |
| Single Unit, Detached | 203 | 100.0% |
| Single Unit, Attached | 0 | 0.0% |
| 2 Unit Apartments | 0 | 0.0% |
| 3 or 4 Unit Apartments | 0 | 0.0% |
| 5 to 9 Unit Apartments | 0 | 0.0% |
| 10 or more Apartments | 0 | 0.0% |
| Mobile Home / Other | 0 | 0.0% |
| Total | 203 | 100.0% |
Housing Structures by Occupancy in Red Butte
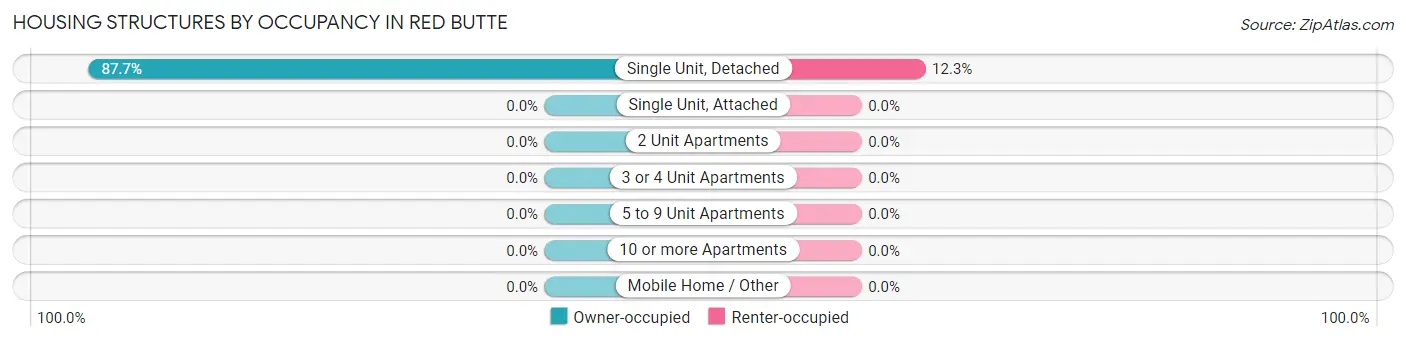
| Structure Type | Owner-occupied | Renter-occupied |
| Single Unit, Detached | 178 (87.7%) | 25 (12.3%) |
| Single Unit, Attached | 0 (0.0%) | 0 (0.0%) |
| 2 Unit Apartments | 0 (0.0%) | 0 (0.0%) |
| 3 or 4 Unit Apartments | 0 (0.0%) | 0 (0.0%) |
| 5 to 9 Unit Apartments | 0 (0.0%) | 0 (0.0%) |
| 10 or more Apartments | 0 (0.0%) | 0 (0.0%) |
| Mobile Home / Other | 0 (0.0%) | 0 (0.0%) |
| Total | 178 (87.7%) | 25 (12.3%) |
Housing Structures by Number of Rooms in Red Butte
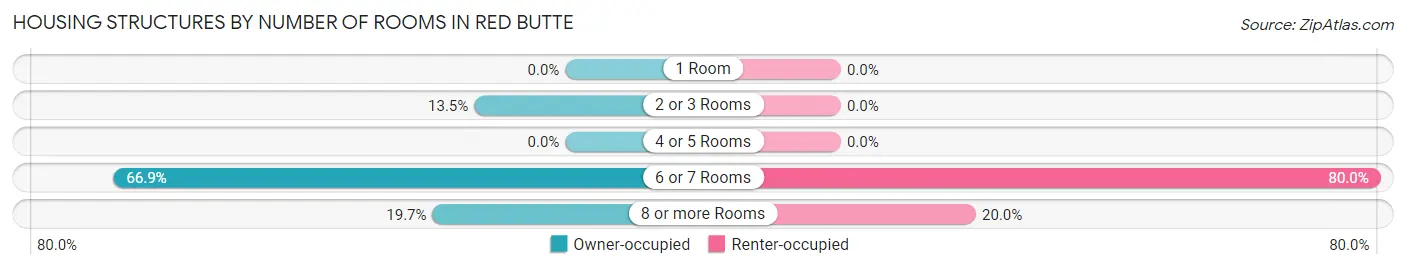
| Number of Rooms | Owner-occupied | Renter-occupied |
| 1 Room | 0 (0.0%) | 0 (0.0%) |
| 2 or 3 Rooms | 24 (13.5%) | 0 (0.0%) |
| 4 or 5 Rooms | 0 (0.0%) | 0 (0.0%) |
| 6 or 7 Rooms | 119 (66.8%) | 20 (80.0%) |
| 8 or more Rooms | 35 (19.7%) | 5 (20.0%) |
| Total | 178 (100.0%) | 25 (100.0%) |
Housing Structure by Heating Type in Red Butte
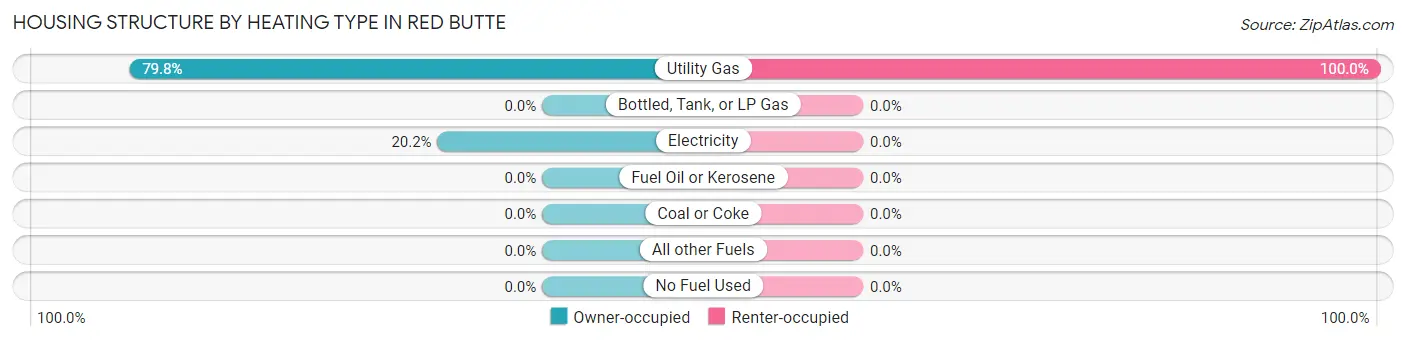
| Heating Type | Owner-occupied | Renter-occupied |
| Utility Gas | 142 (79.8%) | 25 (100.0%) |
| Bottled, Tank, or LP Gas | 0 (0.0%) | 0 (0.0%) |
| Electricity | 36 (20.2%) | 0 (0.0%) |
| Fuel Oil or Kerosene | 0 (0.0%) | 0 (0.0%) |
| Coal or Coke | 0 (0.0%) | 0 (0.0%) |
| All other Fuels | 0 (0.0%) | 0 (0.0%) |
| No Fuel Used | 0 (0.0%) | 0 (0.0%) |
| Total | 178 (100.0%) | 25 (100.0%) |
Household Vehicle Usage in Red Butte
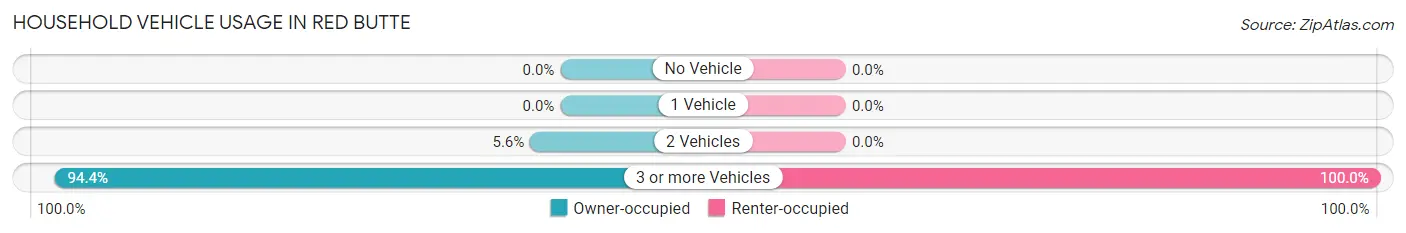
| Vehicles per Household | Owner-occupied | Renter-occupied |
| No Vehicle | 0 (0.0%) | 0 (0.0%) |
| 1 Vehicle | 0 (0.0%) | 0 (0.0%) |
| 2 Vehicles | 10 (5.6%) | 0 (0.0%) |
| 3 or more Vehicles | 168 (94.4%) | 25 (100.0%) |
| Total | 178 (100.0%) | 25 (100.0%) |
Real Estate & Mortgages in Red Butte
Real Estate and Mortgage Overview in Red Butte
| Characteristic | Without Mortgage | With Mortgage |
| Housing Units | 17 | 161 |
| Median Property Value | $556,800 | $359,400 |
| Median Household Income | - | - |
| Monthly Housing Costs | $625 | $0 |
| Real Estate Taxes | $3,850 | $0 |
Property Value by Mortgage Status in Red Butte
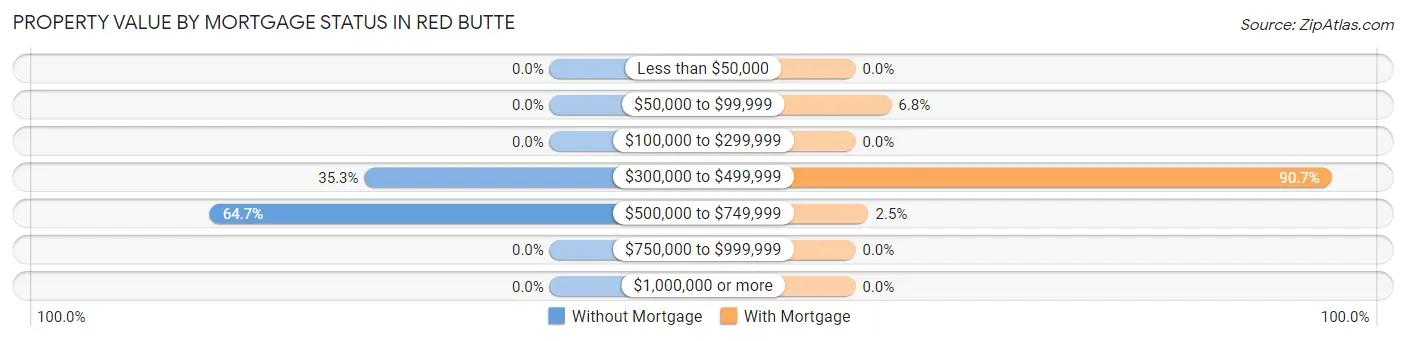
| Property Value | Without Mortgage | With Mortgage |
| Less than $50,000 | 0 (0.0%) | 0 (0.0%) |
| $50,000 to $99,999 | 0 (0.0%) | 11 (6.8%) |
| $100,000 to $299,999 | 0 (0.0%) | 0 (0.0%) |
| $300,000 to $499,999 | 6 (35.3%) | 146 (90.7%) |
| $500,000 to $749,999 | 11 (64.7%) | 4 (2.5%) |
| $750,000 to $999,999 | 0 (0.0%) | 0 (0.0%) |
| $1,000,000 or more | 0 (0.0%) | 0 (0.0%) |
| Total | 17 (100.0%) | 161 (100.0%) |
Household Income by Mortgage Status in Red Butte
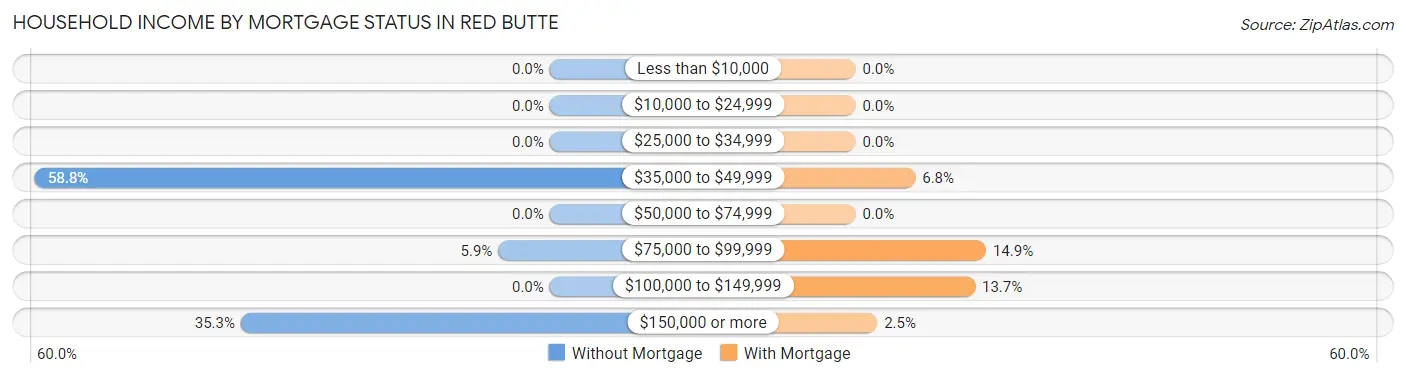
| Household Income | Without Mortgage | With Mortgage |
| Less than $10,000 | 0 (0.0%) | 0 (0.0%) |
| $10,000 to $24,999 | 0 (0.0%) | 0 (0.0%) |
| $25,000 to $34,999 | 0 (0.0%) | 0 (0.0%) |
| $35,000 to $49,999 | 10 (58.8%) | 11 (6.8%) |
| $50,000 to $74,999 | 0 (0.0%) | 0 (0.0%) |
| $75,000 to $99,999 | 1 (5.9%) | 24 (14.9%) |
| $100,000 to $149,999 | 0 (0.0%) | 22 (13.7%) |
| $150,000 or more | 6 (35.3%) | 4 (2.5%) |
| Total | 17 (100.0%) | 161 (100.0%) |
Property Value to Household Income Ratio in Red Butte
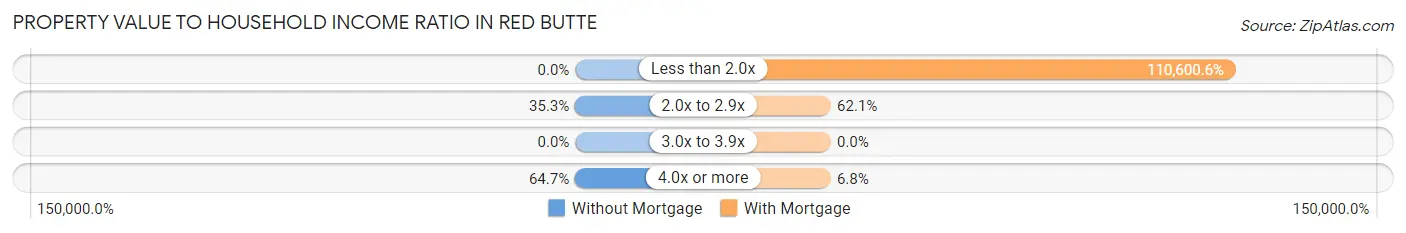
| Value-to-Income Ratio | Without Mortgage | With Mortgage |
| Less than 2.0x | 0 (0.0%) | 178,067 (110,600.6%) |
| 2.0x to 2.9x | 6 (35.3%) | 100 (62.1%) |
| 3.0x to 3.9x | 0 (0.0%) | 0 (0.0%) |
| 4.0x or more | 11 (64.7%) | 11 (6.8%) |
| Total | 17 (100.0%) | 161 (100.0%) |
Real Estate Taxes by Mortgage Status in Red Butte
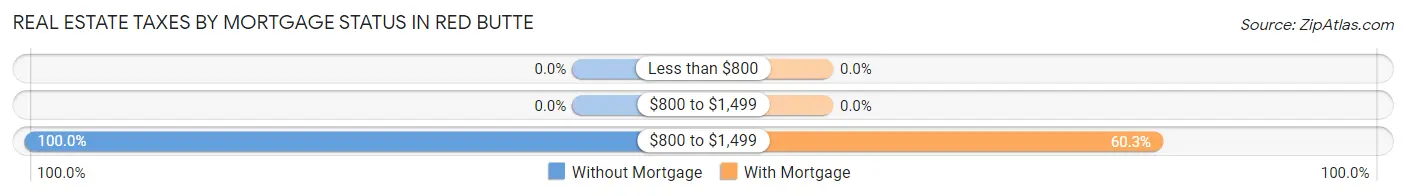
| Property Taxes | Without Mortgage | With Mortgage |
| Less than $800 | 0 (0.0%) | 0 (0.0%) |
| $800 to $1,499 | 0 (0.0%) | 0 (0.0%) |
| $800 to $1,499 | 17 (100.0%) | 97 (60.3%) |
| Total | 17 (100.0%) | 161 (100.0%) |
Health & Disability in Red Butte
Health Insurance Coverage by Age in Red Butte
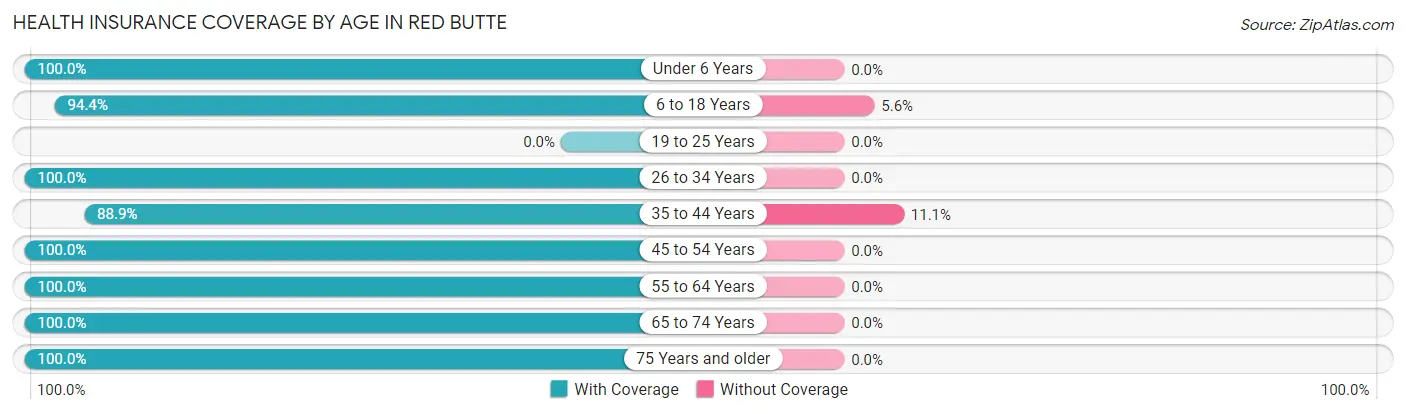
| Age Bracket | With Coverage | Without Coverage |
| Under 6 Years | 49 (100.0%) | 0 (0.0%) |
| 6 to 18 Years | 320 (94.4%) | 19 (5.6%) |
| 19 to 25 Years | 0 (0.0%) | 0 (0.0%) |
| 26 to 34 Years | 35 (100.0%) | 0 (0.0%) |
| 35 to 44 Years | 168 (88.9%) | 21 (11.1%) |
| 45 to 54 Years | 71 (100.0%) | 0 (0.0%) |
| 55 to 64 Years | 23 (100.0%) | 0 (0.0%) |
| 65 to 74 Years | 41 (100.0%) | 0 (0.0%) |
| 75 Years and older | 11 (100.0%) | 0 (0.0%) |
| Total | 718 (94.7%) | 40 (5.3%) |
Health Insurance Coverage by Citizenship Status in Red Butte
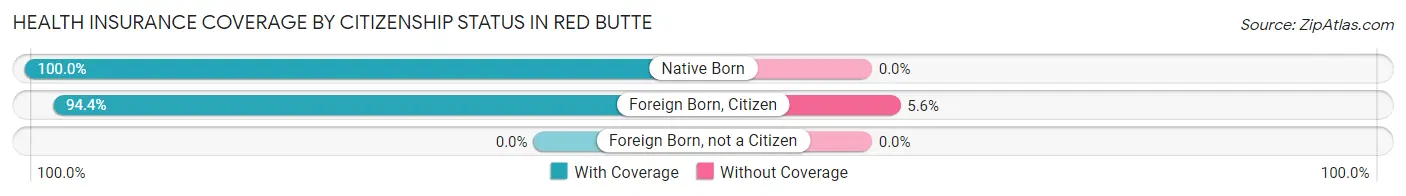
| Citizenship Status | With Coverage | Without Coverage |
| Native Born | 49 (100.0%) | 0 (0.0%) |
| Foreign Born, Citizen | 320 (94.4%) | 19 (5.6%) |
| Foreign Born, not a Citizen | 0 (0.0%) | 0 (0.0%) |
Health Insurance Coverage by Household Income in Red Butte
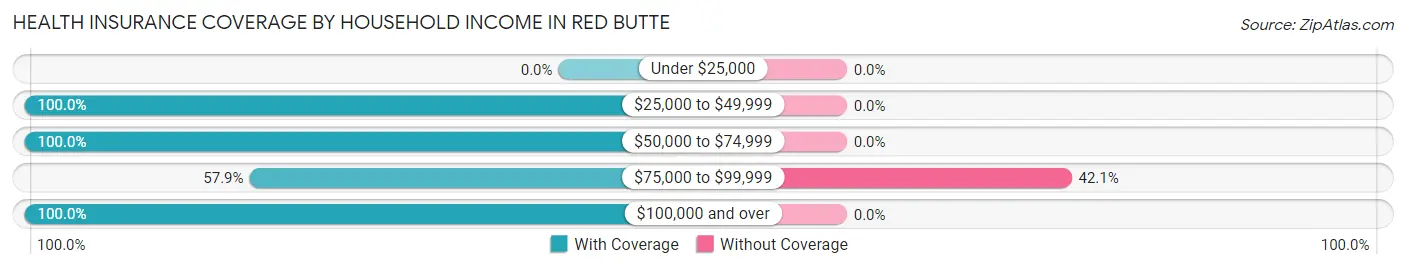
| Household Income | With Coverage | Without Coverage |
| Under $25,000 | 0 (0.0%) | 0 (0.0%) |
| $25,000 to $49,999 | 40 (100.0%) | 0 (0.0%) |
| $50,000 to $74,999 | 131 (100.0%) | 0 (0.0%) |
| $75,000 to $99,999 | 55 (57.9%) | 40 (42.1%) |
| $100,000 and over | 492 (100.0%) | 0 (0.0%) |
Public vs Private Health Insurance Coverage by Age in Red Butte
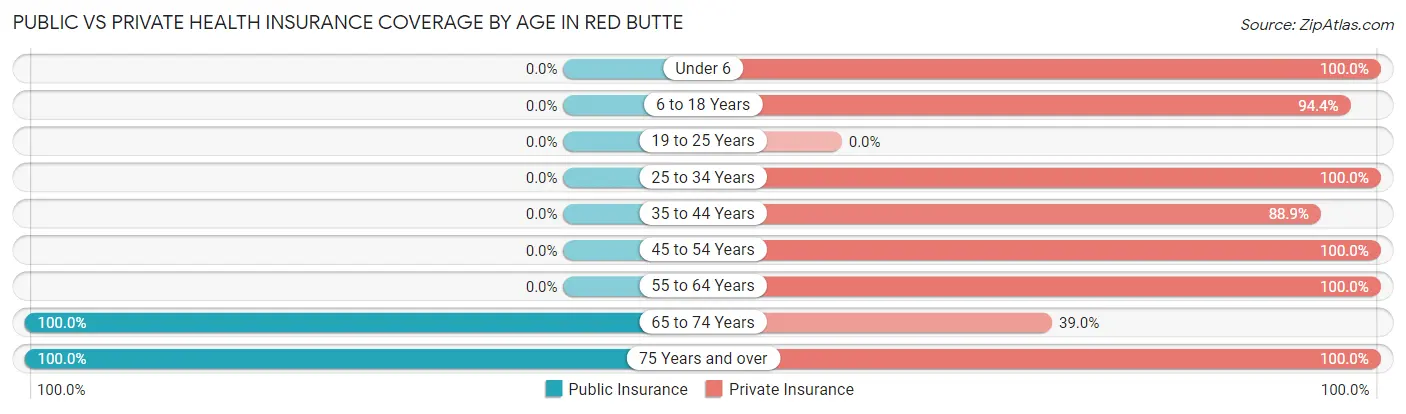
| Age Bracket | Public Insurance | Private Insurance |
| Under 6 | 0 (0.0%) | 49 (100.0%) |
| 6 to 18 Years | 0 (0.0%) | 320 (94.4%) |
| 19 to 25 Years | 0 (0.0%) | 0 (0.0%) |
| 25 to 34 Years | 0 (0.0%) | 35 (100.0%) |
| 35 to 44 Years | 0 (0.0%) | 168 (88.9%) |
| 45 to 54 Years | 0 (0.0%) | 71 (100.0%) |
| 55 to 64 Years | 0 (0.0%) | 23 (100.0%) |
| 65 to 74 Years | 41 (100.0%) | 16 (39.0%) |
| 75 Years and over | 11 (100.0%) | 11 (100.0%) |
| Total | 52 (6.9%) | 693 (91.4%) |
Disability Status by Sex by Age in Red Butte
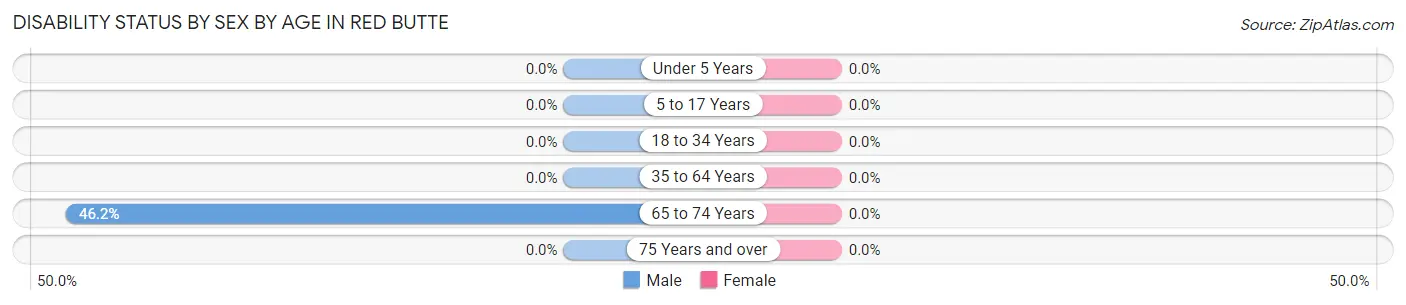
| Age Bracket | Male | Female |
| Under 5 Years | 0 (0.0%) | 0 (0.0%) |
| 5 to 17 Years | 0 (0.0%) | 0 (0.0%) |
| 18 to 34 Years | 0 (0.0%) | 0 (0.0%) |
| 35 to 64 Years | 0 (0.0%) | 0 (0.0%) |
| 65 to 74 Years | 6 (46.2%) | 0 (0.0%) |
| 75 Years and over | 0 (0.0%) | 0 (0.0%) |
Disability Class by Sex by Age in Red Butte
Disability Class: Hearing Difficulty
| Age Bracket | Male | Female |
| Under 5 Years | 0 (0.0%) | 0 (0.0%) |
| 5 to 17 Years | 0 (0.0%) | 0 (0.0%) |
| 18 to 34 Years | 0 (0.0%) | 0 (0.0%) |
| 35 to 64 Years | 0 (0.0%) | 0 (0.0%) |
| 65 to 74 Years | 0 (0.0%) | 0 (0.0%) |
| 75 Years and over | 0 (0.0%) | 0 (0.0%) |
Disability Class: Vision Difficulty
| Age Bracket | Male | Female |
| Under 5 Years | 0 (0.0%) | 0 (0.0%) |
| 5 to 17 Years | 0 (0.0%) | 0 (0.0%) |
| 18 to 34 Years | 0 (0.0%) | 0 (0.0%) |
| 35 to 64 Years | 0 (0.0%) | 0 (0.0%) |
| 65 to 74 Years | 0 (0.0%) | 0 (0.0%) |
| 75 Years and over | 0 (0.0%) | 0 (0.0%) |
Disability Class: Cognitive Difficulty
| Age Bracket | Male | Female |
| 5 to 17 Years | 0 (0.0%) | 0 (0.0%) |
| 18 to 34 Years | 0 (0.0%) | 0 (0.0%) |
| 35 to 64 Years | 0 (0.0%) | 0 (0.0%) |
| 65 to 74 Years | 0 (0.0%) | 0 (0.0%) |
| 75 Years and over | 0 (0.0%) | 0 (0.0%) |
Disability Class: Ambulatory Difficulty
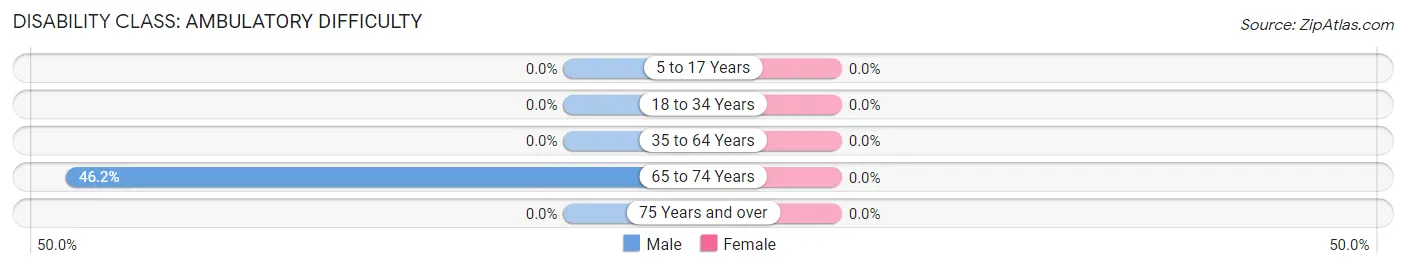
| Age Bracket | Male | Female |
| 5 to 17 Years | 0 (0.0%) | 0 (0.0%) |
| 18 to 34 Years | 0 (0.0%) | 0 (0.0%) |
| 35 to 64 Years | 0 (0.0%) | 0 (0.0%) |
| 65 to 74 Years | 6 (46.2%) | 0 (0.0%) |
| 75 Years and over | 0 (0.0%) | 0 (0.0%) |
Disability Class: Self-Care Difficulty
| Age Bracket | Male | Female |
| 5 to 17 Years | 0 (0.0%) | 0 (0.0%) |
| 18 to 34 Years | 0 (0.0%) | 0 (0.0%) |
| 35 to 64 Years | 0 (0.0%) | 0 (0.0%) |
| 65 to 74 Years | 0 (0.0%) | 0 (0.0%) |
| 75 Years and over | 0 (0.0%) | 0 (0.0%) |
Technology Access in Red Butte
Computing Device Access in Red Butte
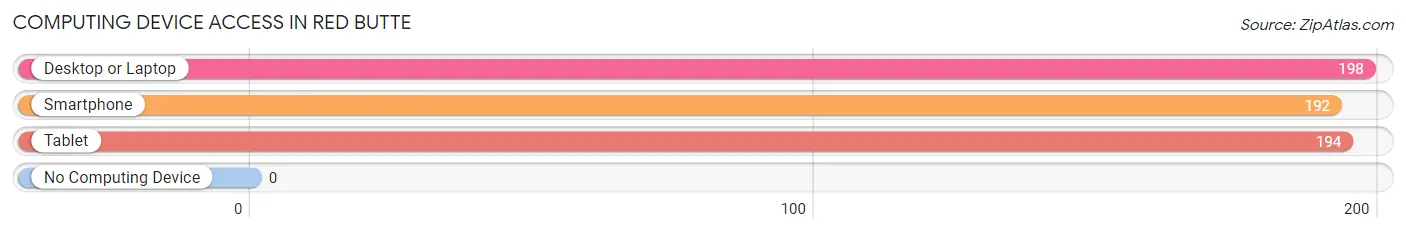
| Device Type | # Households | % Households |
| Desktop or Laptop | 198 | 97.5% |
| Smartphone | 192 | 94.6% |
| Tablet | 194 | 95.6% |
| No Computing Device | 0 | 0.0% |
| Total | 203 | 100.0% |
Internet Access in Red Butte
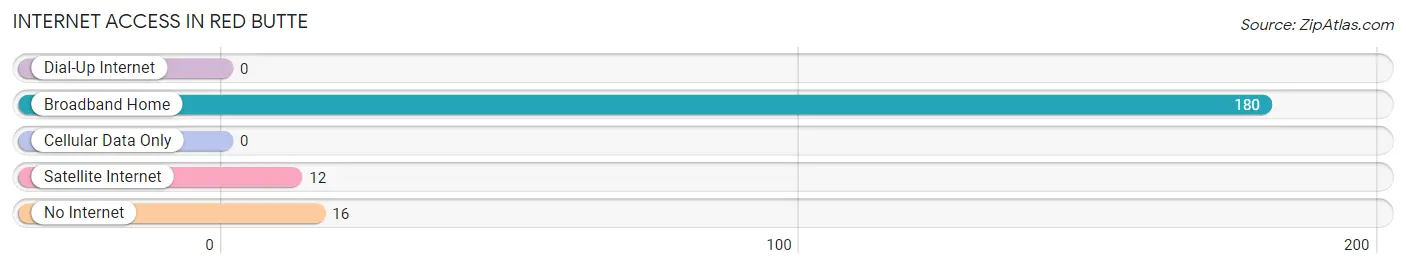
| Internet Type | # Households | % Households |
| Dial-Up Internet | 0 | 0.0% |
| Broadband Home | 180 | 88.7% |
| Cellular Data Only | 0 | 0.0% |
| Satellite Internet | 12 | 5.9% |
| No Internet | 16 | 7.9% |
| Total | 203 | 100.0% |
Red Butte Summary
Red Butte is a small unincorporated community located in the southeastern corner of Wyoming, in the United States. It is situated in the foothills of the Laramie Mountains, approximately 25 miles east of Laramie, the county seat of Albany County. Red Butte is a rural community with a population of approximately 200 people.
History
The area around Red Butte was first settled in the late 1800s by homesteaders and ranchers. The town was originally known as “Red Butte Station”, named after the nearby red butte that overlooks the town. The town was officially established in 1887, when the Union Pacific Railroad built a station in the area. The town was then renamed “Red Butte”.
In the early 1900s, Red Butte was a thriving community with a population of over 500 people. The town had a post office, a school, a hotel, a general store, and several other businesses. The town was also home to a large sheep ranching operation.
In the 1950s, the population of Red Butte began to decline as people moved away in search of better economic opportunities. By the 1970s, the population had dropped to just over 200 people.
Geography
Red Butte is located in the southeastern corner of Wyoming, in the United States. It is situated in the foothills of the Laramie Mountains, approximately 25 miles east of Laramie, the county seat of Albany County. The town is located at an elevation of 6,400 feet above sea level.
The town is surrounded by rolling hills and grasslands, with the Laramie Mountains to the west. The nearby Red Butte is a prominent landmark, rising to an elevation of 8,000 feet above sea level.
Economy
The economy of Red Butte is largely based on agriculture and ranching. The town is home to several large sheep and cattle ranches, as well as several smaller farms. The town also has a small retail sector, with a few stores and restaurants.
Demographics
As of the 2010 census, the population of Red Butte was 200 people. The racial makeup of the town was 97.5% White, 0.5% Native American, 0.5% Asian, and 1.5% from other races. The median household income was $41,250, and the median family income was $45,625. The per capita income was $19,818.
Conclusion
Red Butte is a small unincorporated community located in the southeastern corner of Wyoming, in the United States. It is situated in the foothills of the Laramie Mountains, approximately 25 miles east of Laramie, the county seat of Albany County. The town has a population of approximately 200 people and is largely based on agriculture and ranching. The town is home to several large sheep and cattle ranches, as well as several smaller farms. The town also has a small retail sector, with a few stores and restaurants.
Common Questions
What is Per Capita Income in Red Butte?
Per Capita income in Red Butte is $36,045.
What is the Median Family Income in Red Butte?
Median Family Income in Red Butte is $177,689.
What is the Median Household income in Red Butte?
Median Household Income in Red Butte is $177,631.
What is Inequality or Gini Index in Red Butte?
Inequality or Gini Index in Red Butte is 0.24.
What is the Total Population of Red Butte?
Total Population of Red Butte is 758.
What is the Total Male Population of Red Butte?
Total Male Population of Red Butte is 380.
What is the Total Female Population of Red Butte?
Total Female Population of Red Butte is 378.
What is the Ratio of Males per 100 Females in Red Butte?
There are 100.53 Males per 100 Females in Red Butte.
What is the Ratio of Females per 100 Males in Red Butte?
There are 99.47 Females per 100 Males in Red Butte.
What is the Median Population Age in Red Butte?
Median Population Age in Red Butte is 15.7 Years.
What is the Average Family Size in Red Butte
Average Family Size in Red Butte is 3.8 People.
What is the Average Household Size in Red Butte
Average Household Size in Red Butte is 3.7 People.
How Large is the Labor Force in Red Butte?
There are 260 People in the Labor Forcein in Red Butte.
What is the Percentage of People in the Labor Force in Red Butte?
70.3% of People are in the Labor Force in Red Butte.