Yuman vs Creek 3 or more Vehicles in Household
COMPARE
Yuman
Creek
3 or more Vehicles in Household
3 or more Vehicles in Household Comparison
Yuman
Creek
19.9%
3 OR MORE VEHICLES IN HOUSEHOLD
75.6/ 100
METRIC RATING
153rd/ 347
METRIC RANK
21.9%
3 OR MORE VEHICLES IN HOUSEHOLD
99.9/ 100
METRIC RATING
69th/ 347
METRIC RANK
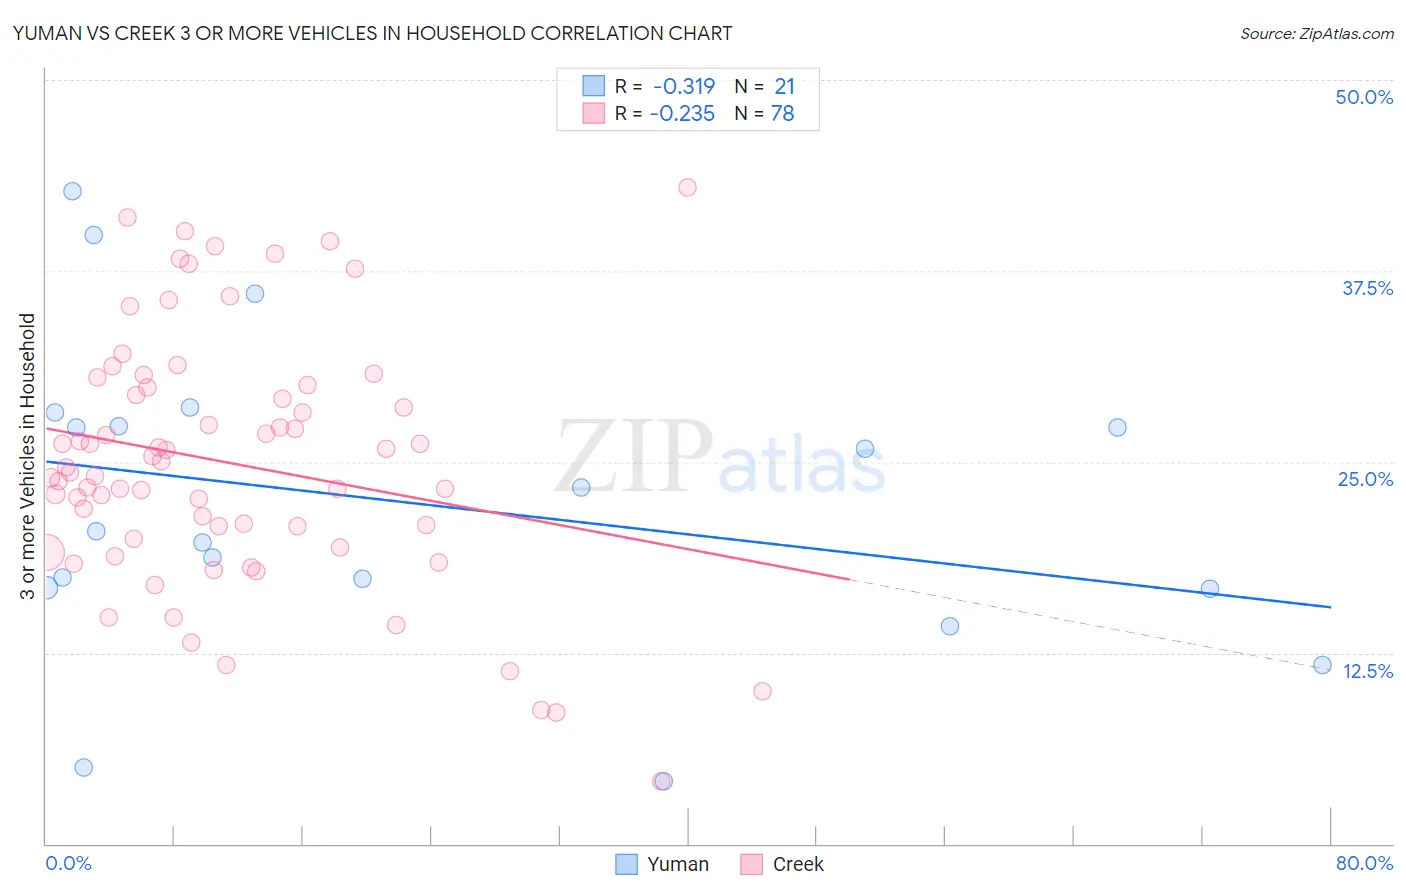
Yuman vs Creek 3 or more Vehicles in Household Correlation Chart
The statistical analysis conducted on geographies consisting of 40,662,835 people shows a mild negative correlation between the proportion of Yuman and percentage of households with 3 or more vehicles available in the United States with a correlation coefficient (R) of -0.319 and weighted average of 19.9%. Similarly, the statistical analysis conducted on geographies consisting of 178,435,403 people shows a weak negative correlation between the proportion of Creek and percentage of households with 3 or more vehicles available in the United States with a correlation coefficient (R) of -0.235 and weighted average of 21.9%, a difference of 10.0%.
3 or more Vehicles in Household Correlation Summary
| Measurement | Yuman | Creek |
| Minimum | 4.1% | 4.1% |
| Maximum | 42.7% | 43.0% |
| Range | 38.7% | 38.9% |
| Mean | 22.3% | 24.9% |
| Median | 20.5% | 24.5% |
| Interquartile 25% (IQ1) | 16.7% | 20.0% |
| Interquartile 75% (IQ3) | 27.8% | 29.9% |
| Interquartile Range (IQR) | 11.1% | 9.9% |
| Standard Deviation (Sample) | 10.0% | 8.2% |
| Standard Deviation (Population) | 9.8% | 8.2% |
Similar Demographics by 3 or more Vehicles in Household
Demographics Similar to Yuman by 3 or more Vehicles in Household
In terms of 3 or more vehicles in household, the demographic groups most similar to Yuman are Immigrants from Jordan (19.9%, a difference of 0.060%), Tlingit-Haida (19.9%, a difference of 0.22%), Thai (19.8%, a difference of 0.43%), Lebanese (20.0%, a difference of 0.44%), and Hungarian (19.8%, a difference of 0.48%).
| Demographics | Rating | Rank | 3 or more Vehicles in Household |
| Australians | 83.6 /100 | #146 | Excellent 20.1% |
| Slovaks | 83.0 /100 | #147 | Excellent 20.1% |
| Guatemalans | 82.6 /100 | #148 | Excellent 20.1% |
| Immigrants | Iran | 80.9 /100 | #149 | Excellent 20.0% |
| Immigrants | Immigrants | 80.8 /100 | #150 | Excellent 20.0% |
| Taiwanese | 80.6 /100 | #151 | Excellent 20.0% |
| Lebanese | 79.8 /100 | #152 | Good 20.0% |
| Yuman | 75.6 /100 | #153 | Good 19.9% |
| Immigrants | Jordan | 75.0 /100 | #154 | Good 19.9% |
| Tlingit-Haida | 73.4 /100 | #155 | Good 19.9% |
| Thais | 71.1 /100 | #156 | Good 19.8% |
| Hungarians | 70.5 /100 | #157 | Good 19.8% |
| Armenians | 68.8 /100 | #158 | Good 19.8% |
| Immigrants | Pakistan | 68.2 /100 | #159 | Good 19.8% |
| Immigrants | Lebanon | 67.6 /100 | #160 | Good 19.8% |
Demographics Similar to Creek by 3 or more Vehicles in Household
In terms of 3 or more vehicles in household, the demographic groups most similar to Creek are British (21.9%, a difference of 0.030%), Alaskan Athabascan (21.9%, a difference of 0.18%), Bangladeshi (21.9%, a difference of 0.19%), Potawatomi (21.9%, a difference of 0.20%), and Portuguese (21.8%, a difference of 0.38%).
| Demographics | Rating | Rank | 3 or more Vehicles in Household |
| Fijians | 99.9 /100 | #62 | Exceptional 22.2% |
| Chickasaw | 99.9 /100 | #63 | Exceptional 22.2% |
| Immigrants | Taiwan | 99.9 /100 | #64 | Exceptional 22.1% |
| Pima | 99.9 /100 | #65 | Exceptional 22.0% |
| Northern Europeans | 99.9 /100 | #66 | Exceptional 22.0% |
| Alaskan Athabascans | 99.9 /100 | #67 | Exceptional 21.9% |
| British | 99.9 /100 | #68 | Exceptional 21.9% |
| Creek | 99.9 /100 | #69 | Exceptional 21.9% |
| Bangladeshis | 99.8 /100 | #70 | Exceptional 21.9% |
| Potawatomi | 99.8 /100 | #71 | Exceptional 21.9% |
| Portuguese | 99.8 /100 | #72 | Exceptional 21.8% |
| Salvadorans | 99.8 /100 | #73 | Exceptional 21.8% |
| Immigrants | Oceania | 99.8 /100 | #74 | Exceptional 21.8% |
| Japanese | 99.8 /100 | #75 | Exceptional 21.8% |
| Immigrants | Nonimmigrants | 99.8 /100 | #76 | Exceptional 21.8% |