Macedonian vs Creek 3 or more Vehicles in Household
COMPARE
Macedonian
Creek
3 or more Vehicles in Household
3 or more Vehicles in Household Comparison
Macedonians
Creek
17.7%
3 OR MORE VEHICLES IN HOUSEHOLD
0.8/ 100
METRIC RATING
266th/ 347
METRIC RANK
21.9%
3 OR MORE VEHICLES IN HOUSEHOLD
99.9/ 100
METRIC RATING
69th/ 347
METRIC RANK
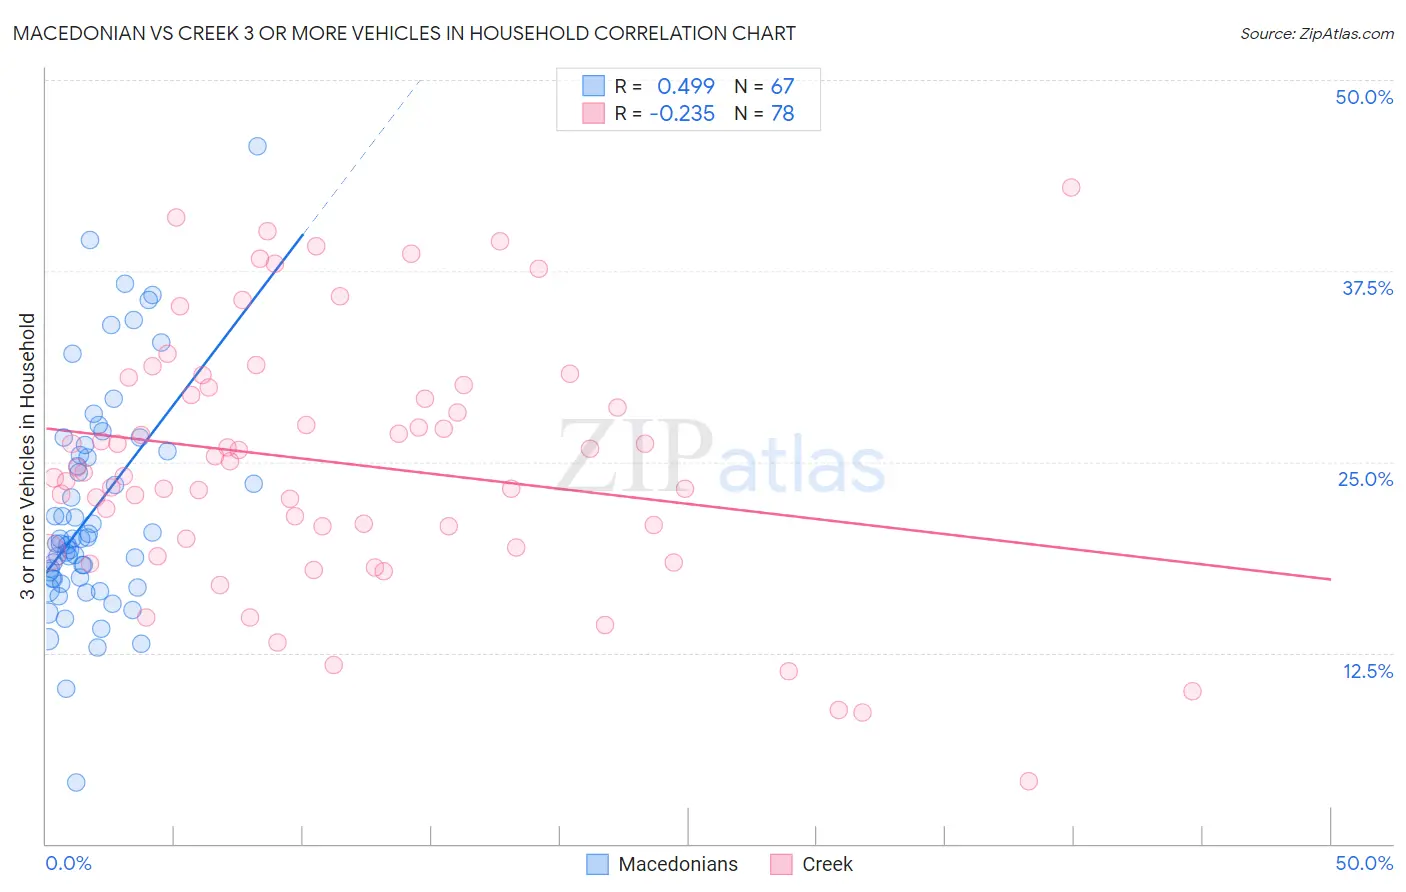
Macedonian vs Creek 3 or more Vehicles in Household Correlation Chart
The statistical analysis conducted on geographies consisting of 132,563,114 people shows a moderate positive correlation between the proportion of Macedonians and percentage of households with 3 or more vehicles available in the United States with a correlation coefficient (R) of 0.499 and weighted average of 17.7%. Similarly, the statistical analysis conducted on geographies consisting of 178,435,403 people shows a weak negative correlation between the proportion of Creek and percentage of households with 3 or more vehicles available in the United States with a correlation coefficient (R) of -0.235 and weighted average of 21.9%, a difference of 23.6%.
3 or more Vehicles in Household Correlation Summary
| Measurement | Macedonian | Creek |
| Minimum | 4.0% | 4.1% |
| Maximum | 45.7% | 43.0% |
| Range | 41.6% | 38.9% |
| Mean | 21.8% | 24.9% |
| Median | 19.9% | 24.5% |
| Interquartile 25% (IQ1) | 17.3% | 20.0% |
| Interquartile 75% (IQ3) | 25.7% | 29.9% |
| Interquartile Range (IQR) | 8.4% | 9.9% |
| Standard Deviation (Sample) | 7.4% | 8.2% |
| Standard Deviation (Population) | 7.3% | 8.2% |
Similar Demographics by 3 or more Vehicles in Household
Demographics Similar to Macedonians by 3 or more Vehicles in Household
In terms of 3 or more vehicles in household, the demographic groups most similar to Macedonians are Immigrants from Panama (17.7%, a difference of 0.020%), Immigrants from Venezuela (17.7%, a difference of 0.050%), Immigrants from Bulgaria (17.7%, a difference of 0.070%), Cambodian (17.8%, a difference of 0.16%), and Bermudan (17.8%, a difference of 0.19%).
| Demographics | Rating | Rank | 3 or more Vehicles in Household |
| Uruguayans | 1.0 /100 | #259 | Tragic 17.8% |
| Ugandans | 0.9 /100 | #260 | Tragic 17.8% |
| Immigrants | Northern Africa | 0.9 /100 | #261 | Tragic 17.8% |
| Colombians | 0.9 /100 | #262 | Tragic 17.8% |
| Bermudans | 0.9 /100 | #263 | Tragic 17.8% |
| Cambodians | 0.9 /100 | #264 | Tragic 17.8% |
| Immigrants | Panama | 0.8 /100 | #265 | Tragic 17.7% |
| Macedonians | 0.8 /100 | #266 | Tragic 17.7% |
| Immigrants | Venezuela | 0.8 /100 | #267 | Tragic 17.7% |
| Immigrants | Bulgaria | 0.8 /100 | #268 | Tragic 17.7% |
| Immigrants | France | 0.6 /100 | #269 | Tragic 17.6% |
| Immigrants | Nepal | 0.6 /100 | #270 | Tragic 17.6% |
| South Americans | 0.6 /100 | #271 | Tragic 17.6% |
| Immigrants | Africa | 0.5 /100 | #272 | Tragic 17.6% |
| Immigrants | Sudan | 0.5 /100 | #273 | Tragic 17.6% |
Demographics Similar to Creek by 3 or more Vehicles in Household
In terms of 3 or more vehicles in household, the demographic groups most similar to Creek are British (21.9%, a difference of 0.030%), Alaskan Athabascan (21.9%, a difference of 0.18%), Bangladeshi (21.9%, a difference of 0.19%), Potawatomi (21.9%, a difference of 0.20%), and Portuguese (21.8%, a difference of 0.38%).
| Demographics | Rating | Rank | 3 or more Vehicles in Household |
| Fijians | 99.9 /100 | #62 | Exceptional 22.2% |
| Chickasaw | 99.9 /100 | #63 | Exceptional 22.2% |
| Immigrants | Taiwan | 99.9 /100 | #64 | Exceptional 22.1% |
| Pima | 99.9 /100 | #65 | Exceptional 22.0% |
| Northern Europeans | 99.9 /100 | #66 | Exceptional 22.0% |
| Alaskan Athabascans | 99.9 /100 | #67 | Exceptional 21.9% |
| British | 99.9 /100 | #68 | Exceptional 21.9% |
| Creek | 99.9 /100 | #69 | Exceptional 21.9% |
| Bangladeshis | 99.8 /100 | #70 | Exceptional 21.9% |
| Potawatomi | 99.8 /100 | #71 | Exceptional 21.9% |
| Portuguese | 99.8 /100 | #72 | Exceptional 21.8% |
| Salvadorans | 99.8 /100 | #73 | Exceptional 21.8% |
| Immigrants | Oceania | 99.8 /100 | #74 | Exceptional 21.8% |
| Japanese | 99.8 /100 | #75 | Exceptional 21.8% |
| Immigrants | Nonimmigrants | 99.8 /100 | #76 | Exceptional 21.8% |