Yuman vs Creek 7th Grade
COMPARE
Yuman
Creek
7th Grade
7th Grade Comparison
Yuman
Creek
95.2%
7TH GRADE
0.3/ 100
METRIC RATING
267th/ 347
METRIC RANK
96.9%
7TH GRADE
99.8/ 100
METRIC RATING
61st/ 347
METRIC RANK
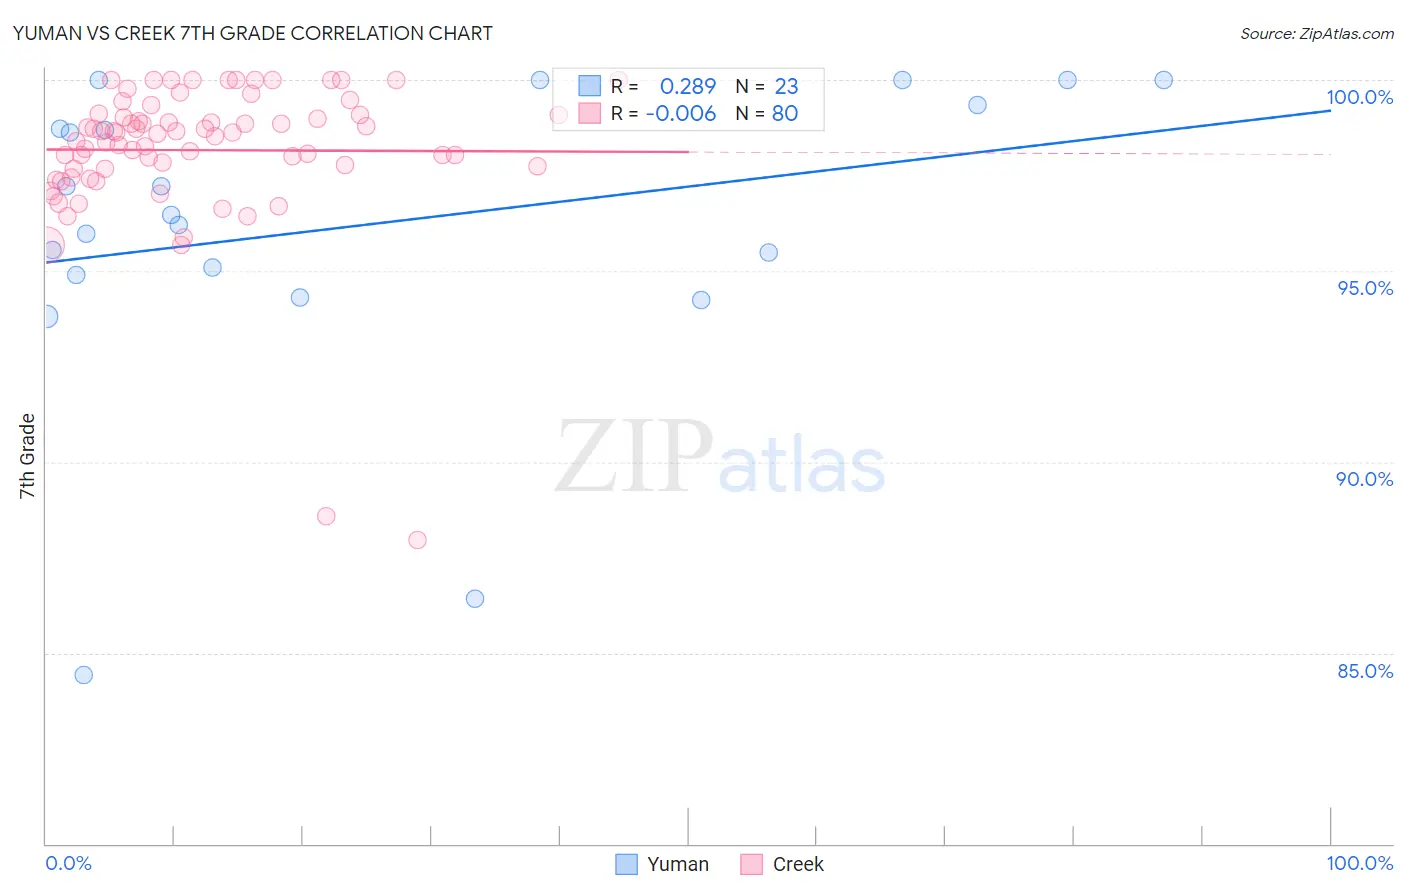
Yuman vs Creek 7th Grade Correlation Chart
The statistical analysis conducted on geographies consisting of 40,696,349 people shows a weak positive correlation between the proportion of Yuman and percentage of population with at least 7th grade education in the United States with a correlation coefficient (R) of 0.289 and weighted average of 95.2%. Similarly, the statistical analysis conducted on geographies consisting of 178,480,629 people shows no correlation between the proportion of Creek and percentage of population with at least 7th grade education in the United States with a correlation coefficient (R) of -0.006 and weighted average of 96.9%, a difference of 1.8%.
7th Grade Correlation Summary
| Measurement | Yuman | Creek |
| Minimum | 84.4% | 88.0% |
| Maximum | 100.0% | 100.0% |
| Range | 15.6% | 12.0% |
| Mean | 96.2% | 98.2% |
| Median | 96.5% | 98.6% |
| Interquartile 25% (IQ1) | 94.9% | 97.7% |
| Interquartile 75% (IQ3) | 99.3% | 99.1% |
| Interquartile Range (IQR) | 4.4% | 1.4% |
| Standard Deviation (Sample) | 4.0% | 1.9% |
| Standard Deviation (Population) | 3.9% | 1.9% |
Similar Demographics by 7th Grade
Demographics Similar to Yuman by 7th Grade
In terms of 7th grade, the demographic groups most similar to Yuman are Immigrants from Ghana (95.2%, a difference of 0.010%), Immigrants from Hong Kong (95.2%, a difference of 0.010%), Immigrants from Uruguay (95.2%, a difference of 0.020%), Trinidadian and Tobagonian (95.2%, a difference of 0.030%), and Immigrants from Nigeria (95.2%, a difference of 0.050%).
| Demographics | Rating | Rank | 7th Grade |
| Afghans | 0.5 /100 | #260 | Tragic 95.3% |
| South Americans | 0.5 /100 | #261 | Tragic 95.2% |
| Immigrants | Somalia | 0.5 /100 | #262 | Tragic 95.2% |
| West Indians | 0.5 /100 | #263 | Tragic 95.2% |
| Immigrants | Nigeria | 0.4 /100 | #264 | Tragic 95.2% |
| Immigrants | Uruguay | 0.3 /100 | #265 | Tragic 95.2% |
| Immigrants | Ghana | 0.3 /100 | #266 | Tragic 95.2% |
| Yuman | 0.3 /100 | #267 | Tragic 95.2% |
| Immigrants | Hong Kong | 0.3 /100 | #268 | Tragic 95.2% |
| Trinidadians and Tobagonians | 0.3 /100 | #269 | Tragic 95.2% |
| Houma | 0.2 /100 | #270 | Tragic 95.1% |
| Immigrants | South America | 0.2 /100 | #271 | Tragic 95.1% |
| Peruvians | 0.2 /100 | #272 | Tragic 95.1% |
| Immigrants | Uzbekistan | 0.2 /100 | #273 | Tragic 95.1% |
| Immigrants | Western Africa | 0.2 /100 | #274 | Tragic 95.1% |
Demographics Similar to Creek by 7th Grade
In terms of 7th grade, the demographic groups most similar to Creek are Immigrants from Canada (96.9%, a difference of 0.0%), White/Caucasian (97.0%, a difference of 0.010%), Macedonian (97.0%, a difference of 0.010%), Immigrants from North America (96.9%, a difference of 0.010%), and Immigrants from Northern Europe (96.9%, a difference of 0.020%).
| Demographics | Rating | Rank | 7th Grade |
| Australians | 99.8 /100 | #54 | Exceptional 97.0% |
| Russians | 99.8 /100 | #55 | Exceptional 97.0% |
| Serbians | 99.8 /100 | #56 | Exceptional 97.0% |
| Americans | 99.8 /100 | #57 | Exceptional 97.0% |
| Whites/Caucasians | 99.8 /100 | #58 | Exceptional 97.0% |
| Macedonians | 99.8 /100 | #59 | Exceptional 97.0% |
| Immigrants | Canada | 99.8 /100 | #60 | Exceptional 96.9% |
| Creek | 99.8 /100 | #61 | Exceptional 96.9% |
| Immigrants | North America | 99.8 /100 | #62 | Exceptional 96.9% |
| Immigrants | Northern Europe | 99.7 /100 | #63 | Exceptional 96.9% |
| Immigrants | Austria | 99.7 /100 | #64 | Exceptional 96.9% |
| Canadians | 99.7 /100 | #65 | Exceptional 96.9% |
| Ukrainians | 99.7 /100 | #66 | Exceptional 96.9% |
| Native Hawaiians | 99.7 /100 | #67 | Exceptional 96.9% |
| Immigrants | India | 99.6 /100 | #68 | Exceptional 96.9% |