Indonesian vs Creek 3 or more Vehicles in Household
COMPARE
Indonesian
Creek
3 or more Vehicles in Household
3 or more Vehicles in Household Comparison
Indonesians
Creek
18.3%
3 OR MORE VEHICLES IN HOUSEHOLD
3.5/ 100
METRIC RATING
237th/ 347
METRIC RANK
21.9%
3 OR MORE VEHICLES IN HOUSEHOLD
99.9/ 100
METRIC RATING
69th/ 347
METRIC RANK
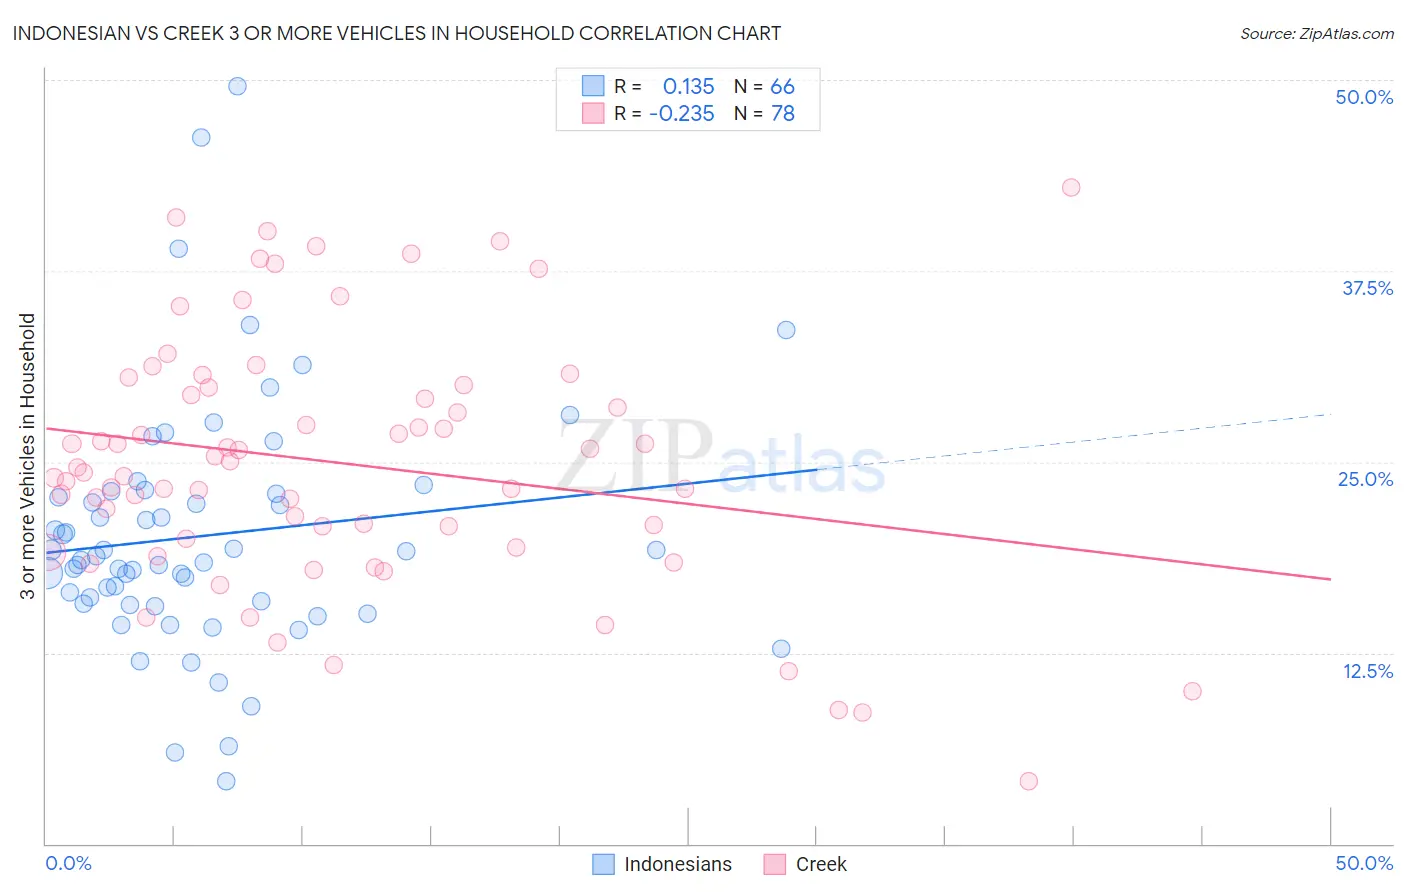
Indonesian vs Creek 3 or more Vehicles in Household Correlation Chart
The statistical analysis conducted on geographies consisting of 162,622,478 people shows a poor positive correlation between the proportion of Indonesians and percentage of households with 3 or more vehicles available in the United States with a correlation coefficient (R) of 0.135 and weighted average of 18.3%. Similarly, the statistical analysis conducted on geographies consisting of 178,435,403 people shows a weak negative correlation between the proportion of Creek and percentage of households with 3 or more vehicles available in the United States with a correlation coefficient (R) of -0.235 and weighted average of 21.9%, a difference of 19.9%.
3 or more Vehicles in Household Correlation Summary
| Measurement | Indonesian | Creek |
| Minimum | 4.1% | 4.1% |
| Maximum | 49.6% | 43.0% |
| Range | 45.5% | 38.9% |
| Mean | 20.2% | 24.9% |
| Median | 18.7% | 24.5% |
| Interquartile 25% (IQ1) | 15.7% | 20.0% |
| Interquartile 75% (IQ3) | 22.9% | 29.9% |
| Interquartile Range (IQR) | 7.2% | 9.9% |
| Standard Deviation (Sample) | 8.1% | 8.2% |
| Standard Deviation (Population) | 8.0% | 8.2% |
Similar Demographics by 3 or more Vehicles in Household
Demographics Similar to Indonesians by 3 or more Vehicles in Household
In terms of 3 or more vehicles in household, the demographic groups most similar to Indonesians are Immigrants from Malaysia (18.3%, a difference of 0.040%), Sierra Leonean (18.3%, a difference of 0.23%), Immigrants from Honduras (18.2%, a difference of 0.23%), Immigrants from Middle Africa (18.2%, a difference of 0.24%), and Immigrants from China (18.2%, a difference of 0.36%).
| Demographics | Rating | Rank | 3 or more Vehicles in Household |
| Immigrants | Western Asia | 4.8 /100 | #230 | Tragic 18.4% |
| Immigrants | Belgium | 4.8 /100 | #231 | Tragic 18.4% |
| Immigrants | Uganda | 4.6 /100 | #232 | Tragic 18.4% |
| Hondurans | 4.6 /100 | #233 | Tragic 18.4% |
| Immigrants | North Macedonia | 4.4 /100 | #234 | Tragic 18.4% |
| Sierra Leoneans | 3.9 /100 | #235 | Tragic 18.3% |
| Immigrants | Malaysia | 3.6 /100 | #236 | Tragic 18.3% |
| Indonesians | 3.5 /100 | #237 | Tragic 18.3% |
| Immigrants | Honduras | 3.1 /100 | #238 | Tragic 18.2% |
| Immigrants | Middle Africa | 3.1 /100 | #239 | Tragic 18.2% |
| Immigrants | China | 2.9 /100 | #240 | Tragic 18.2% |
| Africans | 2.7 /100 | #241 | Tragic 18.2% |
| Hopi | 2.5 /100 | #242 | Tragic 18.2% |
| Immigrants | Europe | 2.4 /100 | #243 | Tragic 18.1% |
| Mongolians | 2.3 /100 | #244 | Tragic 18.1% |
Demographics Similar to Creek by 3 or more Vehicles in Household
In terms of 3 or more vehicles in household, the demographic groups most similar to Creek are British (21.9%, a difference of 0.030%), Alaskan Athabascan (21.9%, a difference of 0.18%), Bangladeshi (21.9%, a difference of 0.19%), Potawatomi (21.9%, a difference of 0.20%), and Portuguese (21.8%, a difference of 0.38%).
| Demographics | Rating | Rank | 3 or more Vehicles in Household |
| Fijians | 99.9 /100 | #62 | Exceptional 22.2% |
| Chickasaw | 99.9 /100 | #63 | Exceptional 22.2% |
| Immigrants | Taiwan | 99.9 /100 | #64 | Exceptional 22.1% |
| Pima | 99.9 /100 | #65 | Exceptional 22.0% |
| Northern Europeans | 99.9 /100 | #66 | Exceptional 22.0% |
| Alaskan Athabascans | 99.9 /100 | #67 | Exceptional 21.9% |
| British | 99.9 /100 | #68 | Exceptional 21.9% |
| Creek | 99.9 /100 | #69 | Exceptional 21.9% |
| Bangladeshis | 99.8 /100 | #70 | Exceptional 21.9% |
| Potawatomi | 99.8 /100 | #71 | Exceptional 21.9% |
| Portuguese | 99.8 /100 | #72 | Exceptional 21.8% |
| Salvadorans | 99.8 /100 | #73 | Exceptional 21.8% |
| Immigrants | Oceania | 99.8 /100 | #74 | Exceptional 21.8% |
| Japanese | 99.8 /100 | #75 | Exceptional 21.8% |
| Immigrants | Nonimmigrants | 99.8 /100 | #76 | Exceptional 21.8% |