Yuman vs Inupiat 3 or more Vehicles in Household
COMPARE
Yuman
Inupiat
3 or more Vehicles in Household
3 or more Vehicles in Household Comparison
Yuman
Inupiat
19.9%
3 OR MORE VEHICLES IN HOUSEHOLD
75.6/ 100
METRIC RATING
153rd/ 347
METRIC RANK
16.9%
3 OR MORE VEHICLES IN HOUSEHOLD
0.1/ 100
METRIC RATING
296th/ 347
METRIC RANK
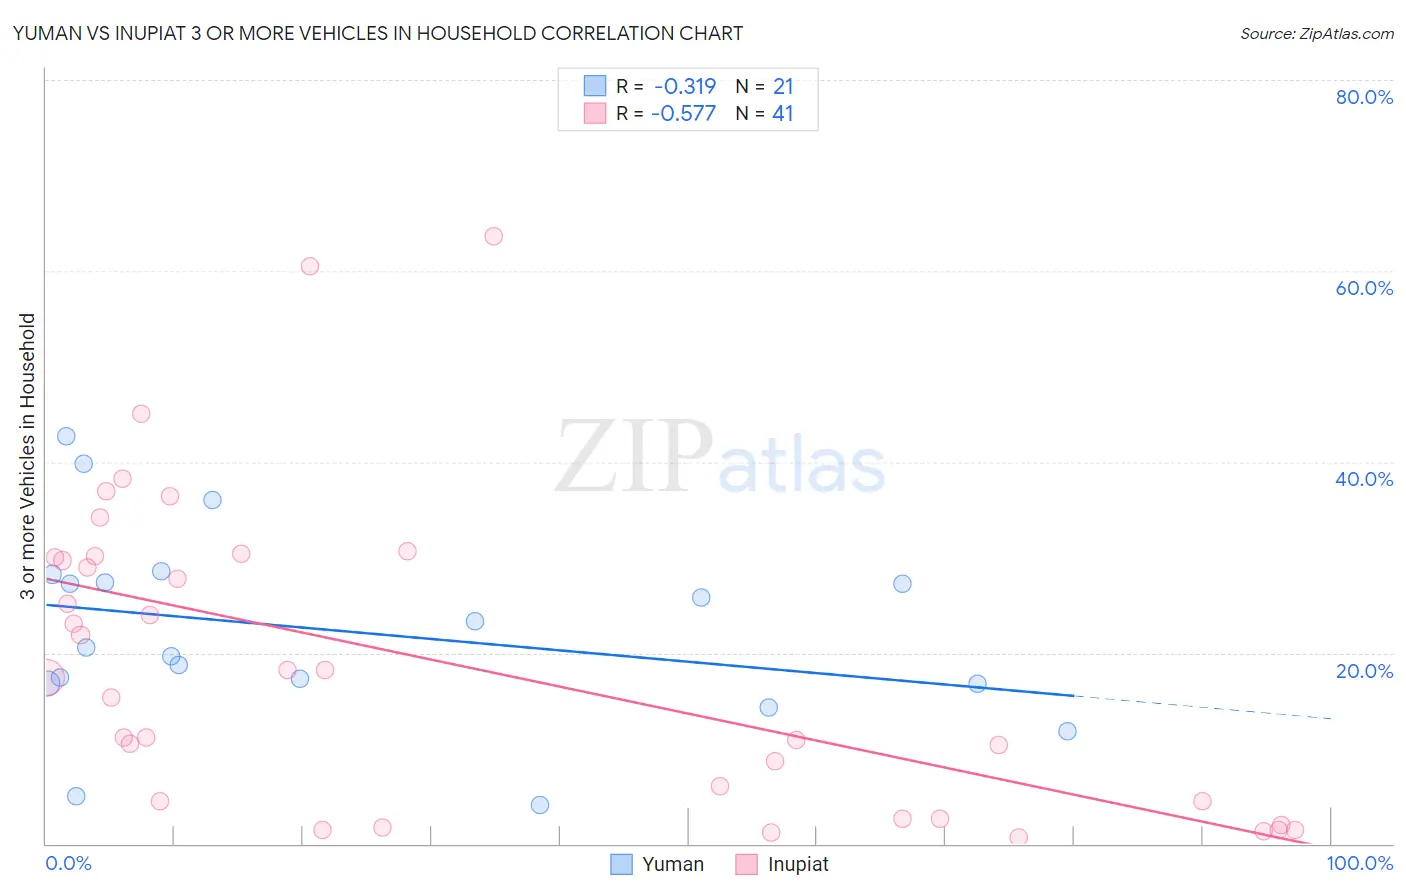
Yuman vs Inupiat 3 or more Vehicles in Household Correlation Chart
The statistical analysis conducted on geographies consisting of 40,662,835 people shows a mild negative correlation between the proportion of Yuman and percentage of households with 3 or more vehicles available in the United States with a correlation coefficient (R) of -0.319 and weighted average of 19.9%. Similarly, the statistical analysis conducted on geographies consisting of 96,277,833 people shows a substantial negative correlation between the proportion of Inupiat and percentage of households with 3 or more vehicles available in the United States with a correlation coefficient (R) of -0.577 and weighted average of 16.9%, a difference of 18.2%.
3 or more Vehicles in Household Correlation Summary
| Measurement | Yuman | Inupiat |
| Minimum | 4.1% | 0.71% |
| Maximum | 42.7% | 63.6% |
| Range | 38.7% | 62.9% |
| Mean | 22.3% | 19.0% |
| Median | 20.5% | 17.4% |
| Interquartile 25% (IQ1) | 16.7% | 3.5% |
| Interquartile 75% (IQ3) | 27.8% | 30.0% |
| Interquartile Range (IQR) | 11.1% | 26.5% |
| Standard Deviation (Sample) | 10.0% | 16.3% |
| Standard Deviation (Population) | 9.8% | 16.1% |
Similar Demographics by 3 or more Vehicles in Household
Demographics Similar to Yuman by 3 or more Vehicles in Household
In terms of 3 or more vehicles in household, the demographic groups most similar to Yuman are Immigrants from Jordan (19.9%, a difference of 0.060%), Tlingit-Haida (19.9%, a difference of 0.22%), Thai (19.8%, a difference of 0.43%), Lebanese (20.0%, a difference of 0.44%), and Hungarian (19.8%, a difference of 0.48%).
| Demographics | Rating | Rank | 3 or more Vehicles in Household |
| Australians | 83.6 /100 | #146 | Excellent 20.1% |
| Slovaks | 83.0 /100 | #147 | Excellent 20.1% |
| Guatemalans | 82.6 /100 | #148 | Excellent 20.1% |
| Immigrants | Iran | 80.9 /100 | #149 | Excellent 20.0% |
| Immigrants | Immigrants | 80.8 /100 | #150 | Excellent 20.0% |
| Taiwanese | 80.6 /100 | #151 | Excellent 20.0% |
| Lebanese | 79.8 /100 | #152 | Good 20.0% |
| Yuman | 75.6 /100 | #153 | Good 19.9% |
| Immigrants | Jordan | 75.0 /100 | #154 | Good 19.9% |
| Tlingit-Haida | 73.4 /100 | #155 | Good 19.9% |
| Thais | 71.1 /100 | #156 | Good 19.8% |
| Hungarians | 70.5 /100 | #157 | Good 19.8% |
| Armenians | 68.8 /100 | #158 | Good 19.8% |
| Immigrants | Pakistan | 68.2 /100 | #159 | Good 19.8% |
| Immigrants | Lebanon | 67.6 /100 | #160 | Good 19.8% |
Demographics Similar to Inupiat by 3 or more Vehicles in Household
In terms of 3 or more vehicles in household, the demographic groups most similar to Inupiat are Immigrants from Russia (16.9%, a difference of 0.36%), Immigrants from Western Africa (16.9%, a difference of 0.41%), Israeli (16.8%, a difference of 0.47%), Bahamian (16.9%, a difference of 0.52%), and Immigrants from Spain (17.0%, a difference of 0.60%).
| Demographics | Rating | Rank | 3 or more Vehicles in Household |
| Immigrants | Liberia | 0.1 /100 | #289 | Tragic 17.1% |
| Liberians | 0.1 /100 | #290 | Tragic 17.0% |
| Immigrants | Congo | 0.1 /100 | #291 | Tragic 17.0% |
| Immigrants | Spain | 0.1 /100 | #292 | Tragic 17.0% |
| Bahamians | 0.1 /100 | #293 | Tragic 16.9% |
| Immigrants | Western Africa | 0.1 /100 | #294 | Tragic 16.9% |
| Immigrants | Russia | 0.1 /100 | #295 | Tragic 16.9% |
| Inupiat | 0.1 /100 | #296 | Tragic 16.9% |
| Israelis | 0.1 /100 | #297 | Tragic 16.8% |
| Immigrants | Zaire | 0.1 /100 | #298 | Tragic 16.7% |
| Immigrants | South America | 0.1 /100 | #299 | Tragic 16.7% |
| Cypriots | 0.0 /100 | #300 | Tragic 16.6% |
| Paraguayans | 0.0 /100 | #301 | Tragic 16.6% |
| Immigrants | Greece | 0.0 /100 | #302 | Tragic 16.5% |
| Immigrants | Serbia | 0.0 /100 | #303 | Tragic 16.4% |