Immigrants from Peru vs Creek 3 or more Vehicles in Household
COMPARE
Immigrants from Peru
Creek
3 or more Vehicles in Household
3 or more Vehicles in Household Comparison
Immigrants from Peru
Creek
19.4%
3 OR MORE VEHICLES IN HOUSEHOLD
41.1/ 100
METRIC RATING
177th/ 347
METRIC RANK
21.9%
3 OR MORE VEHICLES IN HOUSEHOLD
99.9/ 100
METRIC RATING
69th/ 347
METRIC RANK
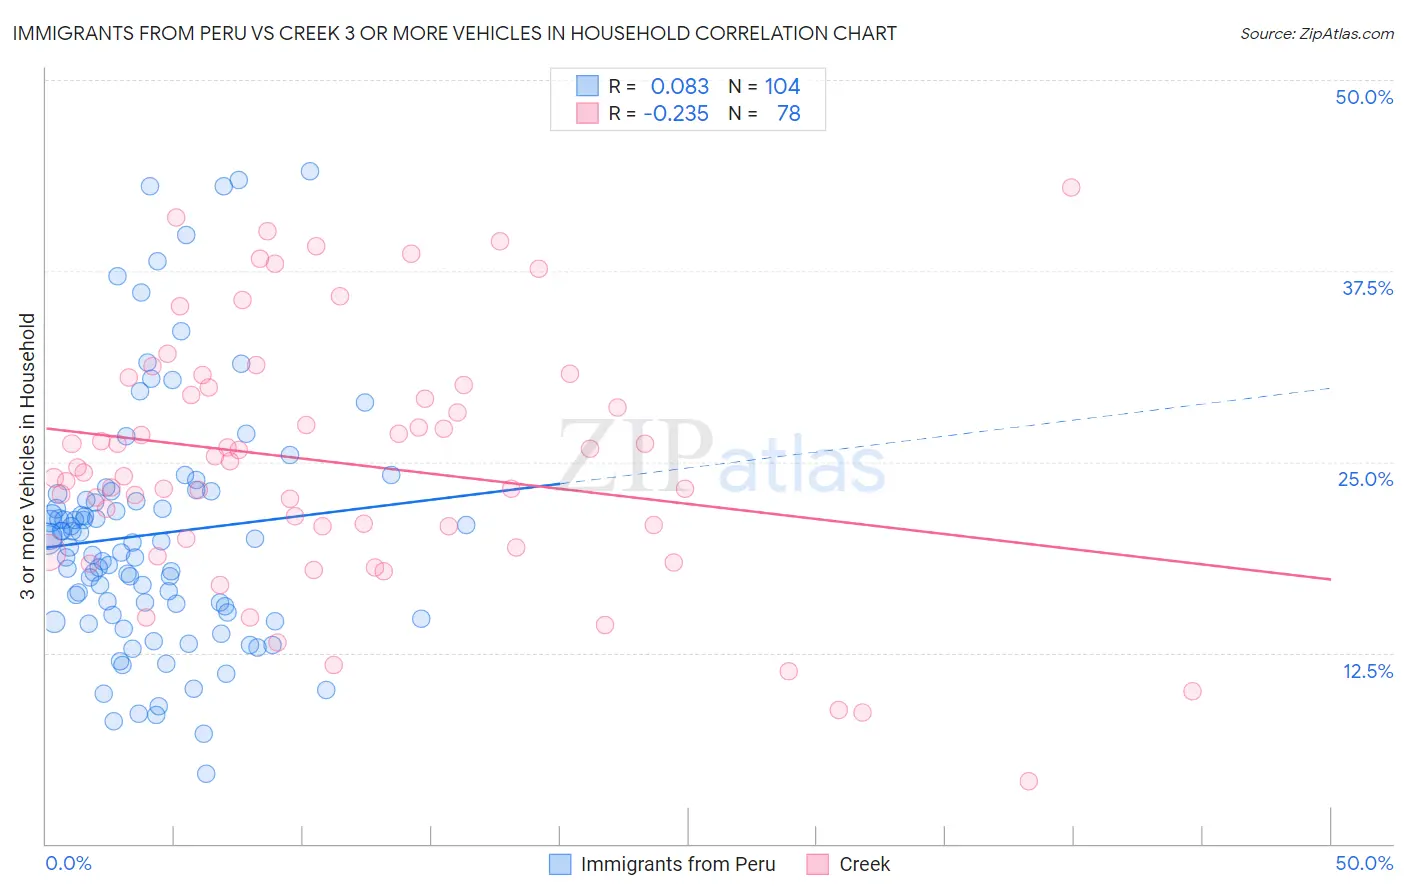
Immigrants from Peru vs Creek 3 or more Vehicles in Household Correlation Chart
The statistical analysis conducted on geographies consisting of 328,696,716 people shows a slight positive correlation between the proportion of Immigrants from Peru and percentage of households with 3 or more vehicles available in the United States with a correlation coefficient (R) of 0.083 and weighted average of 19.4%. Similarly, the statistical analysis conducted on geographies consisting of 178,435,403 people shows a weak negative correlation between the proportion of Creek and percentage of households with 3 or more vehicles available in the United States with a correlation coefficient (R) of -0.235 and weighted average of 21.9%, a difference of 13.1%.
3 or more Vehicles in Household Correlation Summary
| Measurement | Immigrants from Peru | Creek |
| Minimum | 4.5% | 4.1% |
| Maximum | 44.1% | 43.0% |
| Range | 39.5% | 38.9% |
| Mean | 20.3% | 24.9% |
| Median | 19.5% | 24.5% |
| Interquartile 25% (IQ1) | 15.0% | 20.0% |
| Interquartile 75% (IQ3) | 22.7% | 29.9% |
| Interquartile Range (IQR) | 7.7% | 9.9% |
| Standard Deviation (Sample) | 8.1% | 8.2% |
| Standard Deviation (Population) | 8.1% | 8.2% |
Similar Demographics by 3 or more Vehicles in Household
Demographics Similar to Immigrants from Peru by 3 or more Vehicles in Household
In terms of 3 or more vehicles in household, the demographic groups most similar to Immigrants from Peru are Immigrants from Syria (19.4%, a difference of 0.070%), Immigrants from South Central Asia (19.3%, a difference of 0.17%), South African (19.3%, a difference of 0.29%), Romanian (19.3%, a difference of 0.32%), and Cuban (19.3%, a difference of 0.36%).
| Demographics | Rating | Rank | 3 or more Vehicles in Household |
| Iraqis | 56.0 /100 | #170 | Average 19.6% |
| Immigrants | Western Europe | 53.2 /100 | #171 | Average 19.5% |
| Kiowa | 50.9 /100 | #172 | Average 19.5% |
| Immigrants | Northern Europe | 50.2 /100 | #173 | Average 19.5% |
| Immigrants | South Africa | 50.0 /100 | #174 | Average 19.5% |
| Syrians | 47.0 /100 | #175 | Average 19.5% |
| Iroquois | 46.0 /100 | #176 | Average 19.4% |
| Immigrants | Peru | 41.1 /100 | #177 | Average 19.4% |
| Immigrants | Syria | 40.3 /100 | #178 | Average 19.4% |
| Immigrants | South Central Asia | 38.9 /100 | #179 | Fair 19.3% |
| South Africans | 37.5 /100 | #180 | Fair 19.3% |
| Romanians | 37.1 /100 | #181 | Fair 19.3% |
| Cubans | 36.6 /100 | #182 | Fair 19.3% |
| Cajuns | 36.0 /100 | #183 | Fair 19.3% |
| Latvians | 35.7 /100 | #184 | Fair 19.3% |
Demographics Similar to Creek by 3 or more Vehicles in Household
In terms of 3 or more vehicles in household, the demographic groups most similar to Creek are British (21.9%, a difference of 0.030%), Alaskan Athabascan (21.9%, a difference of 0.18%), Bangladeshi (21.9%, a difference of 0.19%), Potawatomi (21.9%, a difference of 0.20%), and Portuguese (21.8%, a difference of 0.38%).
| Demographics | Rating | Rank | 3 or more Vehicles in Household |
| Fijians | 99.9 /100 | #62 | Exceptional 22.2% |
| Chickasaw | 99.9 /100 | #63 | Exceptional 22.2% |
| Immigrants | Taiwan | 99.9 /100 | #64 | Exceptional 22.1% |
| Pima | 99.9 /100 | #65 | Exceptional 22.0% |
| Northern Europeans | 99.9 /100 | #66 | Exceptional 22.0% |
| Alaskan Athabascans | 99.9 /100 | #67 | Exceptional 21.9% |
| British | 99.9 /100 | #68 | Exceptional 21.9% |
| Creek | 99.9 /100 | #69 | Exceptional 21.9% |
| Bangladeshis | 99.8 /100 | #70 | Exceptional 21.9% |
| Potawatomi | 99.8 /100 | #71 | Exceptional 21.9% |
| Portuguese | 99.8 /100 | #72 | Exceptional 21.8% |
| Salvadorans | 99.8 /100 | #73 | Exceptional 21.8% |
| Immigrants | Oceania | 99.8 /100 | #74 | Exceptional 21.8% |
| Japanese | 99.8 /100 | #75 | Exceptional 21.8% |
| Immigrants | Nonimmigrants | 99.8 /100 | #76 | Exceptional 21.8% |