Yuman vs Creek Disability Age 18 to 34
COMPARE
Yuman
Creek
Disability Age 18 to 34
Disability Age 18 to 34 Comparison
Yuman
Creek
10.6%
DISABILITY AGE 18 TO 34
0.0/ 100
METRIC RATING
347th/ 347
METRIC RANK
9.0%
DISABILITY AGE 18 TO 34
0.0/ 100
METRIC RATING
344th/ 347
METRIC RANK
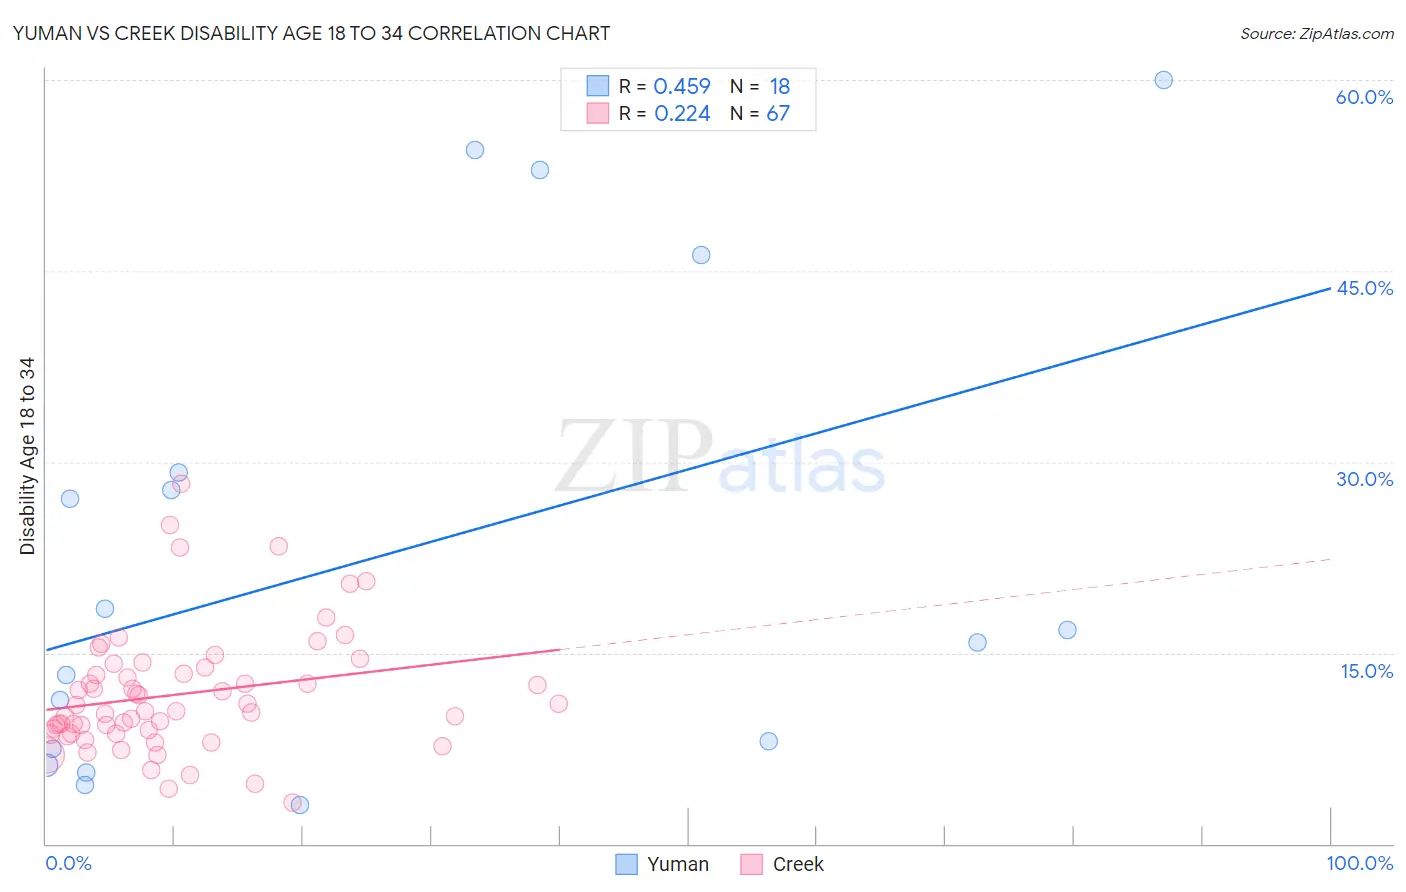
Yuman vs Creek Disability Age 18 to 34 Correlation Chart
The statistical analysis conducted on geographies consisting of 40,657,868 people shows a moderate positive correlation between the proportion of Yuman and percentage of population with a disability between the ages 18 and 35 in the United States with a correlation coefficient (R) of 0.459 and weighted average of 10.6%. Similarly, the statistical analysis conducted on geographies consisting of 178,234,058 people shows a weak positive correlation between the proportion of Creek and percentage of population with a disability between the ages 18 and 35 in the United States with a correlation coefficient (R) of 0.224 and weighted average of 9.0%, a difference of 17.1%.
Disability Age 18 to 34 Correlation Summary
| Measurement | Yuman | Creek |
| Minimum | 3.0% | 3.3% |
| Maximum | 60.0% | 28.3% |
| Range | 57.0% | 25.0% |
| Mean | 22.7% | 11.8% |
| Median | 16.3% | 10.4% |
| Interquartile 25% (IQ1) | 7.4% | 8.6% |
| Interquartile 75% (IQ3) | 29.2% | 13.9% |
| Interquartile Range (IQR) | 21.8% | 5.2% |
| Standard Deviation (Sample) | 18.8% | 4.8% |
| Standard Deviation (Population) | 18.3% | 4.8% |
Demographics Similar to Yuman and Creek by Disability Age 18 to 34
In terms of disability age 18 to 34, the demographic groups most similar to Yuman are Houma (9.7%, a difference of 8.9%), Alaskan Athabascan (9.4%, a difference of 11.8%), Chippewa (9.0%, a difference of 17.6%), Yakama (9.0%, a difference of 17.6%), and Chickasaw (9.0%, a difference of 17.6%). Similarly, the demographic groups most similar to Creek are Chippewa (9.0%, a difference of 0.38%), Yakama (9.0%, a difference of 0.39%), Chickasaw (9.0%, a difference of 0.45%), Choctaw (9.0%, a difference of 0.53%), and Kiowa (8.8%, a difference of 2.0%).
| Demographics | Rating | Rank | Disability Age 18 to 34 |
| Delaware | 0.0 /100 | #328 | Tragic 8.2% |
| Crow | 0.0 /100 | #329 | Tragic 8.3% |
| Osage | 0.0 /100 | #330 | Tragic 8.3% |
| Comanche | 0.0 /100 | #331 | Tragic 8.3% |
| Puget Sound Salish | 0.0 /100 | #332 | Tragic 8.3% |
| Apache | 0.0 /100 | #333 | Tragic 8.4% |
| Dutch West Indians | 0.0 /100 | #334 | Tragic 8.4% |
| Seminole | 0.0 /100 | #335 | Tragic 8.4% |
| Immigrants | Azores | 0.0 /100 | #336 | Tragic 8.5% |
| Ottawa | 0.0 /100 | #337 | Tragic 8.6% |
| Cherokee | 0.0 /100 | #338 | Tragic 8.7% |
| Kiowa | 0.0 /100 | #339 | Tragic 8.8% |
| Choctaw | 0.0 /100 | #340 | Tragic 9.0% |
| Chickasaw | 0.0 /100 | #341 | Tragic 9.0% |
| Yakama | 0.0 /100 | #342 | Tragic 9.0% |
| Chippewa | 0.0 /100 | #343 | Tragic 9.0% |
| Creek | 0.0 /100 | #344 | Tragic 9.0% |
| Alaskan Athabascans | 0.0 /100 | #345 | Tragic 9.4% |
| Houma | 0.0 /100 | #346 | Tragic 9.7% |
| Yuman | 0.0 /100 | #347 | Tragic 10.6% |