Tsimshian vs Immigrants from Lithuania 4 or more Vehicles in Household
COMPARE
Tsimshian
Immigrants from Lithuania
4 or more Vehicles in Household
4 or more Vehicles in Household Comparison
Tsimshian
Immigrants from Lithuania
6.2%
4 OR MORE VEHICLES IN HOUSEHOLD
26.4/ 100
METRIC RATING
196th/ 347
METRIC RANK
5.6%
4 OR MORE VEHICLES IN HOUSEHOLD
1.4/ 100
METRIC RATING
258th/ 347
METRIC RANK
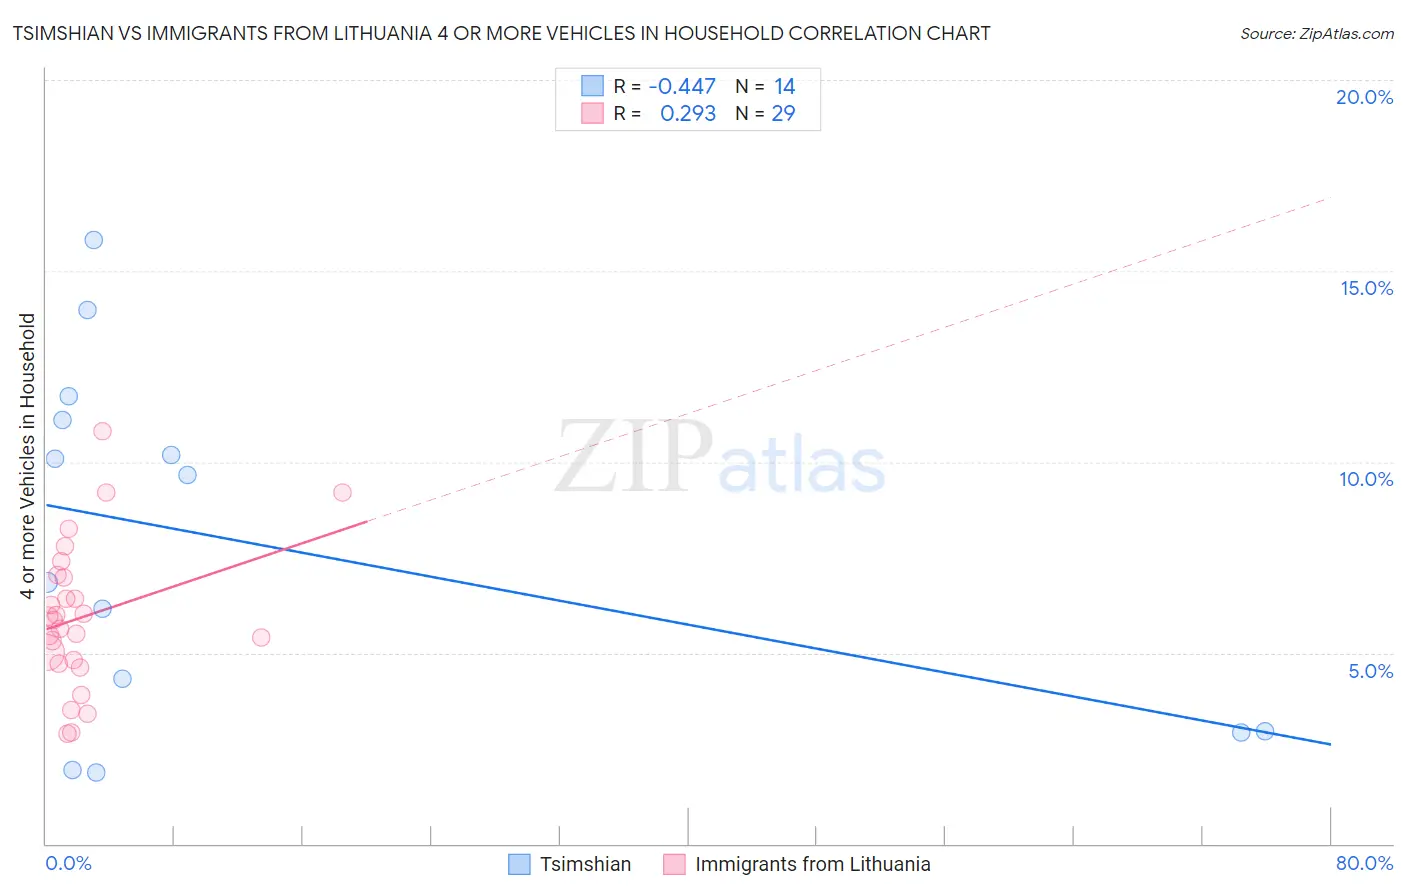
Tsimshian vs Immigrants from Lithuania 4 or more Vehicles in Household Correlation Chart
The statistical analysis conducted on geographies consisting of 15,625,888 people shows a moderate negative correlation between the proportion of Tsimshian and percentage of households with 4 or more vehicles available in the United States with a correlation coefficient (R) of -0.447 and weighted average of 6.2%. Similarly, the statistical analysis conducted on geographies consisting of 117,416,675 people shows a weak positive correlation between the proportion of Immigrants from Lithuania and percentage of households with 4 or more vehicles available in the United States with a correlation coefficient (R) of 0.293 and weighted average of 5.6%, a difference of 9.2%.
4 or more Vehicles in Household Correlation Summary
| Measurement | Tsimshian | Immigrants from Lithuania |
| Minimum | 1.9% | 2.9% |
| Maximum | 15.8% | 10.8% |
| Range | 14.0% | 7.9% |
| Mean | 7.8% | 6.0% |
| Median | 8.2% | 5.8% |
| Interquartile 25% (IQ1) | 2.9% | 4.8% |
| Interquartile 75% (IQ3) | 11.1% | 7.0% |
| Interquartile Range (IQR) | 8.2% | 2.2% |
| Standard Deviation (Sample) | 4.6% | 1.9% |
| Standard Deviation (Population) | 4.4% | 1.9% |
Similar Demographics by 4 or more Vehicles in Household
Demographics Similar to Tsimshian by 4 or more Vehicles in Household
In terms of 4 or more vehicles in household, the demographic groups most similar to Tsimshian are Immigrants from Sweden (6.2%, a difference of 0.070%), Argentinean (6.2%, a difference of 0.070%), Immigrants from Kuwait (6.2%, a difference of 0.20%), Immigrants from Sri Lanka (6.1%, a difference of 0.38%), and Romanian (6.2%, a difference of 0.54%).
| Demographics | Rating | Rank | 4 or more Vehicles in Household |
| Immigrants | Eastern Asia | 33.3 /100 | #189 | Fair 6.2% |
| South Africans | 32.2 /100 | #190 | Fair 6.2% |
| Inupiat | 30.7 /100 | #191 | Fair 6.2% |
| Romanians | 30.7 /100 | #192 | Fair 6.2% |
| Immigrants | Kuwait | 28.0 /100 | #193 | Fair 6.2% |
| Immigrants | Sweden | 27.0 /100 | #194 | Fair 6.2% |
| Argentineans | 27.0 /100 | #195 | Fair 6.2% |
| Tsimshian | 26.4 /100 | #196 | Fair 6.2% |
| Immigrants | Sri Lanka | 23.7 /100 | #197 | Fair 6.1% |
| Immigrants | Portugal | 22.3 /100 | #198 | Fair 6.1% |
| Immigrants | Norway | 21.8 /100 | #199 | Fair 6.1% |
| Latvians | 21.7 /100 | #200 | Fair 6.1% |
| Egyptians | 21.4 /100 | #201 | Fair 6.1% |
| Immigrants | South Central Asia | 21.3 /100 | #202 | Fair 6.1% |
| Immigrants | Sierra Leone | 20.5 /100 | #203 | Fair 6.1% |
Demographics Similar to Immigrants from Lithuania by 4 or more Vehicles in Household
In terms of 4 or more vehicles in household, the demographic groups most similar to Immigrants from Lithuania are Immigrants from France (5.6%, a difference of 0.030%), Immigrants from Northern Africa (5.6%, a difference of 0.14%), Immigrants from Turkey (5.7%, a difference of 0.22%), Uruguayan (5.6%, a difference of 0.22%), and Yup'ik (5.7%, a difference of 0.25%).
| Demographics | Rating | Rank | 4 or more Vehicles in Household |
| Ugandans | 2.2 /100 | #251 | Tragic 5.7% |
| Sub-Saharan Africans | 2.1 /100 | #252 | Tragic 5.7% |
| Immigrants | Cuba | 1.6 /100 | #253 | Tragic 5.7% |
| Immigrants | Panama | 1.5 /100 | #254 | Tragic 5.7% |
| Yup'ik | 1.5 /100 | #255 | Tragic 5.7% |
| Immigrants | Turkey | 1.5 /100 | #256 | Tragic 5.7% |
| Immigrants | Northern Africa | 1.4 /100 | #257 | Tragic 5.6% |
| Immigrants | Lithuania | 1.4 /100 | #258 | Tragic 5.6% |
| Immigrants | France | 1.3 /100 | #259 | Tragic 5.6% |
| Uruguayans | 1.3 /100 | #260 | Tragic 5.6% |
| Sudanese | 1.2 /100 | #261 | Tragic 5.6% |
| Bermudans | 1.2 /100 | #262 | Tragic 5.6% |
| Immigrants | Saudi Arabia | 1.1 /100 | #263 | Tragic 5.6% |
| Immigrants | Africa | 1.0 /100 | #264 | Tragic 5.6% |
| South Americans | 0.9 /100 | #265 | Tragic 5.6% |