Tsimshian vs Immigrants from Sri Lanka 4 or more Vehicles in Household
COMPARE
Tsimshian
Immigrants from Sri Lanka
4 or more Vehicles in Household
4 or more Vehicles in Household Comparison
Tsimshian
Immigrants from Sri Lanka
6.2%
4 OR MORE VEHICLES IN HOUSEHOLD
26.4/ 100
METRIC RATING
196th/ 347
METRIC RANK
6.1%
4 OR MORE VEHICLES IN HOUSEHOLD
23.7/ 100
METRIC RATING
197th/ 347
METRIC RANK
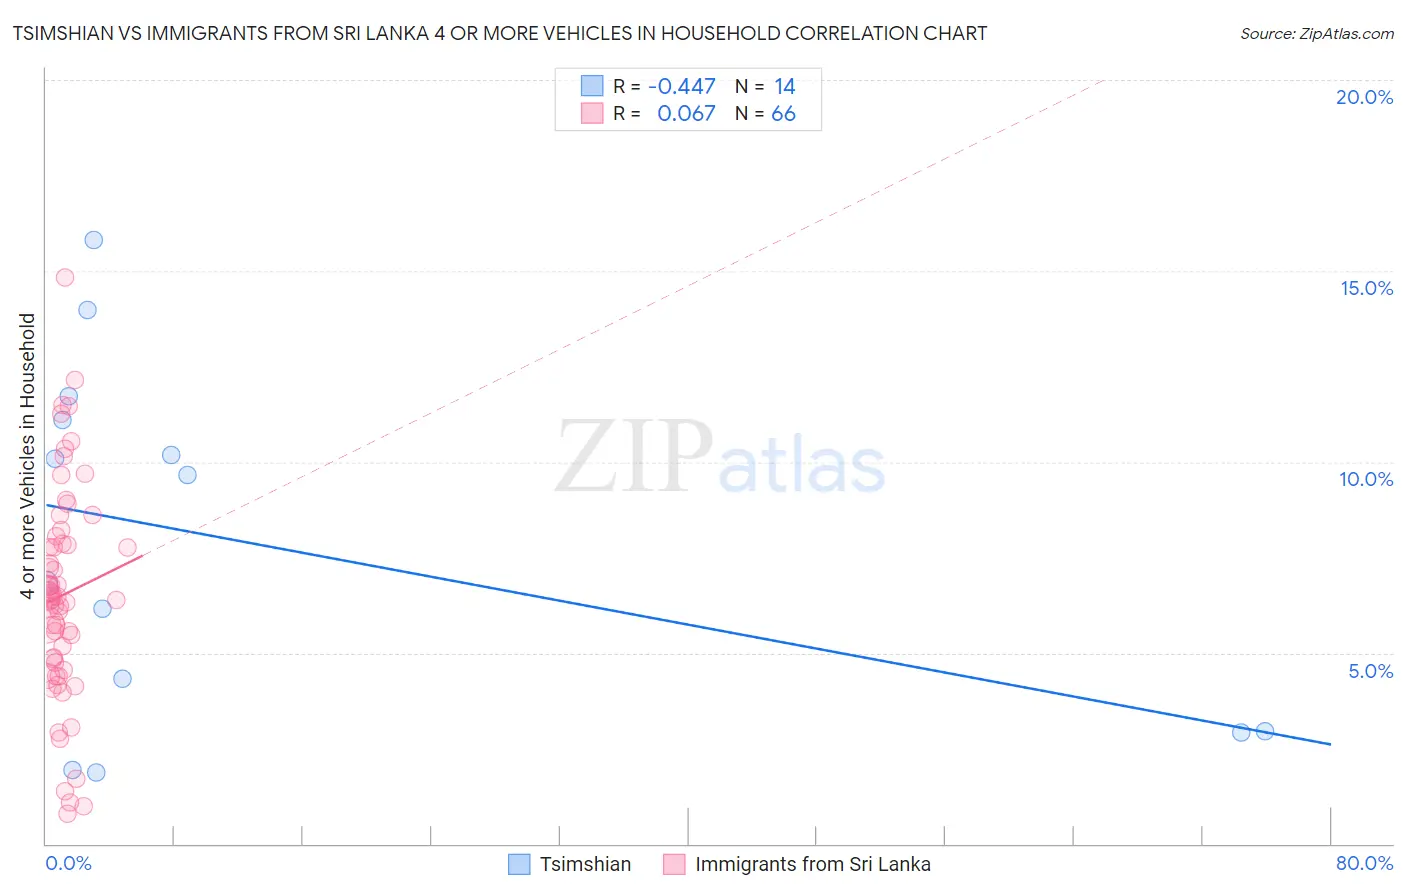
Tsimshian vs Immigrants from Sri Lanka 4 or more Vehicles in Household Correlation Chart
The statistical analysis conducted on geographies consisting of 15,625,888 people shows a moderate negative correlation between the proportion of Tsimshian and percentage of households with 4 or more vehicles available in the United States with a correlation coefficient (R) of -0.447 and weighted average of 6.2%. Similarly, the statistical analysis conducted on geographies consisting of 149,309,194 people shows a slight positive correlation between the proportion of Immigrants from Sri Lanka and percentage of households with 4 or more vehicles available in the United States with a correlation coefficient (R) of 0.067 and weighted average of 6.1%, a difference of 0.38%.
4 or more Vehicles in Household Correlation Summary
| Measurement | Tsimshian | Immigrants from Sri Lanka |
| Minimum | 1.9% | 0.78% |
| Maximum | 15.8% | 14.8% |
| Range | 14.0% | 14.0% |
| Mean | 7.8% | 6.5% |
| Median | 8.2% | 6.4% |
| Interquartile 25% (IQ1) | 2.9% | 4.7% |
| Interquartile 75% (IQ3) | 11.1% | 7.9% |
| Interquartile Range (IQR) | 8.2% | 3.1% |
| Standard Deviation (Sample) | 4.6% | 2.8% |
| Standard Deviation (Population) | 4.4% | 2.8% |
Demographics Similar to Tsimshian and Immigrants from Sri Lanka by 4 or more Vehicles in Household
In terms of 4 or more vehicles in household, the demographic groups most similar to Tsimshian are Immigrants from Sweden (6.2%, a difference of 0.070%), Argentinean (6.2%, a difference of 0.070%), Immigrants from Kuwait (6.2%, a difference of 0.20%), Romanian (6.2%, a difference of 0.54%), and Inupiat (6.2%, a difference of 0.55%). Similarly, the demographic groups most similar to Immigrants from Sri Lanka are Immigrants from Portugal (6.1%, a difference of 0.20%), Immigrants from Norway (6.1%, a difference of 0.29%), Latvian (6.1%, a difference of 0.29%), Egyptian (6.1%, a difference of 0.35%), and Immigrants from South Central Asia (6.1%, a difference of 0.36%).
| Demographics | Rating | Rank | 4 or more Vehicles in Household |
| Immigrants | Northern Europe | 36.8 /100 | #186 | Fair 6.2% |
| Immigrants | South Africa | 35.4 /100 | #187 | Fair 6.2% |
| Kiowa | 34.7 /100 | #188 | Fair 6.2% |
| Immigrants | Eastern Asia | 33.3 /100 | #189 | Fair 6.2% |
| South Africans | 32.2 /100 | #190 | Fair 6.2% |
| Inupiat | 30.7 /100 | #191 | Fair 6.2% |
| Romanians | 30.7 /100 | #192 | Fair 6.2% |
| Immigrants | Kuwait | 28.0 /100 | #193 | Fair 6.2% |
| Immigrants | Sweden | 27.0 /100 | #194 | Fair 6.2% |
| Argentineans | 27.0 /100 | #195 | Fair 6.2% |
| Tsimshian | 26.4 /100 | #196 | Fair 6.2% |
| Immigrants | Sri Lanka | 23.7 /100 | #197 | Fair 6.1% |
| Immigrants | Portugal | 22.3 /100 | #198 | Fair 6.1% |
| Immigrants | Norway | 21.8 /100 | #199 | Fair 6.1% |
| Latvians | 21.7 /100 | #200 | Fair 6.1% |
| Egyptians | 21.4 /100 | #201 | Fair 6.1% |
| Immigrants | South Central Asia | 21.3 /100 | #202 | Fair 6.1% |
| Immigrants | Sierra Leone | 20.5 /100 | #203 | Fair 6.1% |
| Immigrants | Belize | 19.8 /100 | #204 | Poor 6.1% |
| Hondurans | 19.3 /100 | #205 | Poor 6.1% |
| Kenyans | 18.5 /100 | #206 | Poor 6.1% |