Ghanaian vs Immigrants from Lithuania 4 or more Vehicles in Household
COMPARE
Ghanaian
Immigrants from Lithuania
4 or more Vehicles in Household
4 or more Vehicles in Household Comparison
Ghanaians
Immigrants from Lithuania
5.2%
4 OR MORE VEHICLES IN HOUSEHOLD
0.1/ 100
METRIC RATING
294th/ 347
METRIC RANK
5.6%
4 OR MORE VEHICLES IN HOUSEHOLD
1.4/ 100
METRIC RATING
258th/ 347
METRIC RANK
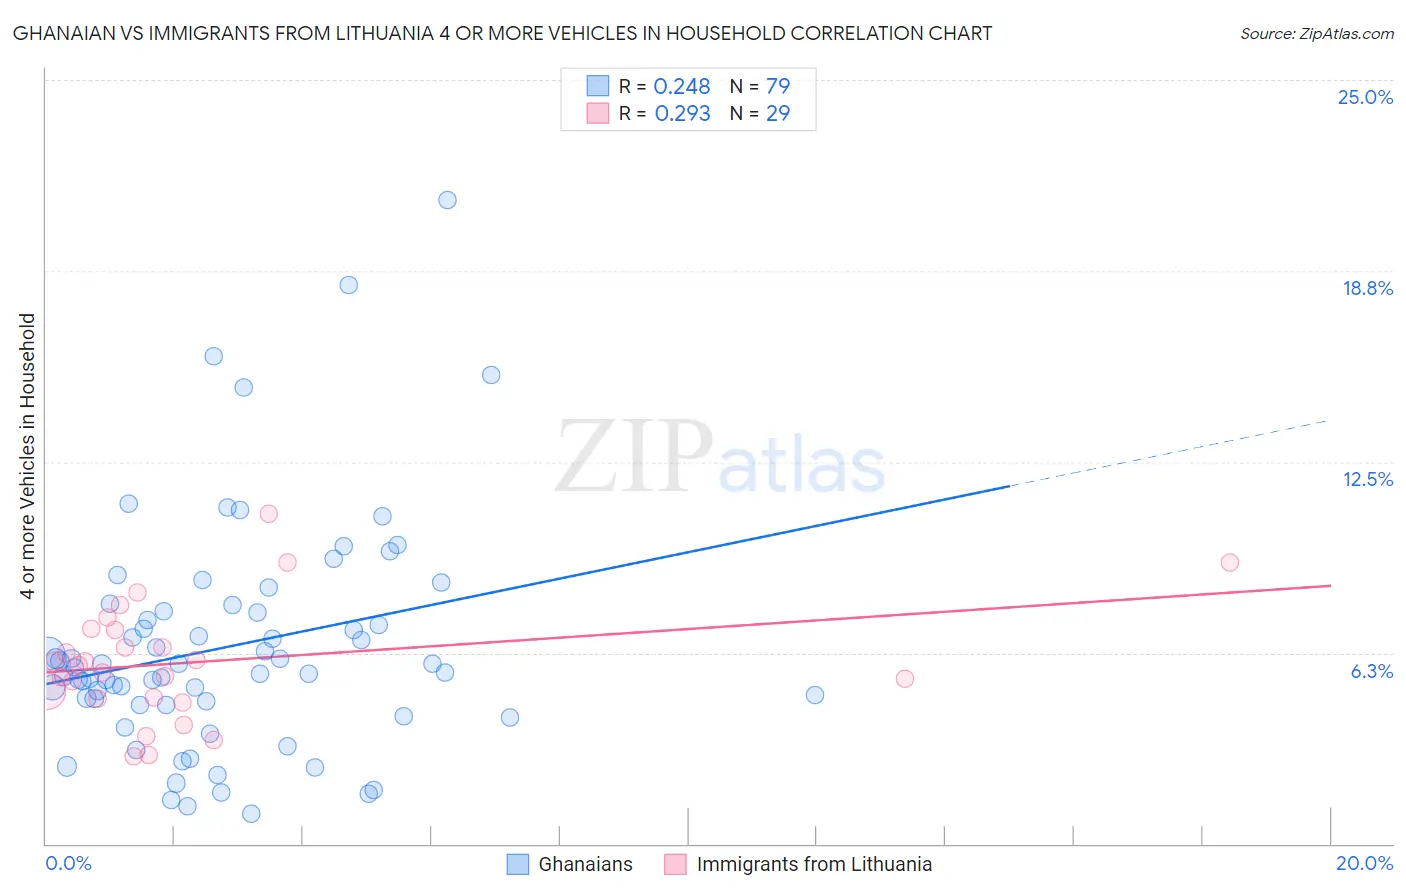
Ghanaian vs Immigrants from Lithuania 4 or more Vehicles in Household Correlation Chart
The statistical analysis conducted on geographies consisting of 189,616,639 people shows a weak positive correlation between the proportion of Ghanaians and percentage of households with 4 or more vehicles available in the United States with a correlation coefficient (R) of 0.248 and weighted average of 5.2%. Similarly, the statistical analysis conducted on geographies consisting of 117,416,675 people shows a weak positive correlation between the proportion of Immigrants from Lithuania and percentage of households with 4 or more vehicles available in the United States with a correlation coefficient (R) of 0.293 and weighted average of 5.6%, a difference of 7.5%.
4 or more Vehicles in Household Correlation Summary
| Measurement | Ghanaian | Immigrants from Lithuania |
| Minimum | 0.97% | 2.9% |
| Maximum | 21.1% | 10.8% |
| Range | 20.1% | 7.9% |
| Mean | 6.4% | 6.0% |
| Median | 5.8% | 5.8% |
| Interquartile 25% (IQ1) | 4.6% | 4.8% |
| Interquartile 75% (IQ3) | 7.6% | 7.0% |
| Interquartile Range (IQR) | 3.1% | 2.2% |
| Standard Deviation (Sample) | 3.7% | 1.9% |
| Standard Deviation (Population) | 3.7% | 1.9% |
Similar Demographics by 4 or more Vehicles in Household
Demographics Similar to Ghanaians by 4 or more Vehicles in Household
In terms of 4 or more vehicles in household, the demographic groups most similar to Ghanaians are Immigrants from Congo (5.2%, a difference of 0.050%), Liberian (5.3%, a difference of 0.090%), Immigrants from Brazil (5.2%, a difference of 0.11%), Immigrants from Bahamas (5.3%, a difference of 0.19%), and Israeli (5.2%, a difference of 0.29%).
| Demographics | Rating | Rank | 4 or more Vehicles in Household |
| Immigrants | Croatia | 0.2 /100 | #287 | Tragic 5.4% |
| Venezuelans | 0.2 /100 | #288 | Tragic 5.3% |
| Immigrants | Bosnia and Herzegovina | 0.2 /100 | #289 | Tragic 5.3% |
| Immigrants | Russia | 0.2 /100 | #290 | Tragic 5.3% |
| Immigrants | Bahamas | 0.1 /100 | #291 | Tragic 5.3% |
| Liberians | 0.1 /100 | #292 | Tragic 5.3% |
| Immigrants | Congo | 0.1 /100 | #293 | Tragic 5.2% |
| Ghanaians | 0.1 /100 | #294 | Tragic 5.2% |
| Immigrants | Brazil | 0.1 /100 | #295 | Tragic 5.2% |
| Israelis | 0.1 /100 | #296 | Tragic 5.2% |
| Immigrants | Venezuela | 0.1 /100 | #297 | Tragic 5.2% |
| Immigrants | South America | 0.1 /100 | #298 | Tragic 5.2% |
| Immigrants | Ghana | 0.1 /100 | #299 | Tragic 5.2% |
| Immigrants | Morocco | 0.0 /100 | #300 | Tragic 5.1% |
| Immigrants | Zaire | 0.0 /100 | #301 | Tragic 5.1% |
Demographics Similar to Immigrants from Lithuania by 4 or more Vehicles in Household
In terms of 4 or more vehicles in household, the demographic groups most similar to Immigrants from Lithuania are Immigrants from France (5.6%, a difference of 0.030%), Immigrants from Northern Africa (5.6%, a difference of 0.14%), Immigrants from Turkey (5.7%, a difference of 0.22%), Uruguayan (5.6%, a difference of 0.22%), and Yup'ik (5.7%, a difference of 0.25%).
| Demographics | Rating | Rank | 4 or more Vehicles in Household |
| Ugandans | 2.2 /100 | #251 | Tragic 5.7% |
| Sub-Saharan Africans | 2.1 /100 | #252 | Tragic 5.7% |
| Immigrants | Cuba | 1.6 /100 | #253 | Tragic 5.7% |
| Immigrants | Panama | 1.5 /100 | #254 | Tragic 5.7% |
| Yup'ik | 1.5 /100 | #255 | Tragic 5.7% |
| Immigrants | Turkey | 1.5 /100 | #256 | Tragic 5.7% |
| Immigrants | Northern Africa | 1.4 /100 | #257 | Tragic 5.6% |
| Immigrants | Lithuania | 1.4 /100 | #258 | Tragic 5.6% |
| Immigrants | France | 1.3 /100 | #259 | Tragic 5.6% |
| Uruguayans | 1.3 /100 | #260 | Tragic 5.6% |
| Sudanese | 1.2 /100 | #261 | Tragic 5.6% |
| Bermudans | 1.2 /100 | #262 | Tragic 5.6% |
| Immigrants | Saudi Arabia | 1.1 /100 | #263 | Tragic 5.6% |
| Immigrants | Africa | 1.0 /100 | #264 | Tragic 5.6% |
| South Americans | 0.9 /100 | #265 | Tragic 5.6% |