Tsimshian vs Immigrants from Morocco 4 or more Vehicles in Household
COMPARE
Tsimshian
Immigrants from Morocco
4 or more Vehicles in Household
4 or more Vehicles in Household Comparison
Tsimshian
Immigrants from Morocco
6.2%
4 OR MORE VEHICLES IN HOUSEHOLD
26.4/ 100
METRIC RATING
196th/ 347
METRIC RANK
5.1%
4 OR MORE VEHICLES IN HOUSEHOLD
0.0/ 100
METRIC RATING
300th/ 347
METRIC RANK
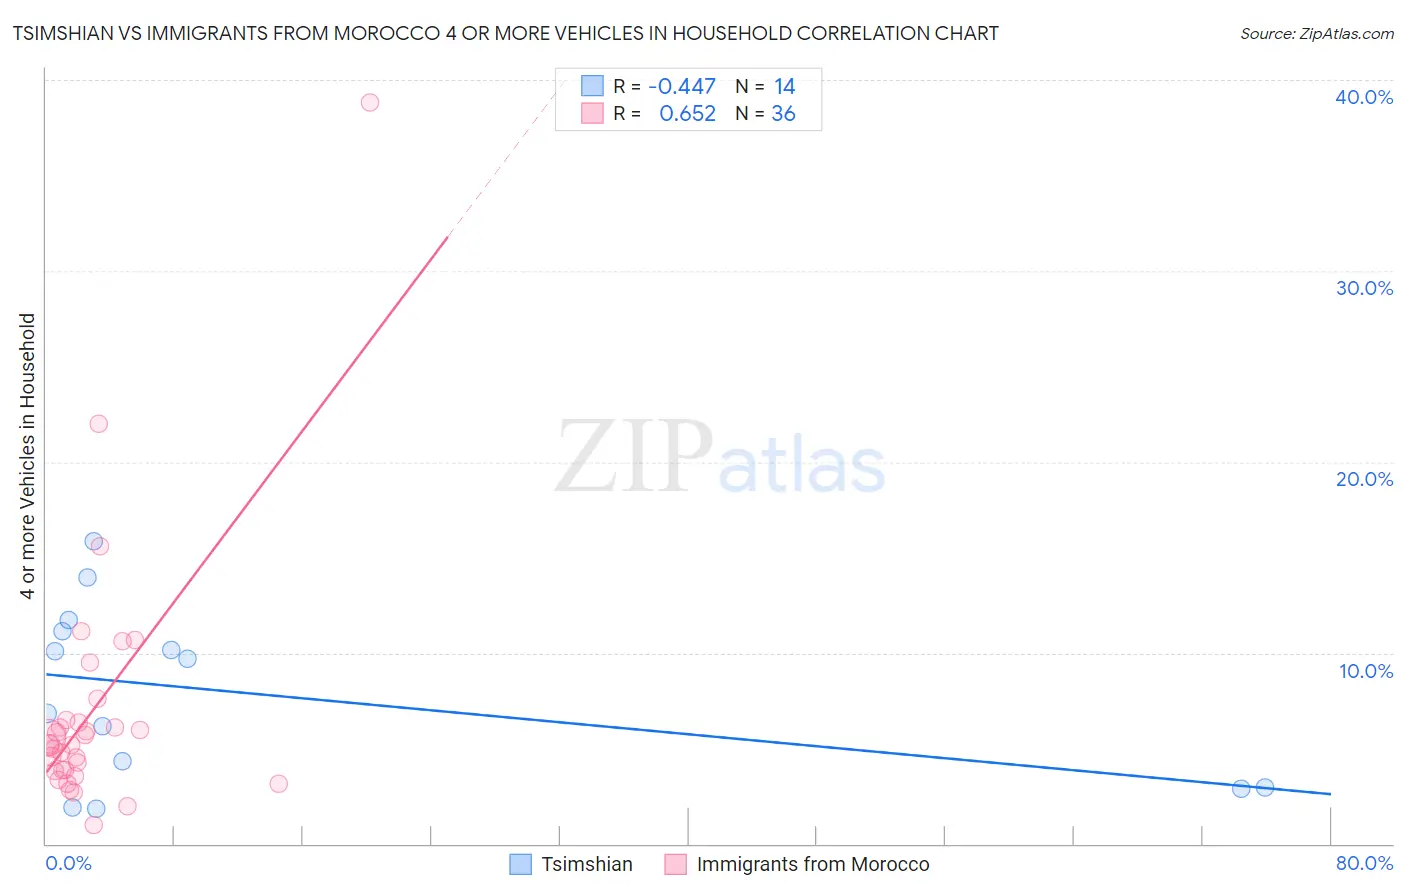
Tsimshian vs Immigrants from Morocco 4 or more Vehicles in Household Correlation Chart
The statistical analysis conducted on geographies consisting of 15,625,888 people shows a moderate negative correlation between the proportion of Tsimshian and percentage of households with 4 or more vehicles available in the United States with a correlation coefficient (R) of -0.447 and weighted average of 6.2%. Similarly, the statistical analysis conducted on geographies consisting of 178,286,205 people shows a significant positive correlation between the proportion of Immigrants from Morocco and percentage of households with 4 or more vehicles available in the United States with a correlation coefficient (R) of 0.652 and weighted average of 5.1%, a difference of 20.9%.
4 or more Vehicles in Household Correlation Summary
| Measurement | Tsimshian | Immigrants from Morocco |
| Minimum | 1.9% | 0.99% |
| Maximum | 15.8% | 38.8% |
| Range | 14.0% | 37.8% |
| Mean | 7.8% | 7.0% |
| Median | 8.2% | 5.2% |
| Interquartile 25% (IQ1) | 2.9% | 3.8% |
| Interquartile 75% (IQ3) | 11.1% | 6.4% |
| Interquartile Range (IQR) | 8.2% | 2.6% |
| Standard Deviation (Sample) | 4.6% | 6.7% |
| Standard Deviation (Population) | 4.4% | 6.6% |
Similar Demographics by 4 or more Vehicles in Household
Demographics Similar to Tsimshian by 4 or more Vehicles in Household
In terms of 4 or more vehicles in household, the demographic groups most similar to Tsimshian are Immigrants from Sweden (6.2%, a difference of 0.070%), Argentinean (6.2%, a difference of 0.070%), Immigrants from Kuwait (6.2%, a difference of 0.20%), Immigrants from Sri Lanka (6.1%, a difference of 0.38%), and Romanian (6.2%, a difference of 0.54%).
| Demographics | Rating | Rank | 4 or more Vehicles in Household |
| Immigrants | Eastern Asia | 33.3 /100 | #189 | Fair 6.2% |
| South Africans | 32.2 /100 | #190 | Fair 6.2% |
| Inupiat | 30.7 /100 | #191 | Fair 6.2% |
| Romanians | 30.7 /100 | #192 | Fair 6.2% |
| Immigrants | Kuwait | 28.0 /100 | #193 | Fair 6.2% |
| Immigrants | Sweden | 27.0 /100 | #194 | Fair 6.2% |
| Argentineans | 27.0 /100 | #195 | Fair 6.2% |
| Tsimshian | 26.4 /100 | #196 | Fair 6.2% |
| Immigrants | Sri Lanka | 23.7 /100 | #197 | Fair 6.1% |
| Immigrants | Portugal | 22.3 /100 | #198 | Fair 6.1% |
| Immigrants | Norway | 21.8 /100 | #199 | Fair 6.1% |
| Latvians | 21.7 /100 | #200 | Fair 6.1% |
| Egyptians | 21.4 /100 | #201 | Fair 6.1% |
| Immigrants | South Central Asia | 21.3 /100 | #202 | Fair 6.1% |
| Immigrants | Sierra Leone | 20.5 /100 | #203 | Fair 6.1% |
Demographics Similar to Immigrants from Morocco by 4 or more Vehicles in Household
In terms of 4 or more vehicles in household, the demographic groups most similar to Immigrants from Morocco are Immigrants from Zaire (5.1%, a difference of 0.080%), Bahamian (5.1%, a difference of 0.39%), Immigrants from Greece (5.1%, a difference of 0.86%), Cypriot (5.0%, a difference of 1.4%), and Somali (5.0%, a difference of 1.4%).
| Demographics | Rating | Rank | 4 or more Vehicles in Household |
| Immigrants | Congo | 0.1 /100 | #293 | Tragic 5.2% |
| Ghanaians | 0.1 /100 | #294 | Tragic 5.2% |
| Immigrants | Brazil | 0.1 /100 | #295 | Tragic 5.2% |
| Israelis | 0.1 /100 | #296 | Tragic 5.2% |
| Immigrants | Venezuela | 0.1 /100 | #297 | Tragic 5.2% |
| Immigrants | South America | 0.1 /100 | #298 | Tragic 5.2% |
| Immigrants | Ghana | 0.1 /100 | #299 | Tragic 5.2% |
| Immigrants | Morocco | 0.0 /100 | #300 | Tragic 5.1% |
| Immigrants | Zaire | 0.0 /100 | #301 | Tragic 5.1% |
| Bahamians | 0.0 /100 | #302 | Tragic 5.1% |
| Immigrants | Greece | 0.0 /100 | #303 | Tragic 5.1% |
| Cypriots | 0.0 /100 | #304 | Tragic 5.0% |
| Somalis | 0.0 /100 | #305 | Tragic 5.0% |
| Immigrants | Serbia | 0.0 /100 | #306 | Tragic 5.0% |
| Menominee | 0.0 /100 | #307 | Tragic 5.0% |