Tsimshian vs Immigrants from Lithuania Male Poverty
COMPARE
Tsimshian
Immigrants from Lithuania
Male Poverty
Male Poverty Comparison
Tsimshian
Immigrants from Lithuania
12.8%
MALE POVERTY
0.3/ 100
METRIC RATING
244th/ 347
METRIC RANK
9.4%
MALE POVERTY
99.9/ 100
METRIC RATING
13th/ 347
METRIC RANK
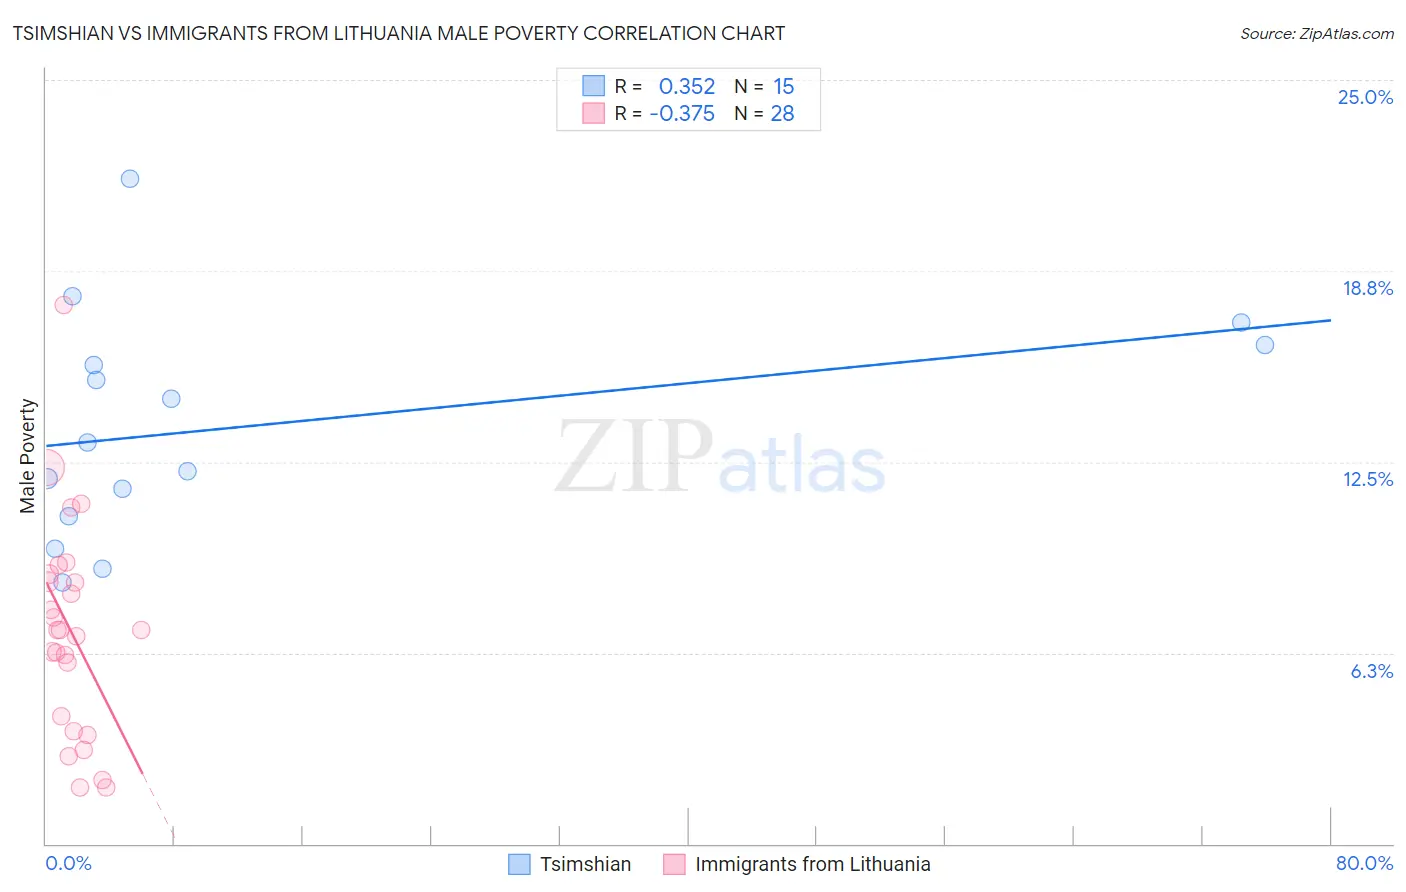
Tsimshian vs Immigrants from Lithuania Male Poverty Correlation Chart
The statistical analysis conducted on geographies consisting of 15,624,889 people shows a mild positive correlation between the proportion of Tsimshian and poverty level among males in the United States with a correlation coefficient (R) of 0.352 and weighted average of 12.8%. Similarly, the statistical analysis conducted on geographies consisting of 117,705,146 people shows a mild negative correlation between the proportion of Immigrants from Lithuania and poverty level among males in the United States with a correlation coefficient (R) of -0.375 and weighted average of 9.4%, a difference of 36.2%.
Male Poverty Correlation Summary
| Measurement | Tsimshian | Immigrants from Lithuania |
| Minimum | 8.5% | 1.8% |
| Maximum | 21.8% | 17.6% |
| Range | 13.2% | 15.8% |
| Mean | 13.7% | 7.0% |
| Median | 13.1% | 7.0% |
| Interquartile 25% (IQ1) | 10.7% | 3.9% |
| Interquartile 75% (IQ3) | 16.3% | 8.7% |
| Interquartile Range (IQR) | 5.6% | 4.8% |
| Standard Deviation (Sample) | 3.7% | 3.5% |
| Standard Deviation (Population) | 3.6% | 3.5% |
Similar Demographics by Male Poverty
Demographics Similar to Tsimshian by Male Poverty
In terms of male poverty, the demographic groups most similar to Tsimshian are Liberian (12.8%, a difference of 0.010%), Alaskan Athabascan (12.8%, a difference of 0.11%), Nepalese (12.8%, a difference of 0.14%), Sudanese (12.8%, a difference of 0.31%), and Immigrants from El Salvador (12.8%, a difference of 0.32%).
| Demographics | Rating | Rank | Male Poverty |
| French American Indians | 0.4 /100 | #237 | Tragic 12.7% |
| Ecuadorians | 0.4 /100 | #238 | Tragic 12.7% |
| Ghanaians | 0.4 /100 | #239 | Tragic 12.7% |
| Immigrants | Middle Africa | 0.4 /100 | #240 | Tragic 12.7% |
| Sudanese | 0.3 /100 | #241 | Tragic 12.8% |
| Nepalese | 0.3 /100 | #242 | Tragic 12.8% |
| Alaskan Athabascans | 0.3 /100 | #243 | Tragic 12.8% |
| Tsimshian | 0.3 /100 | #244 | Tragic 12.8% |
| Liberians | 0.3 /100 | #245 | Tragic 12.8% |
| Immigrants | El Salvador | 0.2 /100 | #246 | Tragic 12.8% |
| Immigrants | Western Africa | 0.2 /100 | #247 | Tragic 12.9% |
| Immigrants | Sudan | 0.2 /100 | #248 | Tragic 12.9% |
| Potawatomi | 0.2 /100 | #249 | Tragic 12.9% |
| Immigrants | Nicaragua | 0.2 /100 | #250 | Tragic 12.9% |
| Immigrants | Cuba | 0.2 /100 | #251 | Tragic 12.9% |
Demographics Similar to Immigrants from Lithuania by Male Poverty
In terms of male poverty, the demographic groups most similar to Immigrants from Lithuania are Immigrants from Bolivia (9.4%, a difference of 0.12%), Bolivian (9.4%, a difference of 0.17%), Immigrants from North Macedonia (9.4%, a difference of 0.38%), Bhutanese (9.5%, a difference of 0.67%), and Bulgarian (9.3%, a difference of 0.82%).
| Demographics | Rating | Rank | Male Poverty |
| Assyrians/Chaldeans/Syriacs | 99.9 /100 | #6 | Exceptional 9.1% |
| Immigrants | Ireland | 99.9 /100 | #7 | Exceptional 9.1% |
| Filipinos | 99.9 /100 | #8 | Exceptional 9.2% |
| Immigrants | South Central Asia | 99.9 /100 | #9 | Exceptional 9.3% |
| Bulgarians | 99.9 /100 | #10 | Exceptional 9.3% |
| Bolivians | 99.9 /100 | #11 | Exceptional 9.4% |
| Immigrants | Bolivia | 99.9 /100 | #12 | Exceptional 9.4% |
| Immigrants | Lithuania | 99.9 /100 | #13 | Exceptional 9.4% |
| Immigrants | North Macedonia | 99.8 /100 | #14 | Exceptional 9.4% |
| Bhutanese | 99.8 /100 | #15 | Exceptional 9.5% |
| Luxembourgers | 99.8 /100 | #16 | Exceptional 9.5% |
| Norwegians | 99.8 /100 | #17 | Exceptional 9.5% |
| Lithuanians | 99.8 /100 | #18 | Exceptional 9.5% |
| Immigrants | Hong Kong | 99.7 /100 | #19 | Exceptional 9.6% |
| Latvians | 99.7 /100 | #20 | Exceptional 9.6% |