Immigrants from Uruguay vs Immigrants from Lithuania 4 or more Vehicles in Household
COMPARE
Immigrants from Uruguay
Immigrants from Lithuania
4 or more Vehicles in Household
4 or more Vehicles in Household Comparison
Immigrants from Uruguay
Immigrants from Lithuania
5.4%
4 OR MORE VEHICLES IN HOUSEHOLD
0.3/ 100
METRIC RATING
279th/ 347
METRIC RANK
5.6%
4 OR MORE VEHICLES IN HOUSEHOLD
1.4/ 100
METRIC RATING
258th/ 347
METRIC RANK
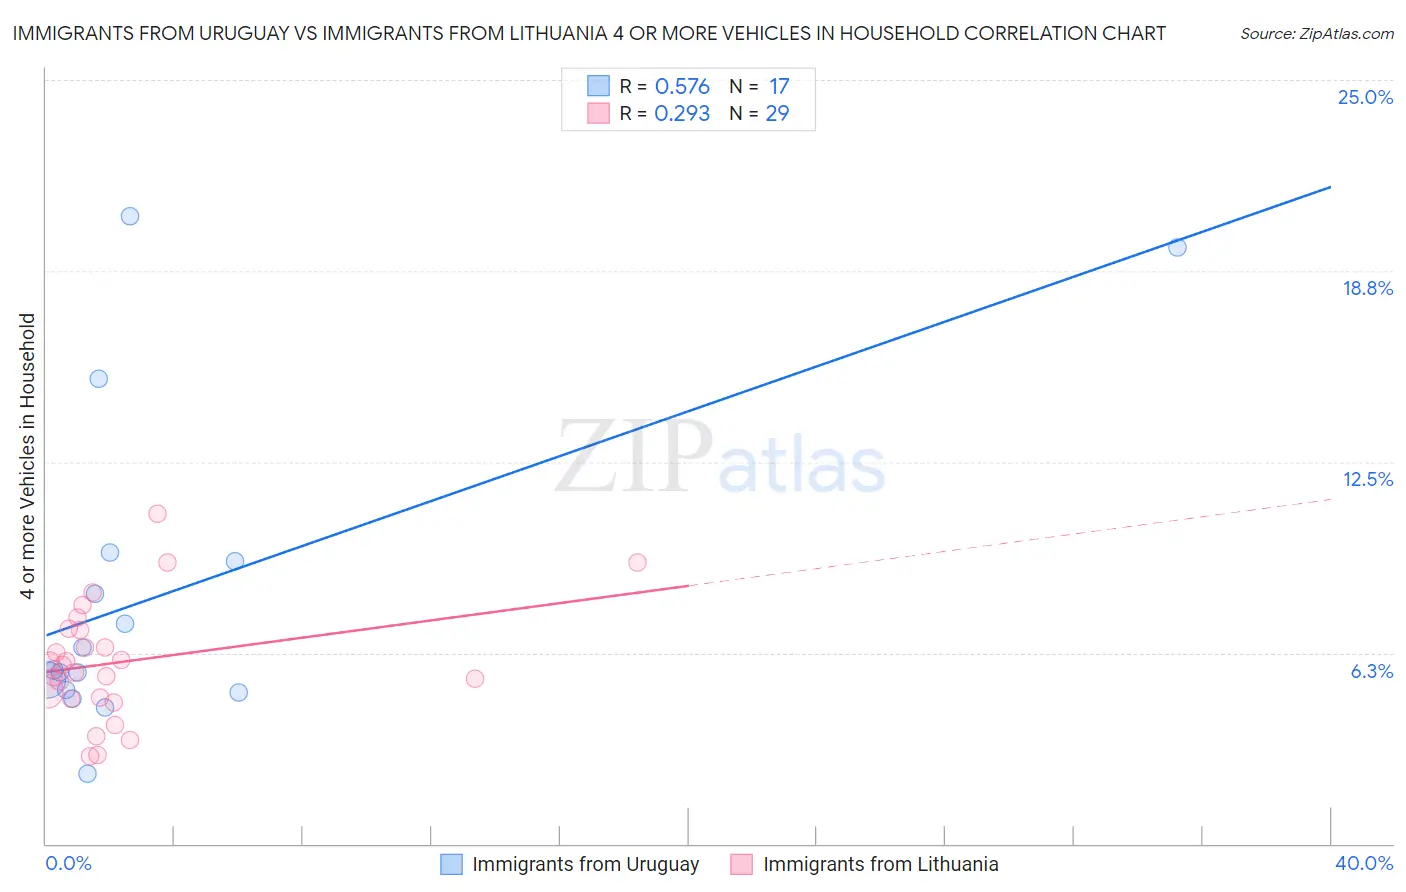
Immigrants from Uruguay vs Immigrants from Lithuania 4 or more Vehicles in Household Correlation Chart
The statistical analysis conducted on geographies consisting of 132,880,755 people shows a substantial positive correlation between the proportion of Immigrants from Uruguay and percentage of households with 4 or more vehicles available in the United States with a correlation coefficient (R) of 0.576 and weighted average of 5.4%. Similarly, the statistical analysis conducted on geographies consisting of 117,416,675 people shows a weak positive correlation between the proportion of Immigrants from Lithuania and percentage of households with 4 or more vehicles available in the United States with a correlation coefficient (R) of 0.293 and weighted average of 5.6%, a difference of 4.3%.
4 or more Vehicles in Household Correlation Summary
| Measurement | Immigrants from Uruguay | Immigrants from Lithuania |
| Minimum | 2.3% | 2.9% |
| Maximum | 20.5% | 10.8% |
| Range | 18.2% | 7.9% |
| Mean | 8.2% | 6.0% |
| Median | 5.7% | 5.8% |
| Interquartile 25% (IQ1) | 5.0% | 4.8% |
| Interquartile 75% (IQ3) | 9.4% | 7.0% |
| Interquartile Range (IQR) | 4.4% | 2.2% |
| Standard Deviation (Sample) | 5.3% | 1.9% |
| Standard Deviation (Population) | 5.1% | 1.9% |
Similar Demographics by 4 or more Vehicles in Household
Demographics Similar to Immigrants from Uruguay by 4 or more Vehicles in Household
In terms of 4 or more vehicles in household, the demographic groups most similar to Immigrants from Uruguay are Alsatian (5.4%, a difference of 0.010%), Immigrants from Western Africa (5.4%, a difference of 0.080%), Immigrants from Spain (5.4%, a difference of 0.25%), Immigrants from Ireland (5.4%, a difference of 0.33%), and Immigrants from Eastern Europe (5.4%, a difference of 0.46%).
| Demographics | Rating | Rank | 4 or more Vehicles in Household |
| Immigrants | Kazakhstan | 0.6 /100 | #272 | Tragic 5.5% |
| Macedonians | 0.6 /100 | #273 | Tragic 5.5% |
| Blacks/African Americans | 0.6 /100 | #274 | Tragic 5.5% |
| Cambodians | 0.5 /100 | #275 | Tragic 5.5% |
| Immigrants | Latvia | 0.5 /100 | #276 | Tragic 5.5% |
| Immigrants | Bulgaria | 0.5 /100 | #277 | Tragic 5.5% |
| Immigrants | Eastern Europe | 0.4 /100 | #278 | Tragic 5.4% |
| Immigrants | Uruguay | 0.3 /100 | #279 | Tragic 5.4% |
| Alsatians | 0.3 /100 | #280 | Tragic 5.4% |
| Immigrants | Western Africa | 0.3 /100 | #281 | Tragic 5.4% |
| Immigrants | Spain | 0.3 /100 | #282 | Tragic 5.4% |
| Immigrants | Ireland | 0.3 /100 | #283 | Tragic 5.4% |
| Brazilians | 0.3 /100 | #284 | Tragic 5.4% |
| Immigrants | Liberia | 0.2 /100 | #285 | Tragic 5.4% |
| Immigrants | Colombia | 0.2 /100 | #286 | Tragic 5.4% |
Demographics Similar to Immigrants from Lithuania by 4 or more Vehicles in Household
In terms of 4 or more vehicles in household, the demographic groups most similar to Immigrants from Lithuania are Immigrants from France (5.6%, a difference of 0.030%), Immigrants from Northern Africa (5.6%, a difference of 0.14%), Immigrants from Turkey (5.7%, a difference of 0.22%), Uruguayan (5.6%, a difference of 0.22%), and Yup'ik (5.7%, a difference of 0.25%).
| Demographics | Rating | Rank | 4 or more Vehicles in Household |
| Ugandans | 2.2 /100 | #251 | Tragic 5.7% |
| Sub-Saharan Africans | 2.1 /100 | #252 | Tragic 5.7% |
| Immigrants | Cuba | 1.6 /100 | #253 | Tragic 5.7% |
| Immigrants | Panama | 1.5 /100 | #254 | Tragic 5.7% |
| Yup'ik | 1.5 /100 | #255 | Tragic 5.7% |
| Immigrants | Turkey | 1.5 /100 | #256 | Tragic 5.7% |
| Immigrants | Northern Africa | 1.4 /100 | #257 | Tragic 5.6% |
| Immigrants | Lithuania | 1.4 /100 | #258 | Tragic 5.6% |
| Immigrants | France | 1.3 /100 | #259 | Tragic 5.6% |
| Uruguayans | 1.3 /100 | #260 | Tragic 5.6% |
| Sudanese | 1.2 /100 | #261 | Tragic 5.6% |
| Bermudans | 1.2 /100 | #262 | Tragic 5.6% |
| Immigrants | Saudi Arabia | 1.1 /100 | #263 | Tragic 5.6% |
| Immigrants | Africa | 1.0 /100 | #264 | Tragic 5.6% |
| South Americans | 0.9 /100 | #265 | Tragic 5.6% |