Tsimshian vs Immigrants from Lithuania Median Male Earnings
COMPARE
Tsimshian
Immigrants from Lithuania
Median Male Earnings
Median Male Earnings Comparison
Tsimshian
Immigrants from Lithuania
$48,836
MEDIAN MALE EARNINGS
0.4/ 100
METRIC RATING
269th/ 347
METRIC RANK
$63,346
MEDIAN MALE EARNINGS
100.0/ 100
METRIC RATING
33rd/ 347
METRIC RANK
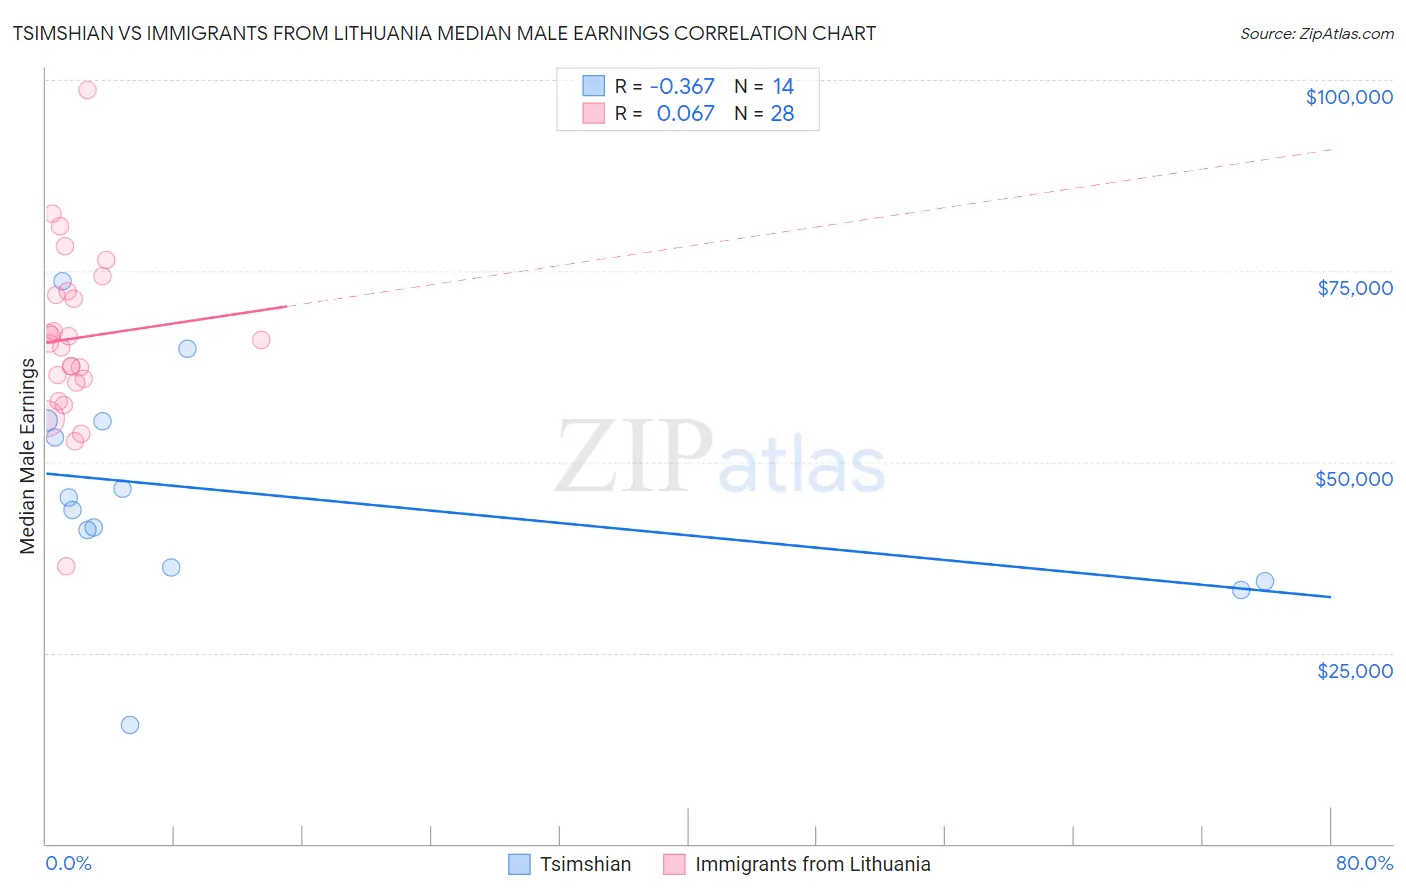
Tsimshian vs Immigrants from Lithuania Median Male Earnings Correlation Chart
The statistical analysis conducted on geographies consisting of 15,625,423 people shows a mild negative correlation between the proportion of Tsimshian and median male earnings in the United States with a correlation coefficient (R) of -0.367 and weighted average of $48,836. Similarly, the statistical analysis conducted on geographies consisting of 117,720,522 people shows a slight positive correlation between the proportion of Immigrants from Lithuania and median male earnings in the United States with a correlation coefficient (R) of 0.067 and weighted average of $63,346, a difference of 29.7%.
Median Male Earnings Correlation Summary
| Measurement | Tsimshian | Immigrants from Lithuania |
| Minimum | $15,625 | $36,313 |
| Maximum | $73,588 | $98,618 |
| Range | $57,963 | $62,305 |
| Mean | $45,710 | $66,192 |
| Median | $44,489 | $65,733 |
| Interquartile 25% (IQ1) | $36,250 | $60,577 |
| Interquartile 75% (IQ3) | $55,386 | $72,153 |
| Interquartile Range (IQR) | $19,136 | $11,576 |
| Standard Deviation (Sample) | $14,437 | $11,479 |
| Standard Deviation (Population) | $13,911 | $11,272 |
Similar Demographics by Median Male Earnings
Demographics Similar to Tsimshian by Median Male Earnings
In terms of median male earnings, the demographic groups most similar to Tsimshian are Ute ($48,899, a difference of 0.13%), Potawatomi ($48,768, a difference of 0.14%), Cherokee ($48,669, a difference of 0.34%), Spanish American ($49,008, a difference of 0.35%), and Somali ($49,025, a difference of 0.39%).
| Demographics | Rating | Rank | Median Male Earnings |
| Immigrants | West Indies | 0.6 /100 | #262 | Tragic $49,271 |
| Nicaraguans | 0.6 /100 | #263 | Tragic $49,215 |
| Immigrants | Middle Africa | 0.6 /100 | #264 | Tragic $49,201 |
| Immigrants | Laos | 0.6 /100 | #265 | Tragic $49,190 |
| Somalis | 0.5 /100 | #266 | Tragic $49,025 |
| Spanish Americans | 0.5 /100 | #267 | Tragic $49,008 |
| Ute | 0.4 /100 | #268 | Tragic $48,899 |
| Tsimshian | 0.4 /100 | #269 | Tragic $48,836 |
| Potawatomi | 0.4 /100 | #270 | Tragic $48,768 |
| Cherokee | 0.3 /100 | #271 | Tragic $48,669 |
| Salvadorans | 0.3 /100 | #272 | Tragic $48,646 |
| Jamaicans | 0.3 /100 | #273 | Tragic $48,632 |
| Colville | 0.3 /100 | #274 | Tragic $48,516 |
| Immigrants | Somalia | 0.3 /100 | #275 | Tragic $48,439 |
| Blackfeet | 0.3 /100 | #276 | Tragic $48,402 |
Demographics Similar to Immigrants from Lithuania by Median Male Earnings
In terms of median male earnings, the demographic groups most similar to Immigrants from Lithuania are Immigrants from Russia ($63,326, a difference of 0.030%), Soviet Union ($63,382, a difference of 0.060%), Immigrants from Asia ($63,240, a difference of 0.17%), Israeli ($63,228, a difference of 0.19%), and Latvian ($63,498, a difference of 0.24%).
| Demographics | Rating | Rank | Median Male Earnings |
| Turks | 100.0 /100 | #26 | Exceptional $64,253 |
| Immigrants | Switzerland | 100.0 /100 | #27 | Exceptional $63,944 |
| Russians | 100.0 /100 | #28 | Exceptional $63,939 |
| Asians | 100.0 /100 | #29 | Exceptional $63,827 |
| Immigrants | France | 100.0 /100 | #30 | Exceptional $63,715 |
| Latvians | 100.0 /100 | #31 | Exceptional $63,498 |
| Soviet Union | 100.0 /100 | #32 | Exceptional $63,382 |
| Immigrants | Lithuania | 100.0 /100 | #33 | Exceptional $63,346 |
| Immigrants | Russia | 100.0 /100 | #34 | Exceptional $63,326 |
| Immigrants | Asia | 100.0 /100 | #35 | Exceptional $63,240 |
| Israelis | 100.0 /100 | #36 | Exceptional $63,228 |
| Immigrants | Sri Lanka | 100.0 /100 | #37 | Exceptional $63,099 |
| Maltese | 100.0 /100 | #38 | Exceptional $62,953 |
| Immigrants | South Africa | 100.0 /100 | #39 | Exceptional $62,899 |
| Australians | 100.0 /100 | #40 | Exceptional $62,857 |