Ukrainian vs Immigrants from Lithuania 4 or more Vehicles in Household
COMPARE
Ukrainian
Immigrants from Lithuania
4 or more Vehicles in Household
4 or more Vehicles in Household Comparison
Ukrainians
Immigrants from Lithuania
6.3%
4 OR MORE VEHICLES IN HOUSEHOLD
47.6/ 100
METRIC RATING
176th/ 347
METRIC RANK
5.6%
4 OR MORE VEHICLES IN HOUSEHOLD
1.4/ 100
METRIC RATING
258th/ 347
METRIC RANK
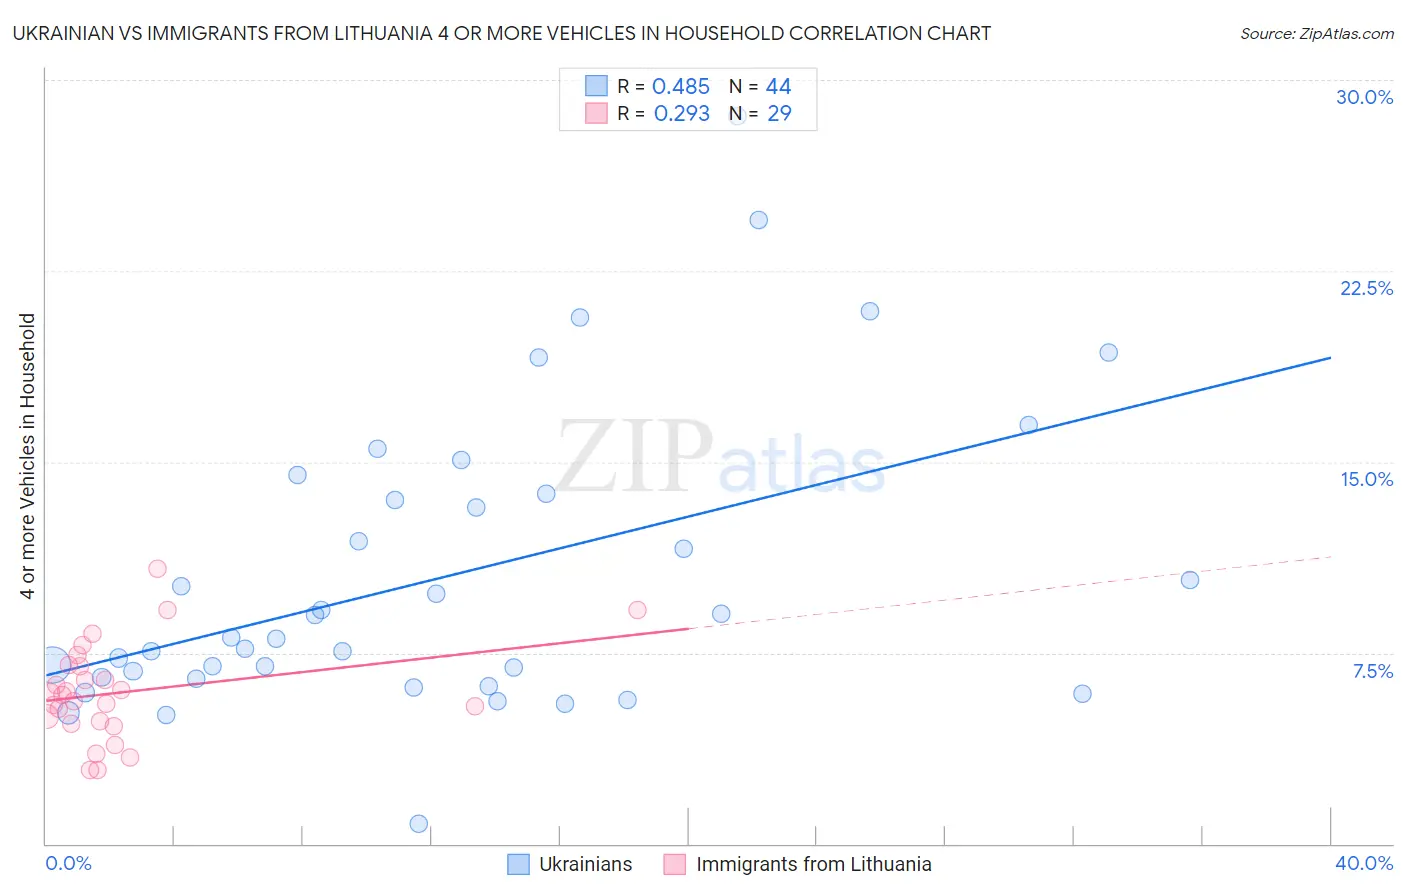
Ukrainian vs Immigrants from Lithuania 4 or more Vehicles in Household Correlation Chart
The statistical analysis conducted on geographies consisting of 446,444,897 people shows a moderate positive correlation between the proportion of Ukrainians and percentage of households with 4 or more vehicles available in the United States with a correlation coefficient (R) of 0.485 and weighted average of 6.3%. Similarly, the statistical analysis conducted on geographies consisting of 117,416,675 people shows a weak positive correlation between the proportion of Immigrants from Lithuania and percentage of households with 4 or more vehicles available in the United States with a correlation coefficient (R) of 0.293 and weighted average of 5.6%, a difference of 11.9%.
4 or more Vehicles in Household Correlation Summary
| Measurement | Ukrainian | Immigrants from Lithuania |
| Minimum | 0.81% | 2.9% |
| Maximum | 28.6% | 10.8% |
| Range | 27.8% | 7.9% |
| Mean | 10.5% | 6.0% |
| Median | 8.1% | 5.8% |
| Interquartile 25% (IQ1) | 6.5% | 4.8% |
| Interquartile 75% (IQ3) | 13.6% | 7.0% |
| Interquartile Range (IQR) | 7.1% | 2.2% |
| Standard Deviation (Sample) | 5.8% | 1.9% |
| Standard Deviation (Population) | 5.8% | 1.9% |
Similar Demographics by 4 or more Vehicles in Household
Demographics Similar to Ukrainians by 4 or more Vehicles in Household
In terms of 4 or more vehicles in household, the demographic groups most similar to Ukrainians are Slovak (6.3%, a difference of 0.070%), Immigrants from Western Europe (6.3%, a difference of 0.12%), Lithuanian (6.3%, a difference of 0.24%), Belizean (6.3%, a difference of 0.31%), and Slovene (6.3%, a difference of 0.36%).
| Demographics | Rating | Rank | 4 or more Vehicles in Household |
| Estonians | 55.1 /100 | #169 | Average 6.4% |
| Immigrants | Syria | 52.8 /100 | #170 | Average 6.3% |
| Immigrants | India | 51.9 /100 | #171 | Average 6.3% |
| Immigrants | Lebanon | 51.7 /100 | #172 | Average 6.3% |
| Slovenes | 51.1 /100 | #173 | Average 6.3% |
| Lithuanians | 50.0 /100 | #174 | Average 6.3% |
| Immigrants | Western Europe | 48.8 /100 | #175 | Average 6.3% |
| Ukrainians | 47.6 /100 | #176 | Average 6.3% |
| Slovaks | 46.9 /100 | #177 | Average 6.3% |
| Belizeans | 44.5 /100 | #178 | Average 6.3% |
| Immigrants | Japan | 43.1 /100 | #179 | Average 6.3% |
| Syrians | 42.0 /100 | #180 | Average 6.3% |
| Yugoslavians | 41.1 /100 | #181 | Average 6.3% |
| South American Indians | 40.7 /100 | #182 | Average 6.3% |
| Immigrants | Burma/Myanmar | 37.5 /100 | #183 | Fair 6.2% |
Demographics Similar to Immigrants from Lithuania by 4 or more Vehicles in Household
In terms of 4 or more vehicles in household, the demographic groups most similar to Immigrants from Lithuania are Immigrants from France (5.6%, a difference of 0.030%), Immigrants from Northern Africa (5.6%, a difference of 0.14%), Immigrants from Turkey (5.7%, a difference of 0.22%), Uruguayan (5.6%, a difference of 0.22%), and Yup'ik (5.7%, a difference of 0.25%).
| Demographics | Rating | Rank | 4 or more Vehicles in Household |
| Ugandans | 2.2 /100 | #251 | Tragic 5.7% |
| Sub-Saharan Africans | 2.1 /100 | #252 | Tragic 5.7% |
| Immigrants | Cuba | 1.6 /100 | #253 | Tragic 5.7% |
| Immigrants | Panama | 1.5 /100 | #254 | Tragic 5.7% |
| Yup'ik | 1.5 /100 | #255 | Tragic 5.7% |
| Immigrants | Turkey | 1.5 /100 | #256 | Tragic 5.7% |
| Immigrants | Northern Africa | 1.4 /100 | #257 | Tragic 5.6% |
| Immigrants | Lithuania | 1.4 /100 | #258 | Tragic 5.6% |
| Immigrants | France | 1.3 /100 | #259 | Tragic 5.6% |
| Uruguayans | 1.3 /100 | #260 | Tragic 5.6% |
| Sudanese | 1.2 /100 | #261 | Tragic 5.6% |
| Bermudans | 1.2 /100 | #262 | Tragic 5.6% |
| Immigrants | Saudi Arabia | 1.1 /100 | #263 | Tragic 5.6% |
| Immigrants | Africa | 1.0 /100 | #264 | Tragic 5.6% |
| South Americans | 0.9 /100 | #265 | Tragic 5.6% |