Tsimshian vs Immigrants from Moldova 4 or more Vehicles in Household
COMPARE
Tsimshian
Immigrants from Moldova
4 or more Vehicles in Household
4 or more Vehicles in Household Comparison
Tsimshian
Immigrants from Moldova
6.2%
4 OR MORE VEHICLES IN HOUSEHOLD
26.4/ 100
METRIC RATING
196th/ 347
METRIC RANK
6.0%
4 OR MORE VEHICLES IN HOUSEHOLD
9.3/ 100
METRIC RATING
221st/ 347
METRIC RANK
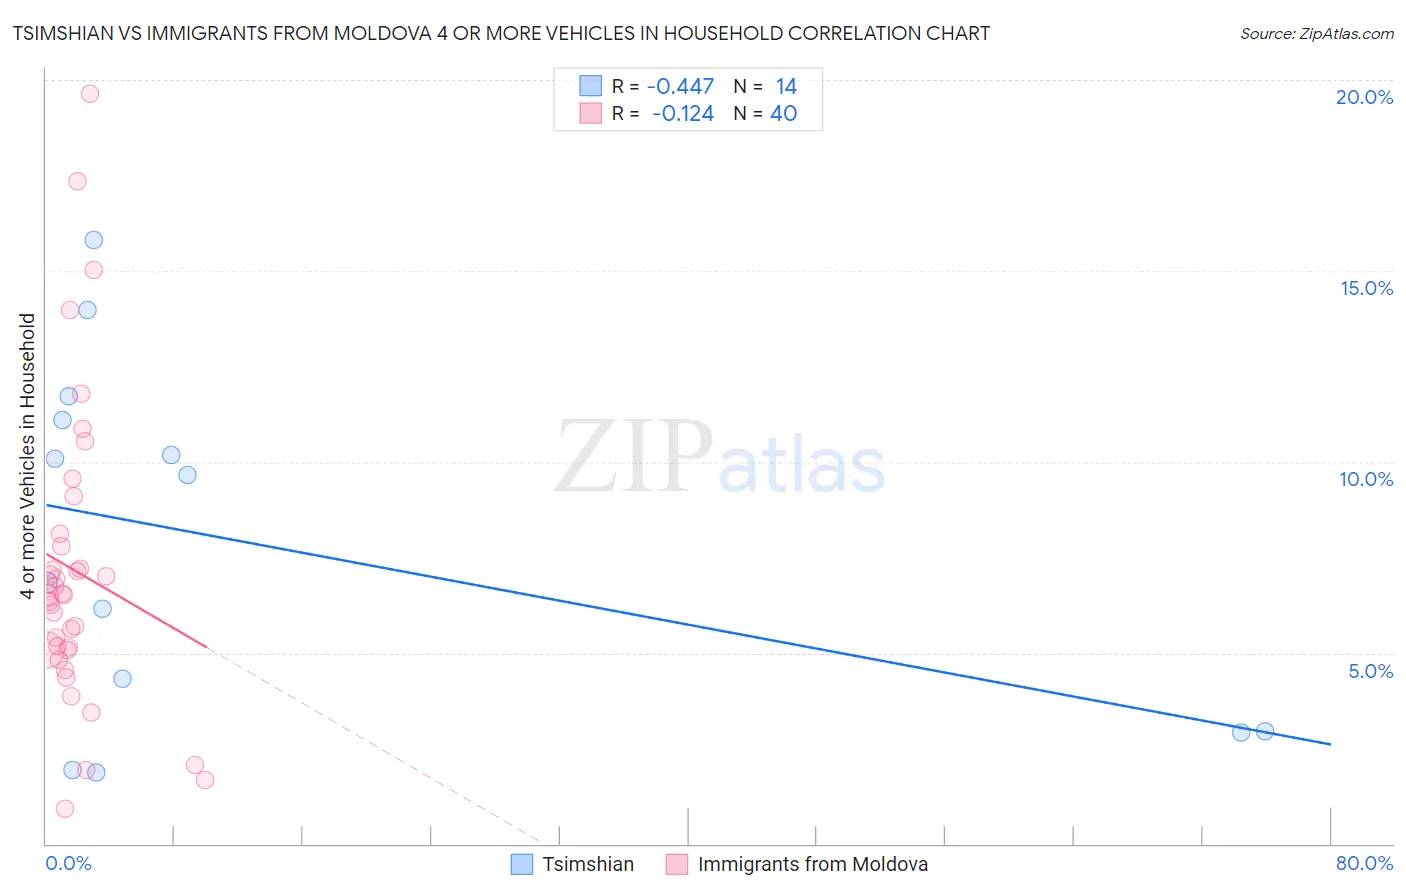
Tsimshian vs Immigrants from Moldova 4 or more Vehicles in Household Correlation Chart
The statistical analysis conducted on geographies consisting of 15,625,888 people shows a moderate negative correlation between the proportion of Tsimshian and percentage of households with 4 or more vehicles available in the United States with a correlation coefficient (R) of -0.447 and weighted average of 6.2%. Similarly, the statistical analysis conducted on geographies consisting of 123,950,507 people shows a poor negative correlation between the proportion of Immigrants from Moldova and percentage of households with 4 or more vehicles available in the United States with a correlation coefficient (R) of -0.124 and weighted average of 6.0%, a difference of 3.4%.
4 or more Vehicles in Household Correlation Summary
| Measurement | Tsimshian | Immigrants from Moldova |
| Minimum | 1.9% | 0.92% |
| Maximum | 15.8% | 19.6% |
| Range | 14.0% | 18.7% |
| Mean | 7.8% | 7.2% |
| Median | 8.2% | 6.5% |
| Interquartile 25% (IQ1) | 2.9% | 5.1% |
| Interquartile 75% (IQ3) | 11.1% | 7.9% |
| Interquartile Range (IQR) | 8.2% | 2.9% |
| Standard Deviation (Sample) | 4.6% | 4.0% |
| Standard Deviation (Population) | 4.4% | 3.9% |
Similar Demographics by 4 or more Vehicles in Household
Demographics Similar to Tsimshian by 4 or more Vehicles in Household
In terms of 4 or more vehicles in household, the demographic groups most similar to Tsimshian are Immigrants from Sweden (6.2%, a difference of 0.070%), Argentinean (6.2%, a difference of 0.070%), Immigrants from Kuwait (6.2%, a difference of 0.20%), Immigrants from Sri Lanka (6.1%, a difference of 0.38%), and Romanian (6.2%, a difference of 0.54%).
| Demographics | Rating | Rank | 4 or more Vehicles in Household |
| Immigrants | Eastern Asia | 33.3 /100 | #189 | Fair 6.2% |
| South Africans | 32.2 /100 | #190 | Fair 6.2% |
| Inupiat | 30.7 /100 | #191 | Fair 6.2% |
| Romanians | 30.7 /100 | #192 | Fair 6.2% |
| Immigrants | Kuwait | 28.0 /100 | #193 | Fair 6.2% |
| Immigrants | Sweden | 27.0 /100 | #194 | Fair 6.2% |
| Argentineans | 27.0 /100 | #195 | Fair 6.2% |
| Tsimshian | 26.4 /100 | #196 | Fair 6.2% |
| Immigrants | Sri Lanka | 23.7 /100 | #197 | Fair 6.1% |
| Immigrants | Portugal | 22.3 /100 | #198 | Fair 6.1% |
| Immigrants | Norway | 21.8 /100 | #199 | Fair 6.1% |
| Latvians | 21.7 /100 | #200 | Fair 6.1% |
| Egyptians | 21.4 /100 | #201 | Fair 6.1% |
| Immigrants | South Central Asia | 21.3 /100 | #202 | Fair 6.1% |
| Immigrants | Sierra Leone | 20.5 /100 | #203 | Fair 6.1% |
Demographics Similar to Immigrants from Moldova by 4 or more Vehicles in Household
In terms of 4 or more vehicles in household, the demographic groups most similar to Immigrants from Moldova are Cajun (6.0%, a difference of 0.030%), Immigrants from Kenya (6.0%, a difference of 0.030%), Cuban (6.0%, a difference of 0.050%), Indonesian (6.0%, a difference of 0.13%), and Russian (6.0%, a difference of 0.29%).
| Demographics | Rating | Rank | 4 or more Vehicles in Household |
| Immigrants | Austria | 14.3 /100 | #214 | Poor 6.0% |
| Immigrants | China | 13.8 /100 | #215 | Poor 6.0% |
| Immigrants | Romania | 13.8 /100 | #216 | Poor 6.0% |
| Nigerians | 12.2 /100 | #217 | Poor 6.0% |
| Immigrants | Italy | 11.0 /100 | #218 | Poor 6.0% |
| Serbians | 11.0 /100 | #219 | Poor 6.0% |
| Russians | 10.3 /100 | #220 | Poor 6.0% |
| Immigrants | Moldova | 9.3 /100 | #221 | Tragic 6.0% |
| Cajuns | 9.2 /100 | #222 | Tragic 6.0% |
| Immigrants | Kenya | 9.2 /100 | #223 | Tragic 6.0% |
| Cubans | 9.2 /100 | #224 | Tragic 6.0% |
| Indonesians | 8.9 /100 | #225 | Tragic 6.0% |
| Immigrants | Singapore | 7.9 /100 | #226 | Tragic 5.9% |
| Immigrants | Western Asia | 7.8 /100 | #227 | Tragic 5.9% |
| Immigrants | Uganda | 7.5 /100 | #228 | Tragic 5.9% |