Tsimshian vs Bolivian 4 or more Vehicles in Household
COMPARE
Tsimshian
Bolivian
4 or more Vehicles in Household
4 or more Vehicles in Household Comparison
Tsimshian
Bolivians
6.2%
4 OR MORE VEHICLES IN HOUSEHOLD
26.4/ 100
METRIC RATING
196th/ 347
METRIC RANK
6.8%
4 OR MORE VEHICLES IN HOUSEHOLD
96.3/ 100
METRIC RATING
114th/ 347
METRIC RANK
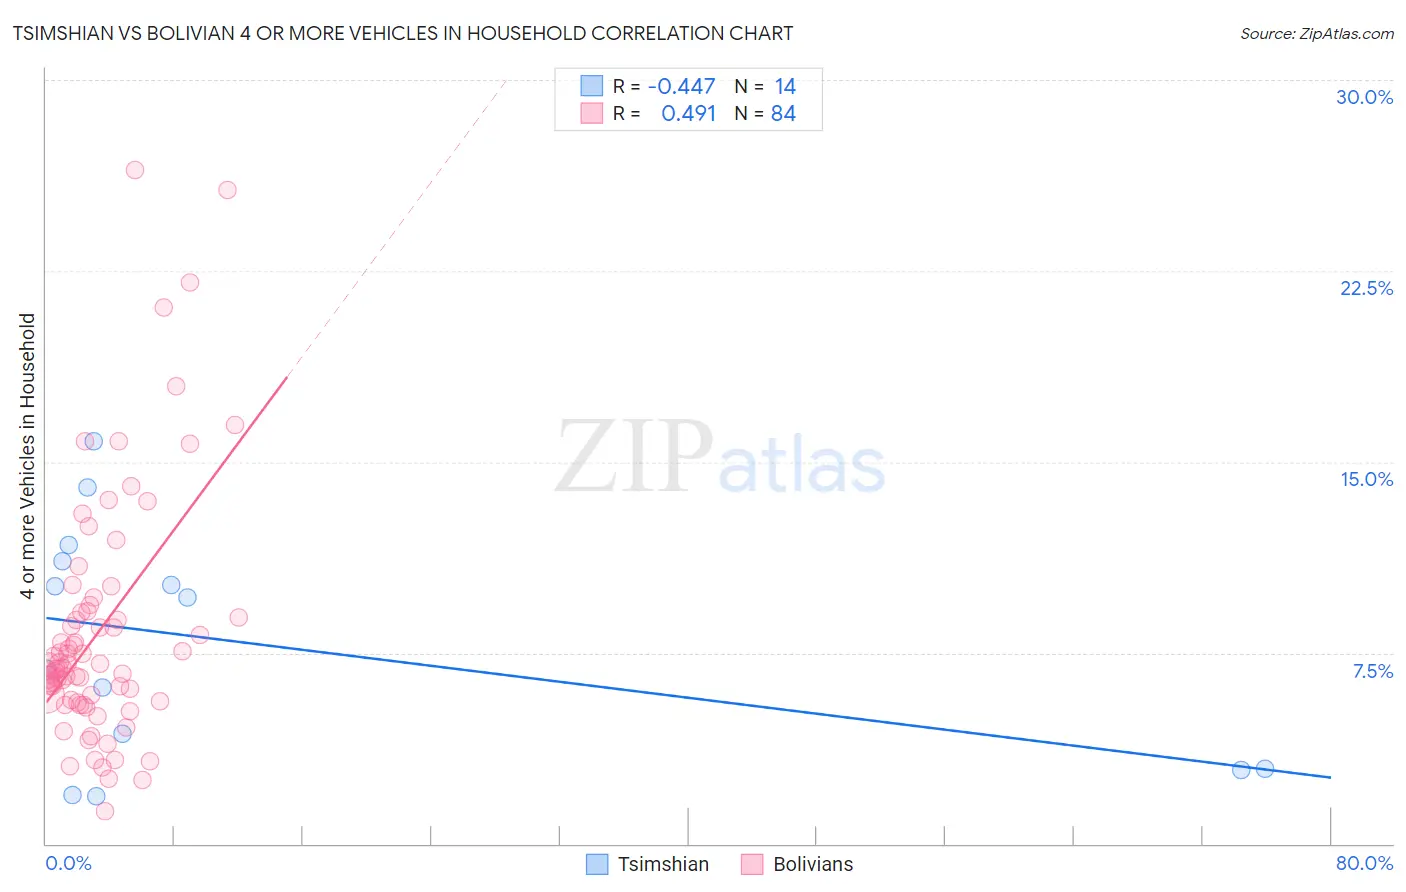
Tsimshian vs Bolivian 4 or more Vehicles in Household Correlation Chart
The statistical analysis conducted on geographies consisting of 15,625,888 people shows a moderate negative correlation between the proportion of Tsimshian and percentage of households with 4 or more vehicles available in the United States with a correlation coefficient (R) of -0.447 and weighted average of 6.2%. Similarly, the statistical analysis conducted on geographies consisting of 183,943,561 people shows a moderate positive correlation between the proportion of Bolivians and percentage of households with 4 or more vehicles available in the United States with a correlation coefficient (R) of 0.491 and weighted average of 6.8%, a difference of 11.1%.
4 or more Vehicles in Household Correlation Summary
| Measurement | Tsimshian | Bolivian |
| Minimum | 1.9% | 1.3% |
| Maximum | 15.8% | 26.5% |
| Range | 14.0% | 25.2% |
| Mean | 7.8% | 8.4% |
| Median | 8.2% | 7.0% |
| Interquartile 25% (IQ1) | 2.9% | 5.6% |
| Interquartile 75% (IQ3) | 11.1% | 9.1% |
| Interquartile Range (IQR) | 8.2% | 3.5% |
| Standard Deviation (Sample) | 4.6% | 4.9% |
| Standard Deviation (Population) | 4.4% | 4.8% |
Similar Demographics by 4 or more Vehicles in Household
Demographics Similar to Tsimshian by 4 or more Vehicles in Household
In terms of 4 or more vehicles in household, the demographic groups most similar to Tsimshian are Immigrants from Sweden (6.2%, a difference of 0.070%), Argentinean (6.2%, a difference of 0.070%), Immigrants from Kuwait (6.2%, a difference of 0.20%), Immigrants from Sri Lanka (6.1%, a difference of 0.38%), and Romanian (6.2%, a difference of 0.54%).
| Demographics | Rating | Rank | 4 or more Vehicles in Household |
| Immigrants | Eastern Asia | 33.3 /100 | #189 | Fair 6.2% |
| South Africans | 32.2 /100 | #190 | Fair 6.2% |
| Inupiat | 30.7 /100 | #191 | Fair 6.2% |
| Romanians | 30.7 /100 | #192 | Fair 6.2% |
| Immigrants | Kuwait | 28.0 /100 | #193 | Fair 6.2% |
| Immigrants | Sweden | 27.0 /100 | #194 | Fair 6.2% |
| Argentineans | 27.0 /100 | #195 | Fair 6.2% |
| Tsimshian | 26.4 /100 | #196 | Fair 6.2% |
| Immigrants | Sri Lanka | 23.7 /100 | #197 | Fair 6.1% |
| Immigrants | Portugal | 22.3 /100 | #198 | Fair 6.1% |
| Immigrants | Norway | 21.8 /100 | #199 | Fair 6.1% |
| Latvians | 21.7 /100 | #200 | Fair 6.1% |
| Egyptians | 21.4 /100 | #201 | Fair 6.1% |
| Immigrants | South Central Asia | 21.3 /100 | #202 | Fair 6.1% |
| Immigrants | Sierra Leone | 20.5 /100 | #203 | Fair 6.1% |
Demographics Similar to Bolivians by 4 or more Vehicles in Household
In terms of 4 or more vehicles in household, the demographic groups most similar to Bolivians are Canadian (6.9%, a difference of 0.050%), Tlingit-Haida (6.8%, a difference of 0.060%), Immigrants from Guatemala (6.8%, a difference of 0.32%), Burmese (6.8%, a difference of 0.34%), and French American Indian (6.8%, a difference of 0.34%).
| Demographics | Rating | Rank | 4 or more Vehicles in Household |
| Nicaraguans | 98.0 /100 | #107 | Exceptional 7.0% |
| French | 97.7 /100 | #108 | Exceptional 6.9% |
| Filipinos | 97.6 /100 | #109 | Exceptional 6.9% |
| Immigrants | Thailand | 97.0 /100 | #110 | Exceptional 6.9% |
| Aleuts | 97.0 /100 | #111 | Exceptional 6.9% |
| Hopi | 97.0 /100 | #112 | Exceptional 6.9% |
| Canadians | 96.4 /100 | #113 | Exceptional 6.9% |
| Bolivians | 96.3 /100 | #114 | Exceptional 6.8% |
| Tlingit-Haida | 96.2 /100 | #115 | Exceptional 6.8% |
| Immigrants | Guatemala | 95.8 /100 | #116 | Exceptional 6.8% |
| Burmese | 95.7 /100 | #117 | Exceptional 6.8% |
| French American Indians | 95.7 /100 | #118 | Exceptional 6.8% |
| Costa Ricans | 95.5 /100 | #119 | Exceptional 6.8% |
| Comanche | 94.8 /100 | #120 | Exceptional 6.8% |
| Immigrants | Germany | 94.7 /100 | #121 | Exceptional 6.8% |