Tsimshian vs Immigrants from Somalia 3 or more Vehicles in Household
COMPARE
Tsimshian
Immigrants from Somalia
3 or more Vehicles in Household
3 or more Vehicles in Household Comparison
Tsimshian
Immigrants from Somalia
19.1%
3 OR MORE VEHICLES IN HOUSEHOLD
24.4/ 100
METRIC RATING
193rd/ 347
METRIC RANK
15.9%
3 OR MORE VEHICLES IN HOUSEHOLD
0.0/ 100
METRIC RATING
309th/ 347
METRIC RANK
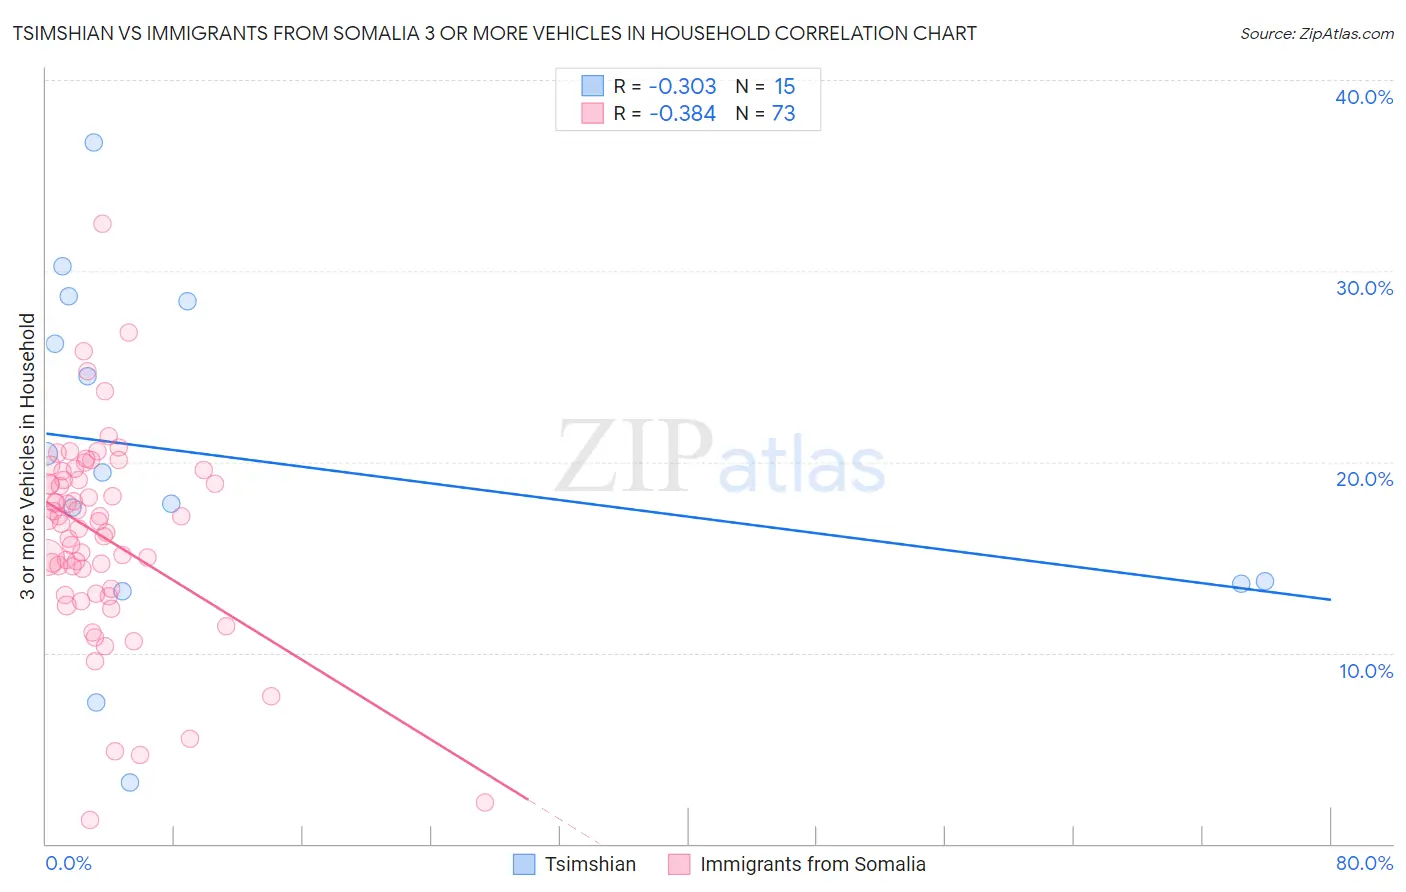
Tsimshian vs Immigrants from Somalia 3 or more Vehicles in Household Correlation Chart
The statistical analysis conducted on geographies consisting of 15,626,544 people shows a mild negative correlation between the proportion of Tsimshian and percentage of households with 3 or more vehicles available in the United States with a correlation coefficient (R) of -0.303 and weighted average of 19.1%. Similarly, the statistical analysis conducted on geographies consisting of 92,101,746 people shows a mild negative correlation between the proportion of Immigrants from Somalia and percentage of households with 3 or more vehicles available in the United States with a correlation coefficient (R) of -0.384 and weighted average of 15.9%, a difference of 19.9%.
3 or more Vehicles in Household Correlation Summary
| Measurement | Tsimshian | Immigrants from Somalia |
| Minimum | 3.2% | 1.3% |
| Maximum | 36.7% | 32.4% |
| Range | 33.5% | 31.2% |
| Mean | 20.1% | 16.1% |
| Median | 19.4% | 16.9% |
| Interquartile 25% (IQ1) | 13.6% | 13.2% |
| Interquartile 75% (IQ3) | 28.4% | 19.3% |
| Interquartile Range (IQR) | 14.8% | 6.1% |
| Standard Deviation (Sample) | 9.1% | 5.3% |
| Standard Deviation (Population) | 8.8% | 5.3% |
Similar Demographics by 3 or more Vehicles in Household
Demographics Similar to Tsimshian by 3 or more Vehicles in Household
In terms of 3 or more vehicles in household, the demographic groups most similar to Tsimshian are Kenyan (19.1%, a difference of 0.030%), Serbian (19.1%, a difference of 0.040%), Immigrants from Moldova (19.1%, a difference of 0.080%), South American Indian (19.1%, a difference of 0.10%), and Immigrants from Zimbabwe (19.1%, a difference of 0.11%).
| Demographics | Rating | Rank | 3 or more Vehicles in Household |
| Immigrants | Sweden | 29.0 /100 | #186 | Fair 19.2% |
| Immigrants | Hong Kong | 28.3 /100 | #187 | Fair 19.2% |
| Immigrants | Kuwait | 26.1 /100 | #188 | Fair 19.1% |
| Indians (Asian) | 26.0 /100 | #189 | Fair 19.1% |
| Immigrants | Zimbabwe | 25.5 /100 | #190 | Fair 19.1% |
| South American Indians | 25.4 /100 | #191 | Fair 19.1% |
| Kenyans | 24.7 /100 | #192 | Fair 19.1% |
| Tsimshian | 24.4 /100 | #193 | Fair 19.1% |
| Serbians | 24.0 /100 | #194 | Fair 19.1% |
| Immigrants | Moldova | 23.6 /100 | #195 | Fair 19.1% |
| Central American Indians | 22.2 /100 | #196 | Fair 19.0% |
| Immigrants | Japan | 22.0 /100 | #197 | Fair 19.0% |
| Egyptians | 19.5 /100 | #198 | Poor 19.0% |
| Immigrants | Norway | 19.0 /100 | #199 | Poor 19.0% |
| Argentineans | 18.2 /100 | #200 | Poor 18.9% |
Demographics Similar to Immigrants from Somalia by 3 or more Vehicles in Household
In terms of 3 or more vehicles in household, the demographic groups most similar to Immigrants from Somalia are Moroccan (15.9%, a difference of 0.24%), Albanian (15.8%, a difference of 0.74%), Houma (16.1%, a difference of 0.92%), Immigrants from Ghana (16.2%, a difference of 1.5%), and Somali (16.2%, a difference of 1.7%).
| Demographics | Rating | Rank | 3 or more Vehicles in Household |
| Immigrants | Greece | 0.0 /100 | #302 | Tragic 16.5% |
| Immigrants | Serbia | 0.0 /100 | #303 | Tragic 16.4% |
| Ghanaians | 0.0 /100 | #304 | Tragic 16.4% |
| Immigrants | Morocco | 0.0 /100 | #305 | Tragic 16.3% |
| Somalis | 0.0 /100 | #306 | Tragic 16.2% |
| Immigrants | Ghana | 0.0 /100 | #307 | Tragic 16.2% |
| Houma | 0.0 /100 | #308 | Tragic 16.1% |
| Immigrants | Somalia | 0.0 /100 | #309 | Tragic 15.9% |
| Moroccans | 0.0 /100 | #310 | Tragic 15.9% |
| Albanians | 0.0 /100 | #311 | Tragic 15.8% |
| Puerto Ricans | 0.0 /100 | #312 | Tragic 15.6% |
| Immigrants | Israel | 0.0 /100 | #313 | Tragic 15.6% |
| Immigrants | Belarus | 0.0 /100 | #314 | Tragic 15.5% |
| Haitians | 0.0 /100 | #315 | Tragic 15.5% |
| U.S. Virgin Islanders | 0.0 /100 | #316 | Tragic 15.4% |