Tsimshian vs Immigrants from Western Europe 3 or more Vehicles in Household
COMPARE
Tsimshian
Immigrants from Western Europe
3 or more Vehicles in Household
3 or more Vehicles in Household Comparison
Tsimshian
Immigrants from Western Europe
19.1%
3 OR MORE VEHICLES IN HOUSEHOLD
24.4/ 100
METRIC RATING
193rd/ 347
METRIC RANK
19.5%
3 OR MORE VEHICLES IN HOUSEHOLD
53.2/ 100
METRIC RATING
171st/ 347
METRIC RANK
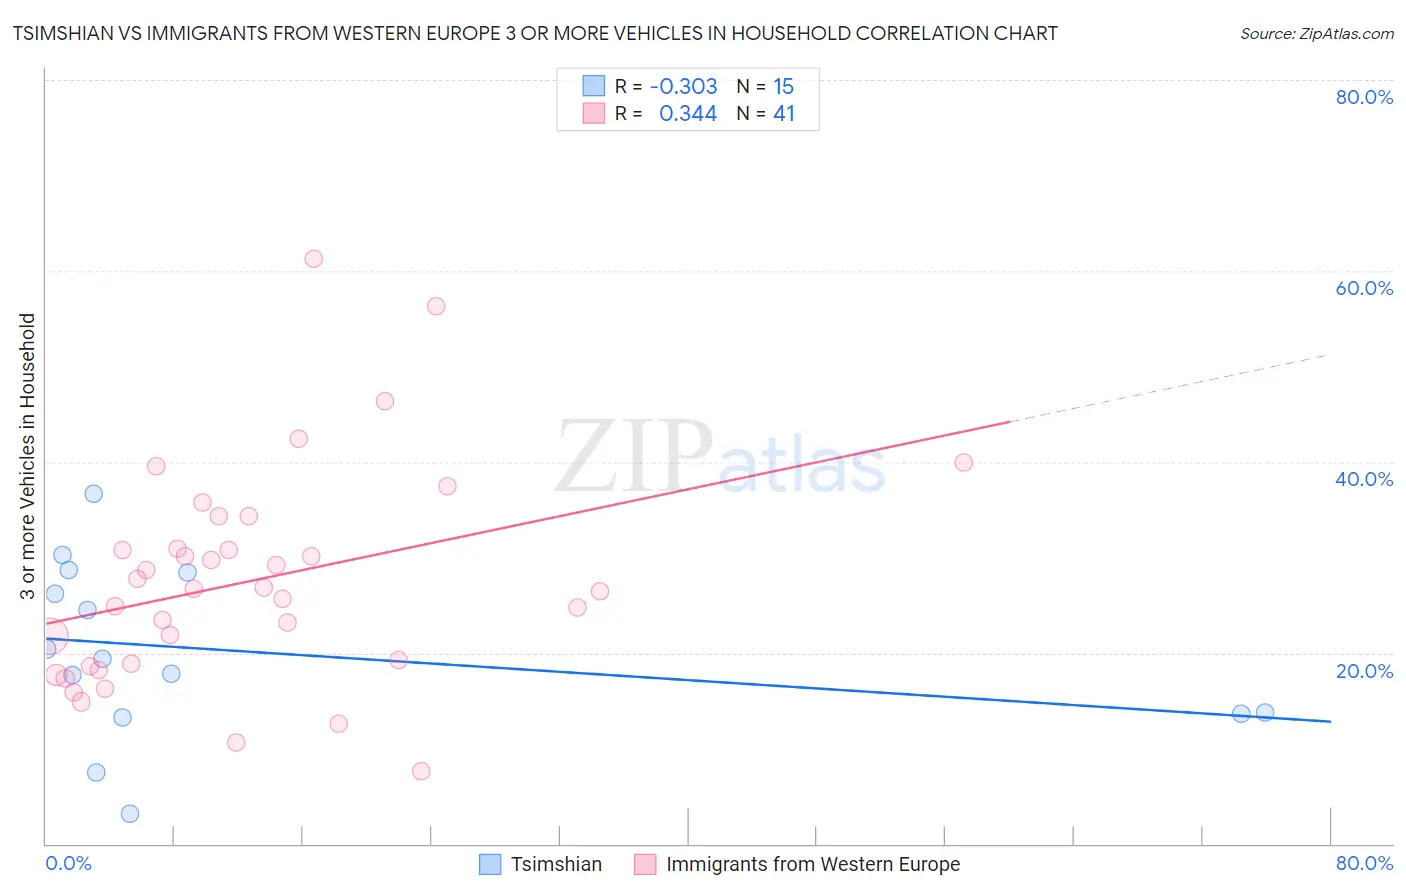
Tsimshian vs Immigrants from Western Europe 3 or more Vehicles in Household Correlation Chart
The statistical analysis conducted on geographies consisting of 15,626,544 people shows a mild negative correlation between the proportion of Tsimshian and percentage of households with 3 or more vehicles available in the United States with a correlation coefficient (R) of -0.303 and weighted average of 19.1%. Similarly, the statistical analysis conducted on geographies consisting of 493,637,379 people shows a mild positive correlation between the proportion of Immigrants from Western Europe and percentage of households with 3 or more vehicles available in the United States with a correlation coefficient (R) of 0.344 and weighted average of 19.5%, a difference of 2.4%.
3 or more Vehicles in Household Correlation Summary
| Measurement | Tsimshian | Immigrants from Western Europe |
| Minimum | 3.2% | 7.5% |
| Maximum | 36.7% | 61.3% |
| Range | 33.5% | 53.7% |
| Mean | 20.1% | 27.5% |
| Median | 19.4% | 26.7% |
| Interquartile 25% (IQ1) | 13.6% | 18.7% |
| Interquartile 75% (IQ3) | 28.4% | 32.6% |
| Interquartile Range (IQR) | 14.8% | 13.9% |
| Standard Deviation (Sample) | 9.1% | 11.3% |
| Standard Deviation (Population) | 8.8% | 11.2% |
Similar Demographics by 3 or more Vehicles in Household
Demographics Similar to Tsimshian by 3 or more Vehicles in Household
In terms of 3 or more vehicles in household, the demographic groups most similar to Tsimshian are Kenyan (19.1%, a difference of 0.030%), Serbian (19.1%, a difference of 0.040%), Immigrants from Moldova (19.1%, a difference of 0.080%), South American Indian (19.1%, a difference of 0.10%), and Immigrants from Zimbabwe (19.1%, a difference of 0.11%).
| Demographics | Rating | Rank | 3 or more Vehicles in Household |
| Immigrants | Sweden | 29.0 /100 | #186 | Fair 19.2% |
| Immigrants | Hong Kong | 28.3 /100 | #187 | Fair 19.2% |
| Immigrants | Kuwait | 26.1 /100 | #188 | Fair 19.1% |
| Indians (Asian) | 26.0 /100 | #189 | Fair 19.1% |
| Immigrants | Zimbabwe | 25.5 /100 | #190 | Fair 19.1% |
| South American Indians | 25.4 /100 | #191 | Fair 19.1% |
| Kenyans | 24.7 /100 | #192 | Fair 19.1% |
| Tsimshian | 24.4 /100 | #193 | Fair 19.1% |
| Serbians | 24.0 /100 | #194 | Fair 19.1% |
| Immigrants | Moldova | 23.6 /100 | #195 | Fair 19.1% |
| Central American Indians | 22.2 /100 | #196 | Fair 19.0% |
| Immigrants | Japan | 22.0 /100 | #197 | Fair 19.0% |
| Egyptians | 19.5 /100 | #198 | Poor 19.0% |
| Immigrants | Norway | 19.0 /100 | #199 | Poor 19.0% |
| Argentineans | 18.2 /100 | #200 | Poor 18.9% |
Demographics Similar to Immigrants from Western Europe by 3 or more Vehicles in Household
In terms of 3 or more vehicles in household, the demographic groups most similar to Immigrants from Western Europe are Kiowa (19.5%, a difference of 0.18%), Iraqi (19.6%, a difference of 0.21%), Immigrants from Northern Europe (19.5%, a difference of 0.23%), Immigrants from South Africa (19.5%, a difference of 0.24%), and Immigrants from Denmark (19.6%, a difference of 0.34%).
| Demographics | Rating | Rank | 3 or more Vehicles in Household |
| Yugoslavians | 62.9 /100 | #164 | Good 19.7% |
| Immigrants | Costa Rica | 61.9 /100 | #165 | Good 19.7% |
| Immigrants | Cameroon | 60.9 /100 | #166 | Good 19.7% |
| Ukrainians | 58.9 /100 | #167 | Average 19.6% |
| Peruvians | 58.8 /100 | #168 | Average 19.6% |
| Immigrants | Denmark | 57.6 /100 | #169 | Average 19.6% |
| Iraqis | 56.0 /100 | #170 | Average 19.6% |
| Immigrants | Western Europe | 53.2 /100 | #171 | Average 19.5% |
| Kiowa | 50.9 /100 | #172 | Average 19.5% |
| Immigrants | Northern Europe | 50.2 /100 | #173 | Average 19.5% |
| Immigrants | South Africa | 50.0 /100 | #174 | Average 19.5% |
| Syrians | 47.0 /100 | #175 | Average 19.5% |
| Iroquois | 46.0 /100 | #176 | Average 19.4% |
| Immigrants | Peru | 41.1 /100 | #177 | Average 19.4% |
| Immigrants | Syria | 40.3 /100 | #178 | Average 19.4% |