Tsimshian vs Apache In Labor Force | Age 20-64
COMPARE
Tsimshian
Apache
In Labor Force | Age 20-64
In Labor Force | Age 20-64 Comparison
Tsimshian
Apache
78.7%
IN LABOR FORCE | AGE 20-64
0.4/ 100
METRIC RATING
259th/ 347
METRIC RANK
73.7%
IN LABOR FORCE | AGE 20-64
0.0/ 100
METRIC RATING
334th/ 347
METRIC RANK
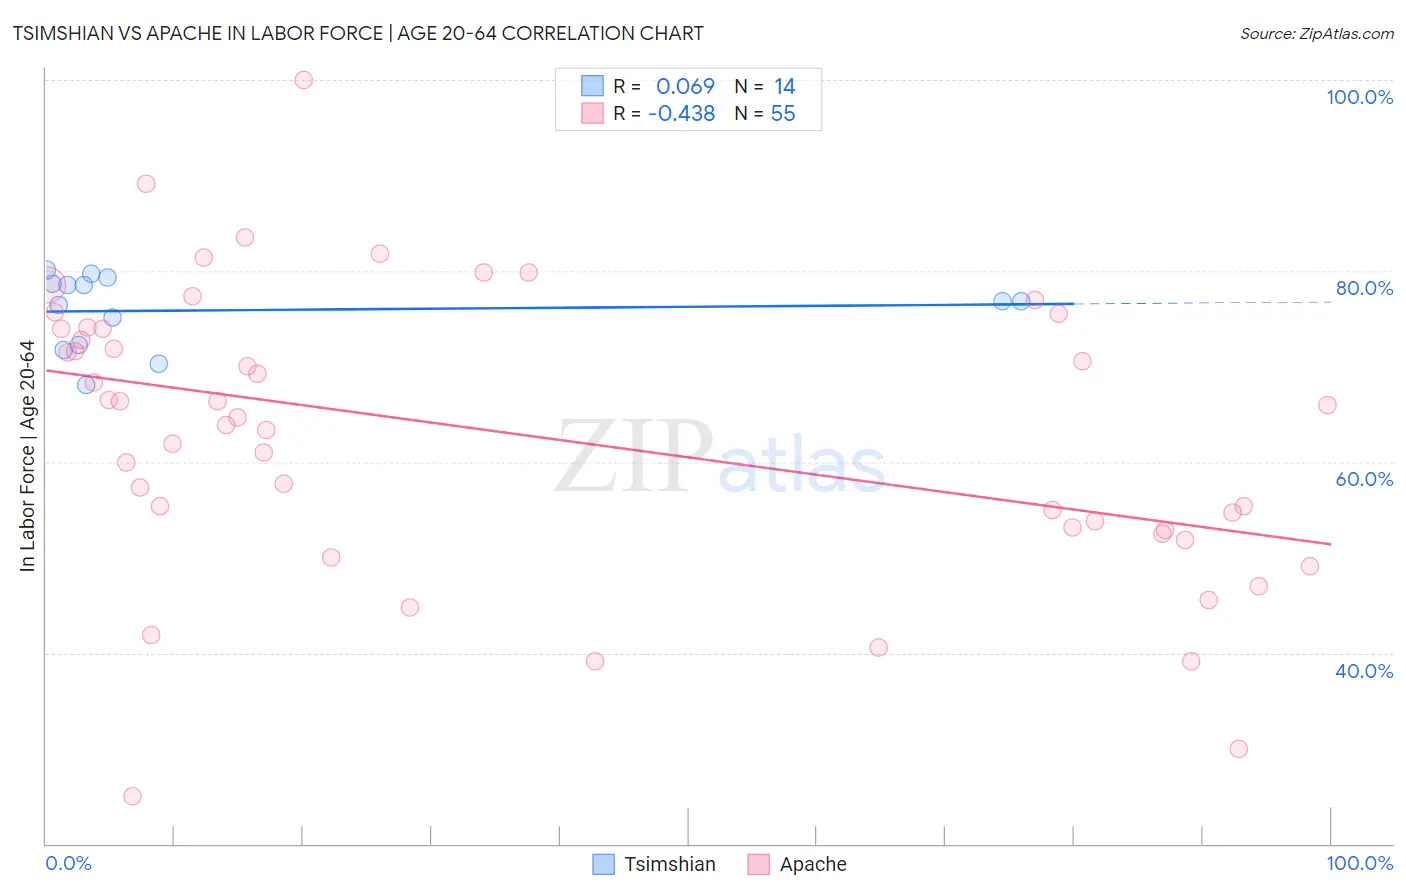
Tsimshian vs Apache In Labor Force | Age 20-64 Correlation Chart
The statistical analysis conducted on geographies consisting of 15,626,183 people shows a slight positive correlation between the proportion of Tsimshian and labor force participation rate among population between the ages 20 and 64 in the United States with a correlation coefficient (R) of 0.069 and weighted average of 78.7%. Similarly, the statistical analysis conducted on geographies consisting of 231,122,783 people shows a moderate negative correlation between the proportion of Apache and labor force participation rate among population between the ages 20 and 64 in the United States with a correlation coefficient (R) of -0.438 and weighted average of 73.7%, a difference of 6.8%.
In Labor Force | Age 20-64 Correlation Summary
| Measurement | Tsimshian | Apache |
| Minimum | 68.1% | 25.0% |
| Maximum | 80.1% | 100.0% |
| Range | 12.0% | 75.0% |
| Mean | 75.9% | 62.9% |
| Median | 76.8% | 64.7% |
| Interquartile 25% (IQ1) | 72.3% | 52.8% |
| Interquartile 75% (IQ3) | 78.7% | 74.0% |
| Interquartile Range (IQR) | 6.4% | 21.2% |
| Standard Deviation (Sample) | 3.8% | 15.1% |
| Standard Deviation (Population) | 3.7% | 15.0% |
Similar Demographics by In Labor Force | Age 20-64
Demographics Similar to Tsimshian by In Labor Force | Age 20-64
In terms of in labor force | age 20-64, the demographic groups most similar to Tsimshian are Immigrants from Guatemala (78.7%, a difference of 0.030%), Guatemalan (78.7%, a difference of 0.040%), Hawaiian (78.7%, a difference of 0.050%), Celtic (78.7%, a difference of 0.050%), and Immigrants from Lebanon (78.7%, a difference of 0.070%).
| Demographics | Rating | Rank | In Labor Force | Age 20-64 |
| Immigrants | Honduras | 0.6 /100 | #252 | Tragic 78.7% |
| Basques | 0.5 /100 | #253 | Tragic 78.7% |
| Immigrants | Lebanon | 0.5 /100 | #254 | Tragic 78.7% |
| Hawaiians | 0.5 /100 | #255 | Tragic 78.7% |
| Celtics | 0.5 /100 | #256 | Tragic 78.7% |
| Guatemalans | 0.4 /100 | #257 | Tragic 78.7% |
| Immigrants | Guatemala | 0.4 /100 | #258 | Tragic 78.7% |
| Tsimshian | 0.4 /100 | #259 | Tragic 78.7% |
| Immigrants | Fiji | 0.3 /100 | #260 | Tragic 78.6% |
| Whites/Caucasians | 0.2 /100 | #261 | Tragic 78.5% |
| Fijians | 0.1 /100 | #262 | Tragic 78.4% |
| Pennsylvania Germans | 0.1 /100 | #263 | Tragic 78.4% |
| Spaniards | 0.1 /100 | #264 | Tragic 78.4% |
| British West Indians | 0.1 /100 | #265 | Tragic 78.4% |
| Bahamians | 0.1 /100 | #266 | Tragic 78.4% |
Demographics Similar to Apache by In Labor Force | Age 20-64
In terms of in labor force | age 20-64, the demographic groups most similar to Apache are Ute (73.7%, a difference of 0.020%), Native/Alaskan (73.9%, a difference of 0.30%), Crow (73.3%, a difference of 0.52%), Yup'ik (73.2%, a difference of 0.64%), and Puerto Rican (73.1%, a difference of 0.85%).
| Demographics | Rating | Rank | In Labor Force | Age 20-64 |
| Sioux | 0.0 /100 | #327 | Tragic 75.0% |
| Kiowa | 0.0 /100 | #328 | Tragic 75.0% |
| Cheyenne | 0.0 /100 | #329 | Tragic 74.8% |
| Colville | 0.0 /100 | #330 | Tragic 74.8% |
| Paiute | 0.0 /100 | #331 | Tragic 74.7% |
| Arapaho | 0.0 /100 | #332 | Tragic 74.4% |
| Natives/Alaskans | 0.0 /100 | #333 | Tragic 73.9% |
| Apache | 0.0 /100 | #334 | Tragic 73.7% |
| Ute | 0.0 /100 | #335 | Tragic 73.7% |
| Crow | 0.0 /100 | #336 | Tragic 73.3% |
| Yup'ik | 0.0 /100 | #337 | Tragic 73.2% |
| Puerto Ricans | 0.0 /100 | #338 | Tragic 73.1% |
| Houma | 0.0 /100 | #339 | Tragic 72.7% |
| Pueblo | 0.0 /100 | #340 | Tragic 72.6% |
| Immigrants | Yemen | 0.0 /100 | #341 | Tragic 72.3% |