Tsimshian vs Apache Median Female Earnings
COMPARE
Tsimshian
Apache
Median Female Earnings
Median Female Earnings Comparison
Tsimshian
Apache
$39,530
MEDIAN FEMALE EARNINGS
41.4/ 100
METRIC RATING
181st/ 347
METRIC RANK
$34,895
MEDIAN FEMALE EARNINGS
0.0/ 100
METRIC RATING
314th/ 347
METRIC RANK
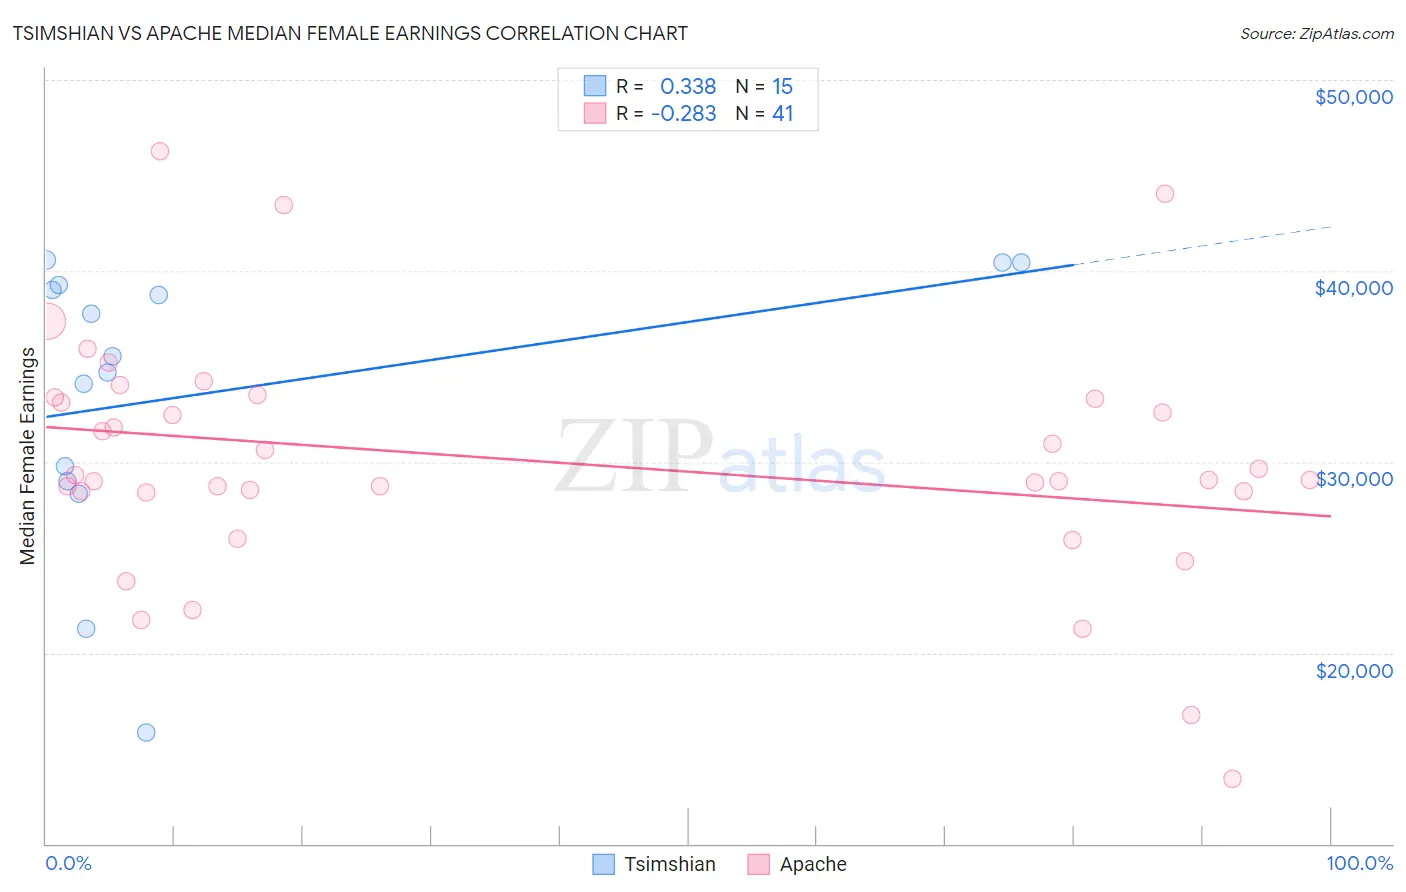
Tsimshian vs Apache Median Female Earnings Correlation Chart
The statistical analysis conducted on geographies consisting of 15,624,755 people shows a mild positive correlation between the proportion of Tsimshian and median female earnings in the United States with a correlation coefficient (R) of 0.338 and weighted average of $39,530. Similarly, the statistical analysis conducted on geographies consisting of 230,997,872 people shows a weak negative correlation between the proportion of Apache and median female earnings in the United States with a correlation coefficient (R) of -0.283 and weighted average of $34,895, a difference of 13.3%.
Median Female Earnings Correlation Summary
| Measurement | Tsimshian | Apache |
| Minimum | $15,833 | $13,381 |
| Maximum | $40,588 | $46,250 |
| Range | $24,755 | $32,869 |
| Mean | $33,643 | $30,090 |
| Median | $35,500 | $29,044 |
| Interquartile 25% (IQ1) | $28,977 | $28,433 |
| Interquartile 75% (IQ3) | $39,276 | $33,369 |
| Interquartile Range (IQR) | $10,299 | $4,936 |
| Standard Deviation (Sample) | $7,485 | $6,387 |
| Standard Deviation (Population) | $7,232 | $6,309 |
Similar Demographics by Median Female Earnings
Demographics Similar to Tsimshian by Median Female Earnings
In terms of median female earnings, the demographic groups most similar to Tsimshian are Immigrants from Kenya ($39,535, a difference of 0.010%), Tlingit-Haida ($39,513, a difference of 0.050%), Hungarian ($39,510, a difference of 0.050%), Immigrants from Germany ($39,603, a difference of 0.18%), and European ($39,457, a difference of 0.19%).
| Demographics | Rating | Rank | Median Female Earnings |
| South Americans | 50.0 /100 | #174 | Average $39,698 |
| Immigrants | South America | 47.2 /100 | #175 | Average $39,643 |
| Nigerians | 47.0 /100 | #176 | Average $39,641 |
| Costa Ricans | 46.1 /100 | #177 | Average $39,622 |
| Slavs | 45.6 /100 | #178 | Average $39,613 |
| Immigrants | Germany | 45.1 /100 | #179 | Average $39,603 |
| Immigrants | Kenya | 41.6 /100 | #180 | Average $39,535 |
| Tsimshian | 41.4 /100 | #181 | Average $39,530 |
| Tlingit-Haida | 40.5 /100 | #182 | Average $39,513 |
| Hungarians | 40.3 /100 | #183 | Average $39,510 |
| Europeans | 37.7 /100 | #184 | Fair $39,457 |
| Immigrants | West Indies | 36.9 /100 | #185 | Fair $39,441 |
| Colombians | 36.9 /100 | #186 | Fair $39,439 |
| Swedes | 36.0 /100 | #187 | Fair $39,421 |
| Bermudans | 35.9 /100 | #188 | Fair $39,418 |
Demographics Similar to Apache by Median Female Earnings
In terms of median female earnings, the demographic groups most similar to Apache are Cuban ($34,942, a difference of 0.13%), Yaqui ($34,943, a difference of 0.14%), Ute ($34,960, a difference of 0.19%), Pennsylvania German ($34,802, a difference of 0.27%), and Chippewa ($35,003, a difference of 0.31%).
| Demographics | Rating | Rank | Median Female Earnings |
| Sioux | 0.0 /100 | #307 | Tragic $35,063 |
| Immigrants | Bahamas | 0.0 /100 | #308 | Tragic $35,027 |
| Hondurans | 0.0 /100 | #309 | Tragic $35,013 |
| Chippewa | 0.0 /100 | #310 | Tragic $35,003 |
| Ute | 0.0 /100 | #311 | Tragic $34,960 |
| Yaqui | 0.0 /100 | #312 | Tragic $34,943 |
| Cubans | 0.0 /100 | #313 | Tragic $34,942 |
| Apache | 0.0 /100 | #314 | Tragic $34,895 |
| Pennsylvania Germans | 0.0 /100 | #315 | Tragic $34,802 |
| Cherokee | 0.0 /100 | #316 | Tragic $34,742 |
| Potawatomi | 0.0 /100 | #317 | Tragic $34,739 |
| Immigrants | Yemen | 0.0 /100 | #318 | Tragic $34,693 |
| Shoshone | 0.0 /100 | #319 | Tragic $34,677 |
| Immigrants | Honduras | 0.0 /100 | #320 | Tragic $34,647 |
| Hispanics or Latinos | 0.0 /100 | #321 | Tragic $34,421 |