South American Indian vs Cree 3 or more Vehicles in Household
COMPARE
South American Indian
Cree
3 or more Vehicles in Household
3 or more Vehicles in Household Comparison
South American Indians
Cree
19.1%
3 OR MORE VEHICLES IN HOUSEHOLD
25.4/ 100
METRIC RATING
191st/ 347
METRIC RANK
21.0%
3 OR MORE VEHICLES IN HOUSEHOLD
98.4/ 100
METRIC RATING
96th/ 347
METRIC RANK
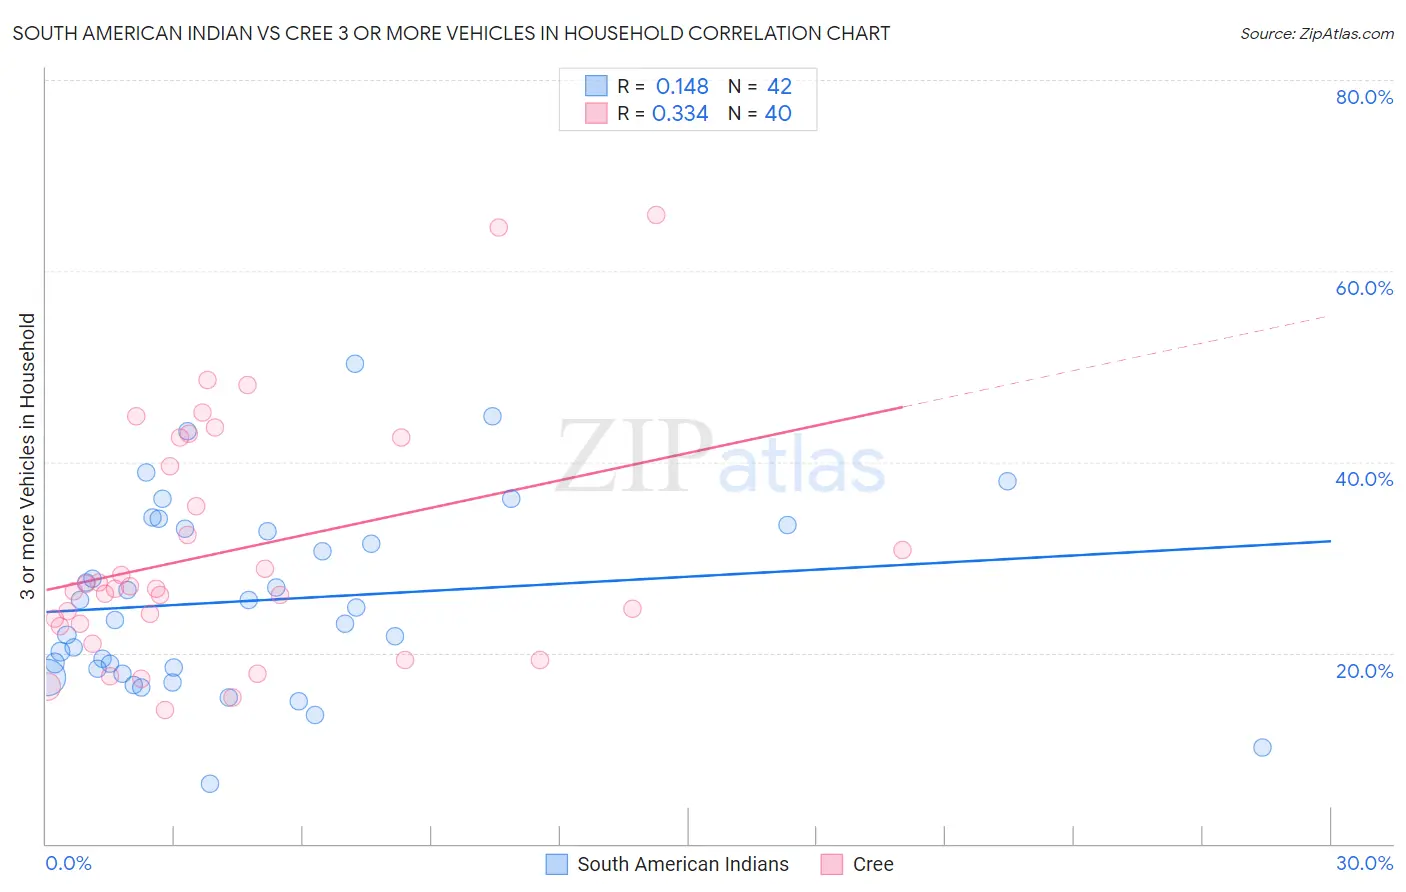
South American Indian vs Cree 3 or more Vehicles in Household Correlation Chart
The statistical analysis conducted on geographies consisting of 164,522,375 people shows a poor positive correlation between the proportion of South American Indians and percentage of households with 3 or more vehicles available in the United States with a correlation coefficient (R) of 0.148 and weighted average of 19.1%. Similarly, the statistical analysis conducted on geographies consisting of 76,210,632 people shows a mild positive correlation between the proportion of Cree and percentage of households with 3 or more vehicles available in the United States with a correlation coefficient (R) of 0.334 and weighted average of 21.0%, a difference of 10.0%.
3 or more Vehicles in Household Correlation Summary
| Measurement | South American Indian | Cree |
| Minimum | 6.3% | 14.0% |
| Maximum | 50.2% | 65.8% |
| Range | 43.9% | 51.8% |
| Mean | 25.5% | 30.6% |
| Median | 24.1% | 26.7% |
| Interquartile 25% (IQ1) | 18.3% | 22.9% |
| Interquartile 75% (IQ3) | 33.0% | 41.0% |
| Interquartile Range (IQR) | 14.7% | 18.1% |
| Standard Deviation (Sample) | 9.8% | 12.6% |
| Standard Deviation (Population) | 9.6% | 12.4% |
Similar Demographics by 3 or more Vehicles in Household
Demographics Similar to South American Indians by 3 or more Vehicles in Household
In terms of 3 or more vehicles in household, the demographic groups most similar to South American Indians are Immigrants from Zimbabwe (19.1%, a difference of 0.010%), Kenyan (19.1%, a difference of 0.060%), Immigrants from Kuwait (19.1%, a difference of 0.070%), Indian (Asian) (19.1%, a difference of 0.070%), and Tsimshian (19.1%, a difference of 0.10%).
| Demographics | Rating | Rank | 3 or more Vehicles in Household |
| Latvians | 35.7 /100 | #184 | Fair 19.3% |
| Immigrants | Sri Lanka | 30.7 /100 | #185 | Fair 19.2% |
| Immigrants | Sweden | 29.0 /100 | #186 | Fair 19.2% |
| Immigrants | Hong Kong | 28.3 /100 | #187 | Fair 19.2% |
| Immigrants | Kuwait | 26.1 /100 | #188 | Fair 19.1% |
| Indians (Asian) | 26.0 /100 | #189 | Fair 19.1% |
| Immigrants | Zimbabwe | 25.5 /100 | #190 | Fair 19.1% |
| South American Indians | 25.4 /100 | #191 | Fair 19.1% |
| Kenyans | 24.7 /100 | #192 | Fair 19.1% |
| Tsimshian | 24.4 /100 | #193 | Fair 19.1% |
| Serbians | 24.0 /100 | #194 | Fair 19.1% |
| Immigrants | Moldova | 23.6 /100 | #195 | Fair 19.1% |
| Central American Indians | 22.2 /100 | #196 | Fair 19.0% |
| Immigrants | Japan | 22.0 /100 | #197 | Fair 19.0% |
| Egyptians | 19.5 /100 | #198 | Poor 19.0% |
Demographics Similar to Cree by 3 or more Vehicles in Household
In terms of 3 or more vehicles in household, the demographic groups most similar to Cree are Pakistani (21.0%, a difference of 0.090%), Canadian (21.0%, a difference of 0.11%), Hmong (21.0%, a difference of 0.16%), Alaska Native (21.0%, a difference of 0.17%), and Comanche (21.0%, a difference of 0.21%).
| Demographics | Rating | Rank | 3 or more Vehicles in Household |
| Marshallese | 99.2 /100 | #89 | Exceptional 21.3% |
| Immigrants | Afghanistan | 99.1 /100 | #90 | Exceptional 21.2% |
| Belgians | 98.9 /100 | #91 | Exceptional 21.2% |
| Apache | 98.9 /100 | #92 | Exceptional 21.2% |
| Immigrants | Indonesia | 98.8 /100 | #93 | Exceptional 21.1% |
| Immigrants | Cambodia | 98.6 /100 | #94 | Exceptional 21.1% |
| Pakistanis | 98.5 /100 | #95 | Exceptional 21.0% |
| Cree | 98.4 /100 | #96 | Exceptional 21.0% |
| Canadians | 98.3 /100 | #97 | Exceptional 21.0% |
| Hmong | 98.2 /100 | #98 | Exceptional 21.0% |
| Alaska Natives | 98.2 /100 | #99 | Exceptional 21.0% |
| Comanche | 98.2 /100 | #100 | Exceptional 21.0% |
| Blackfeet | 97.9 /100 | #101 | Exceptional 20.9% |
| Seminole | 97.8 /100 | #102 | Exceptional 20.9% |
| Dutch West Indians | 97.8 /100 | #103 | Exceptional 20.9% |