Immigrants from Dominica vs Cree 3 or more Vehicles in Household
COMPARE
Immigrants from Dominica
Cree
3 or more Vehicles in Household
3 or more Vehicles in Household Comparison
Immigrants from Dominica
Cree
13.7%
3 OR MORE VEHICLES IN HOUSEHOLD
0.0/ 100
METRIC RATING
331st/ 347
METRIC RANK
21.0%
3 OR MORE VEHICLES IN HOUSEHOLD
98.4/ 100
METRIC RATING
96th/ 347
METRIC RANK
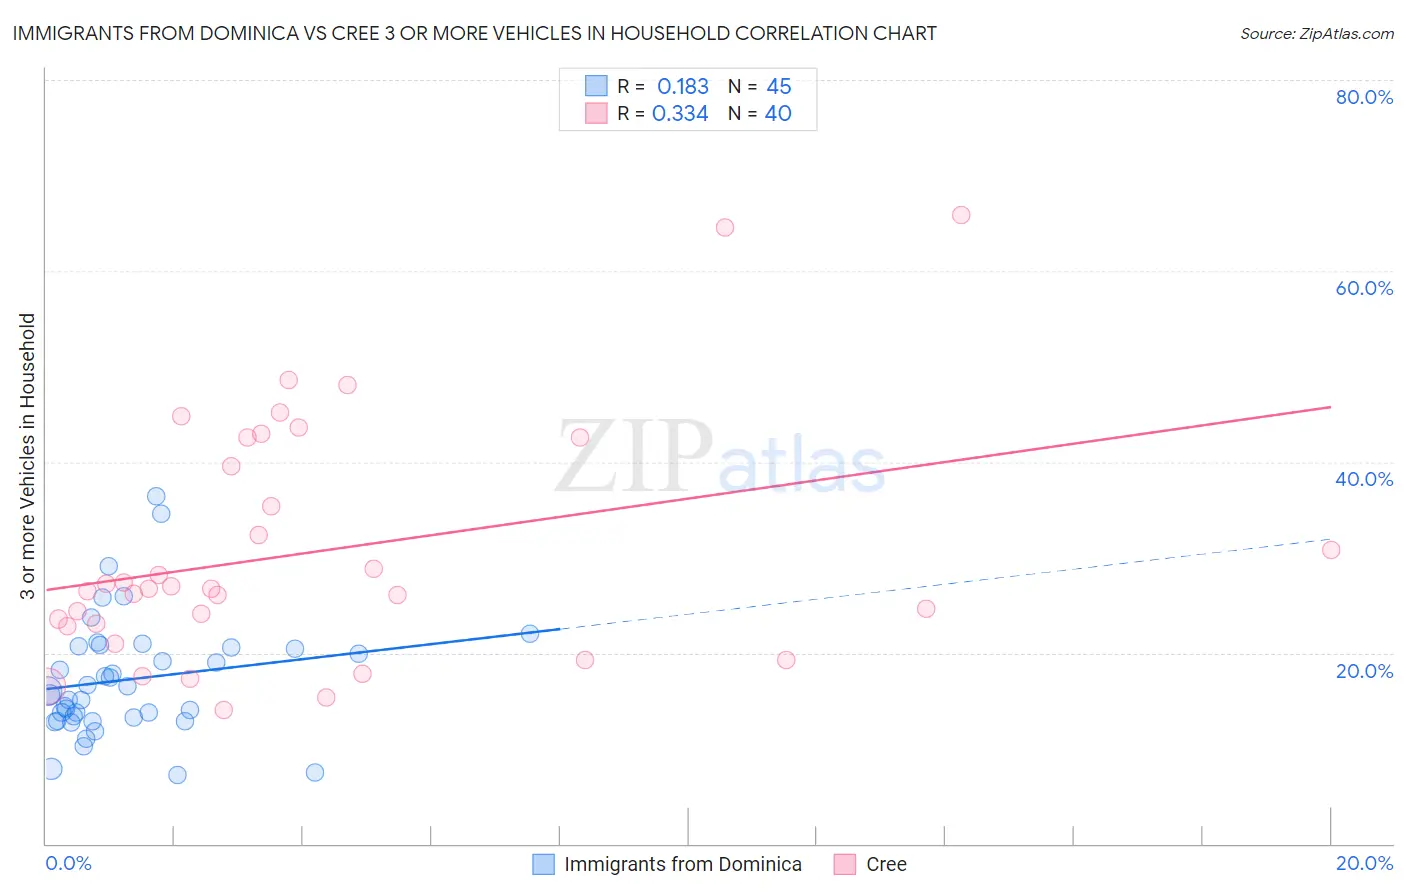
Immigrants from Dominica vs Cree 3 or more Vehicles in Household Correlation Chart
The statistical analysis conducted on geographies consisting of 83,774,399 people shows a poor positive correlation between the proportion of Immigrants from Dominica and percentage of households with 3 or more vehicles available in the United States with a correlation coefficient (R) of 0.183 and weighted average of 13.7%. Similarly, the statistical analysis conducted on geographies consisting of 76,210,632 people shows a mild positive correlation between the proportion of Cree and percentage of households with 3 or more vehicles available in the United States with a correlation coefficient (R) of 0.334 and weighted average of 21.0%, a difference of 53.2%.
3 or more Vehicles in Household Correlation Summary
| Measurement | Immigrants from Dominica | Cree |
| Minimum | 7.2% | 14.0% |
| Maximum | 36.4% | 65.8% |
| Range | 29.3% | 51.8% |
| Mean | 17.2% | 30.6% |
| Median | 16.0% | 26.7% |
| Interquartile 25% (IQ1) | 13.0% | 22.9% |
| Interquartile 75% (IQ3) | 20.6% | 41.0% |
| Interquartile Range (IQR) | 7.6% | 18.1% |
| Standard Deviation (Sample) | 6.2% | 12.6% |
| Standard Deviation (Population) | 6.2% | 12.4% |
Similar Demographics by 3 or more Vehicles in Household
Demographics Similar to Immigrants from Dominica by 3 or more Vehicles in Household
In terms of 3 or more vehicles in household, the demographic groups most similar to Immigrants from Dominica are West Indian (13.7%, a difference of 0.21%), Immigrants from Senegal (13.8%, a difference of 0.55%), Trinidadian and Tobagonian (13.6%, a difference of 0.71%), Immigrants from Cabo Verde (13.6%, a difference of 1.1%), and Immigrants from Albania (14.0%, a difference of 1.7%).
| Demographics | Rating | Rank | 3 or more Vehicles in Household |
| Immigrants | Yemen | 0.0 /100 | #324 | Tragic 14.2% |
| Senegalese | 0.0 /100 | #325 | Tragic 14.2% |
| Soviet Union | 0.0 /100 | #326 | Tragic 14.2% |
| Ecuadorians | 0.0 /100 | #327 | Tragic 14.1% |
| Immigrants | Albania | 0.0 /100 | #328 | Tragic 14.0% |
| Immigrants | Senegal | 0.0 /100 | #329 | Tragic 13.8% |
| West Indians | 0.0 /100 | #330 | Tragic 13.7% |
| Immigrants | Dominica | 0.0 /100 | #331 | Tragic 13.7% |
| Trinidadians and Tobagonians | 0.0 /100 | #332 | Tragic 13.6% |
| Immigrants | Cabo Verde | 0.0 /100 | #333 | Tragic 13.6% |
| Immigrants | Ecuador | 0.0 /100 | #334 | Tragic 13.4% |
| Immigrants | Trinidad and Tobago | 0.0 /100 | #335 | Tragic 13.3% |
| Barbadians | 0.0 /100 | #336 | Tragic 12.6% |
| Immigrants | Bangladesh | 0.0 /100 | #337 | Tragic 12.5% |
| Vietnamese | 0.0 /100 | #338 | Tragic 12.5% |
Demographics Similar to Cree by 3 or more Vehicles in Household
In terms of 3 or more vehicles in household, the demographic groups most similar to Cree are Pakistani (21.0%, a difference of 0.090%), Canadian (21.0%, a difference of 0.11%), Hmong (21.0%, a difference of 0.16%), Alaska Native (21.0%, a difference of 0.17%), and Comanche (21.0%, a difference of 0.21%).
| Demographics | Rating | Rank | 3 or more Vehicles in Household |
| Marshallese | 99.2 /100 | #89 | Exceptional 21.3% |
| Immigrants | Afghanistan | 99.1 /100 | #90 | Exceptional 21.2% |
| Belgians | 98.9 /100 | #91 | Exceptional 21.2% |
| Apache | 98.9 /100 | #92 | Exceptional 21.2% |
| Immigrants | Indonesia | 98.8 /100 | #93 | Exceptional 21.1% |
| Immigrants | Cambodia | 98.6 /100 | #94 | Exceptional 21.1% |
| Pakistanis | 98.5 /100 | #95 | Exceptional 21.0% |
| Cree | 98.4 /100 | #96 | Exceptional 21.0% |
| Canadians | 98.3 /100 | #97 | Exceptional 21.0% |
| Hmong | 98.2 /100 | #98 | Exceptional 21.0% |
| Alaska Natives | 98.2 /100 | #99 | Exceptional 21.0% |
| Comanche | 98.2 /100 | #100 | Exceptional 21.0% |
| Blackfeet | 97.9 /100 | #101 | Exceptional 20.9% |
| Seminole | 97.8 /100 | #102 | Exceptional 20.9% |
| Dutch West Indians | 97.8 /100 | #103 | Exceptional 20.9% |