English vs Cree 3 or more Vehicles in Household
COMPARE
English
Cree
3 or more Vehicles in Household
3 or more Vehicles in Household Comparison
English
Cree
23.1%
3 OR MORE VEHICLES IN HOUSEHOLD
100.0/ 100
METRIC RATING
31st/ 347
METRIC RANK
21.0%
3 OR MORE VEHICLES IN HOUSEHOLD
98.4/ 100
METRIC RATING
96th/ 347
METRIC RANK
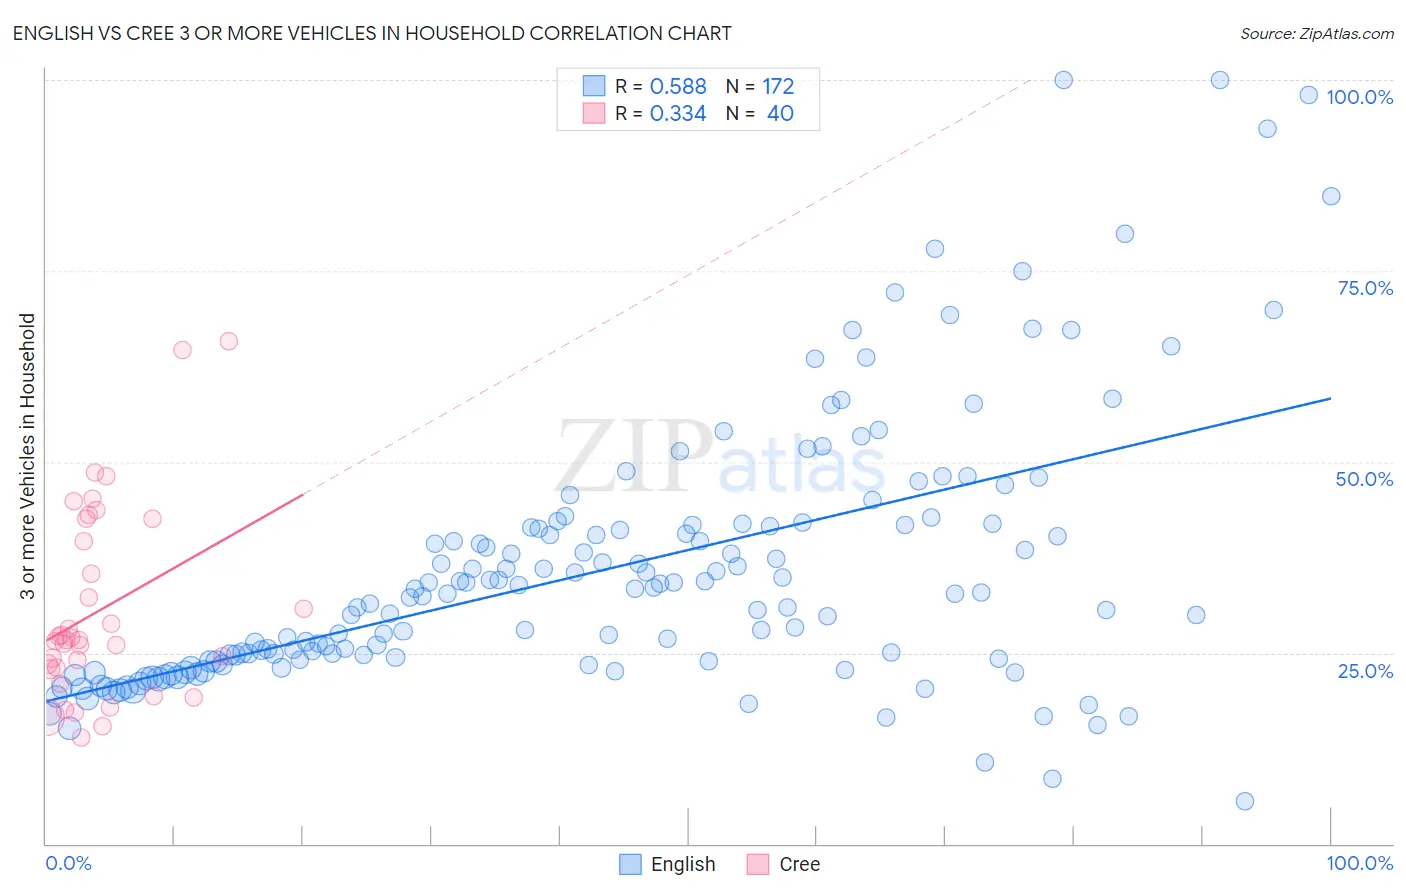
English vs Cree 3 or more Vehicles in Household Correlation Chart
The statistical analysis conducted on geographies consisting of 578,919,458 people shows a substantial positive correlation between the proportion of English and percentage of households with 3 or more vehicles available in the United States with a correlation coefficient (R) of 0.588 and weighted average of 23.1%. Similarly, the statistical analysis conducted on geographies consisting of 76,210,632 people shows a mild positive correlation between the proportion of Cree and percentage of households with 3 or more vehicles available in the United States with a correlation coefficient (R) of 0.334 and weighted average of 21.0%, a difference of 9.7%.
3 or more Vehicles in Household Correlation Summary
| Measurement | English | Cree |
| Minimum | 5.6% | 14.0% |
| Maximum | 100.0% | 65.8% |
| Range | 94.4% | 51.8% |
| Mean | 36.0% | 30.6% |
| Median | 32.8% | 26.7% |
| Interquartile 25% (IQ1) | 23.9% | 22.9% |
| Interquartile 75% (IQ3) | 41.7% | 41.0% |
| Interquartile Range (IQR) | 17.7% | 18.1% |
| Standard Deviation (Sample) | 17.5% | 12.6% |
| Standard Deviation (Population) | 17.5% | 12.4% |
Similar Demographics by 3 or more Vehicles in Household
Demographics Similar to English by 3 or more Vehicles in Household
In terms of 3 or more vehicles in household, the demographic groups most similar to English are Pueblo (23.0%, a difference of 0.090%), Spanish American (23.0%, a difference of 0.15%), Immigrants from South Eastern Asia (23.1%, a difference of 0.19%), Swiss (23.0%, a difference of 0.20%), and Choctaw (23.0%, a difference of 0.22%).
| Demographics | Rating | Rank | 3 or more Vehicles in Household |
| Sri Lankans | 100.0 /100 | #24 | Exceptional 23.6% |
| Immigrants | Central America | 100.0 /100 | #25 | Exceptional 23.4% |
| Mexican American Indians | 100.0 /100 | #26 | Exceptional 23.3% |
| Guamanians/Chamorros | 100.0 /100 | #27 | Exceptional 23.2% |
| Lumbee | 100.0 /100 | #28 | Exceptional 23.1% |
| Spanish | 100.0 /100 | #29 | Exceptional 23.1% |
| Immigrants | South Eastern Asia | 100.0 /100 | #30 | Exceptional 23.1% |
| English | 100.0 /100 | #31 | Exceptional 23.1% |
| Pueblo | 100.0 /100 | #32 | Exceptional 23.0% |
| Spanish Americans | 100.0 /100 | #33 | Exceptional 23.0% |
| Swiss | 100.0 /100 | #34 | Exceptional 23.0% |
| Choctaw | 100.0 /100 | #35 | Exceptional 23.0% |
| Cherokee | 100.0 /100 | #36 | Exceptional 23.0% |
| Swedes | 100.0 /100 | #37 | Exceptional 23.0% |
| Dutch | 100.0 /100 | #38 | Exceptional 22.9% |
Demographics Similar to Cree by 3 or more Vehicles in Household
In terms of 3 or more vehicles in household, the demographic groups most similar to Cree are Pakistani (21.0%, a difference of 0.090%), Canadian (21.0%, a difference of 0.11%), Hmong (21.0%, a difference of 0.16%), Alaska Native (21.0%, a difference of 0.17%), and Comanche (21.0%, a difference of 0.21%).
| Demographics | Rating | Rank | 3 or more Vehicles in Household |
| Marshallese | 99.2 /100 | #89 | Exceptional 21.3% |
| Immigrants | Afghanistan | 99.1 /100 | #90 | Exceptional 21.2% |
| Belgians | 98.9 /100 | #91 | Exceptional 21.2% |
| Apache | 98.9 /100 | #92 | Exceptional 21.2% |
| Immigrants | Indonesia | 98.8 /100 | #93 | Exceptional 21.1% |
| Immigrants | Cambodia | 98.6 /100 | #94 | Exceptional 21.1% |
| Pakistanis | 98.5 /100 | #95 | Exceptional 21.0% |
| Cree | 98.4 /100 | #96 | Exceptional 21.0% |
| Canadians | 98.3 /100 | #97 | Exceptional 21.0% |
| Hmong | 98.2 /100 | #98 | Exceptional 21.0% |
| Alaska Natives | 98.2 /100 | #99 | Exceptional 21.0% |
| Comanche | 98.2 /100 | #100 | Exceptional 21.0% |
| Blackfeet | 97.9 /100 | #101 | Exceptional 20.9% |
| Seminole | 97.8 /100 | #102 | Exceptional 20.9% |
| Dutch West Indians | 97.8 /100 | #103 | Exceptional 20.9% |