Immigrants from Eastern Europe vs Cree 3 or more Vehicles in Household
COMPARE
Immigrants from Eastern Europe
Cree
3 or more Vehicles in Household
3 or more Vehicles in Household Comparison
Immigrants from Eastern Europe
Cree
17.4%
3 OR MORE VEHICLES IN HOUSEHOLD
0.3/ 100
METRIC RATING
280th/ 347
METRIC RANK
21.0%
3 OR MORE VEHICLES IN HOUSEHOLD
98.4/ 100
METRIC RATING
96th/ 347
METRIC RANK
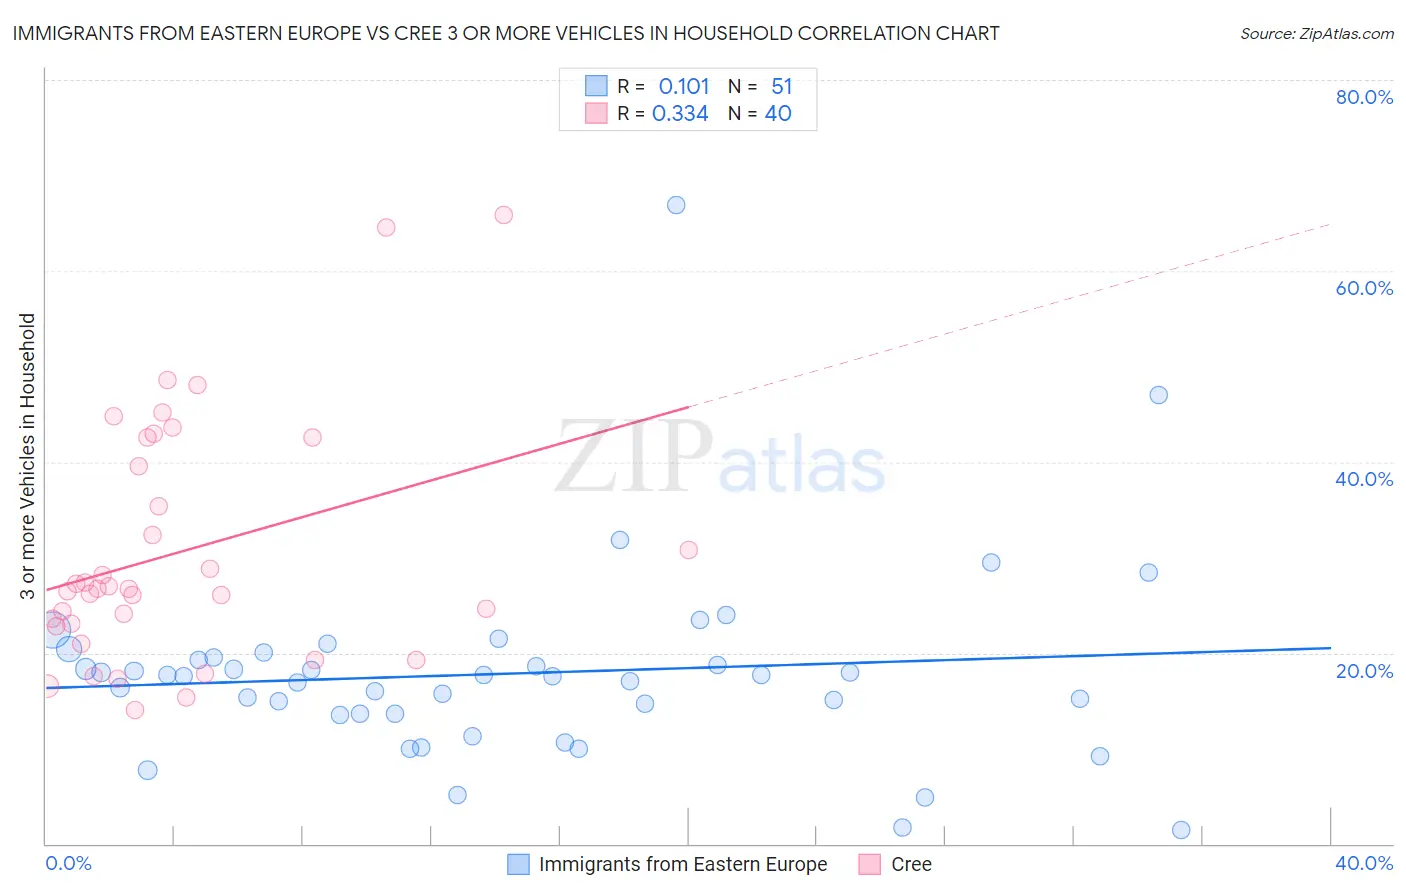
Immigrants from Eastern Europe vs Cree 3 or more Vehicles in Household Correlation Chart
The statistical analysis conducted on geographies consisting of 475,306,541 people shows a poor positive correlation between the proportion of Immigrants from Eastern Europe and percentage of households with 3 or more vehicles available in the United States with a correlation coefficient (R) of 0.101 and weighted average of 17.4%. Similarly, the statistical analysis conducted on geographies consisting of 76,210,632 people shows a mild positive correlation between the proportion of Cree and percentage of households with 3 or more vehicles available in the United States with a correlation coefficient (R) of 0.334 and weighted average of 21.0%, a difference of 20.8%.
3 or more Vehicles in Household Correlation Summary
| Measurement | Immigrants from Eastern Europe | Cree |
| Minimum | 1.4% | 14.0% |
| Maximum | 66.9% | 65.8% |
| Range | 65.5% | 51.8% |
| Mean | 17.8% | 30.6% |
| Median | 17.6% | 26.7% |
| Interquartile 25% (IQ1) | 13.6% | 22.9% |
| Interquartile 75% (IQ3) | 19.5% | 41.0% |
| Interquartile Range (IQR) | 5.9% | 18.1% |
| Standard Deviation (Sample) | 10.3% | 12.6% |
| Standard Deviation (Population) | 10.2% | 12.4% |
Similar Demographics by 3 or more Vehicles in Household
Demographics Similar to Immigrants from Eastern Europe by 3 or more Vehicles in Household
In terms of 3 or more vehicles in household, the demographic groups most similar to Immigrants from Eastern Europe are Immigrants from Kazakhstan (17.4%, a difference of 0.040%), Immigrants from Latvia (17.4%, a difference of 0.040%), Immigrants from Bahamas (17.4%, a difference of 0.050%), Brazilian (17.4%, a difference of 0.14%), and Okinawan (17.4%, a difference of 0.29%).
| Demographics | Rating | Rank | 3 or more Vehicles in Household |
| Immigrants | Sudan | 0.5 /100 | #273 | Tragic 17.6% |
| Immigrants | Bosnia and Herzegovina | 0.5 /100 | #274 | Tragic 17.5% |
| Immigrants | Ukraine | 0.4 /100 | #275 | Tragic 17.5% |
| Okinawans | 0.4 /100 | #276 | Tragic 17.4% |
| Brazilians | 0.4 /100 | #277 | Tragic 17.4% |
| Immigrants | Bahamas | 0.3 /100 | #278 | Tragic 17.4% |
| Immigrants | Kazakhstan | 0.3 /100 | #279 | Tragic 17.4% |
| Immigrants | Eastern Europe | 0.3 /100 | #280 | Tragic 17.4% |
| Immigrants | Latvia | 0.3 /100 | #281 | Tragic 17.4% |
| Immigrants | Ireland | 0.3 /100 | #282 | Tragic 17.3% |
| Blacks/African Americans | 0.3 /100 | #283 | Tragic 17.3% |
| Immigrants | Colombia | 0.3 /100 | #284 | Tragic 17.3% |
| Immigrants | Croatia | 0.2 /100 | #285 | Tragic 17.2% |
| Menominee | 0.2 /100 | #286 | Tragic 17.2% |
| Immigrants | Brazil | 0.2 /100 | #287 | Tragic 17.1% |
Demographics Similar to Cree by 3 or more Vehicles in Household
In terms of 3 or more vehicles in household, the demographic groups most similar to Cree are Pakistani (21.0%, a difference of 0.090%), Canadian (21.0%, a difference of 0.11%), Hmong (21.0%, a difference of 0.16%), Alaska Native (21.0%, a difference of 0.17%), and Comanche (21.0%, a difference of 0.21%).
| Demographics | Rating | Rank | 3 or more Vehicles in Household |
| Marshallese | 99.2 /100 | #89 | Exceptional 21.3% |
| Immigrants | Afghanistan | 99.1 /100 | #90 | Exceptional 21.2% |
| Belgians | 98.9 /100 | #91 | Exceptional 21.2% |
| Apache | 98.9 /100 | #92 | Exceptional 21.2% |
| Immigrants | Indonesia | 98.8 /100 | #93 | Exceptional 21.1% |
| Immigrants | Cambodia | 98.6 /100 | #94 | Exceptional 21.1% |
| Pakistanis | 98.5 /100 | #95 | Exceptional 21.0% |
| Cree | 98.4 /100 | #96 | Exceptional 21.0% |
| Canadians | 98.3 /100 | #97 | Exceptional 21.0% |
| Hmong | 98.2 /100 | #98 | Exceptional 21.0% |
| Alaska Natives | 98.2 /100 | #99 | Exceptional 21.0% |
| Comanche | 98.2 /100 | #100 | Exceptional 21.0% |
| Blackfeet | 97.9 /100 | #101 | Exceptional 20.9% |
| Seminole | 97.8 /100 | #102 | Exceptional 20.9% |
| Dutch West Indians | 97.8 /100 | #103 | Exceptional 20.9% |