South American Indian vs Cheyenne 3 or more Vehicles in Household
COMPARE
South American Indian
Cheyenne
3 or more Vehicles in Household
3 or more Vehicles in Household Comparison
South American Indians
Cheyenne
19.1%
3 OR MORE VEHICLES IN HOUSEHOLD
25.4/ 100
METRIC RATING
191st/ 347
METRIC RANK
22.7%
3 OR MORE VEHICLES IN HOUSEHOLD
100.0/ 100
METRIC RATING
44th/ 347
METRIC RANK
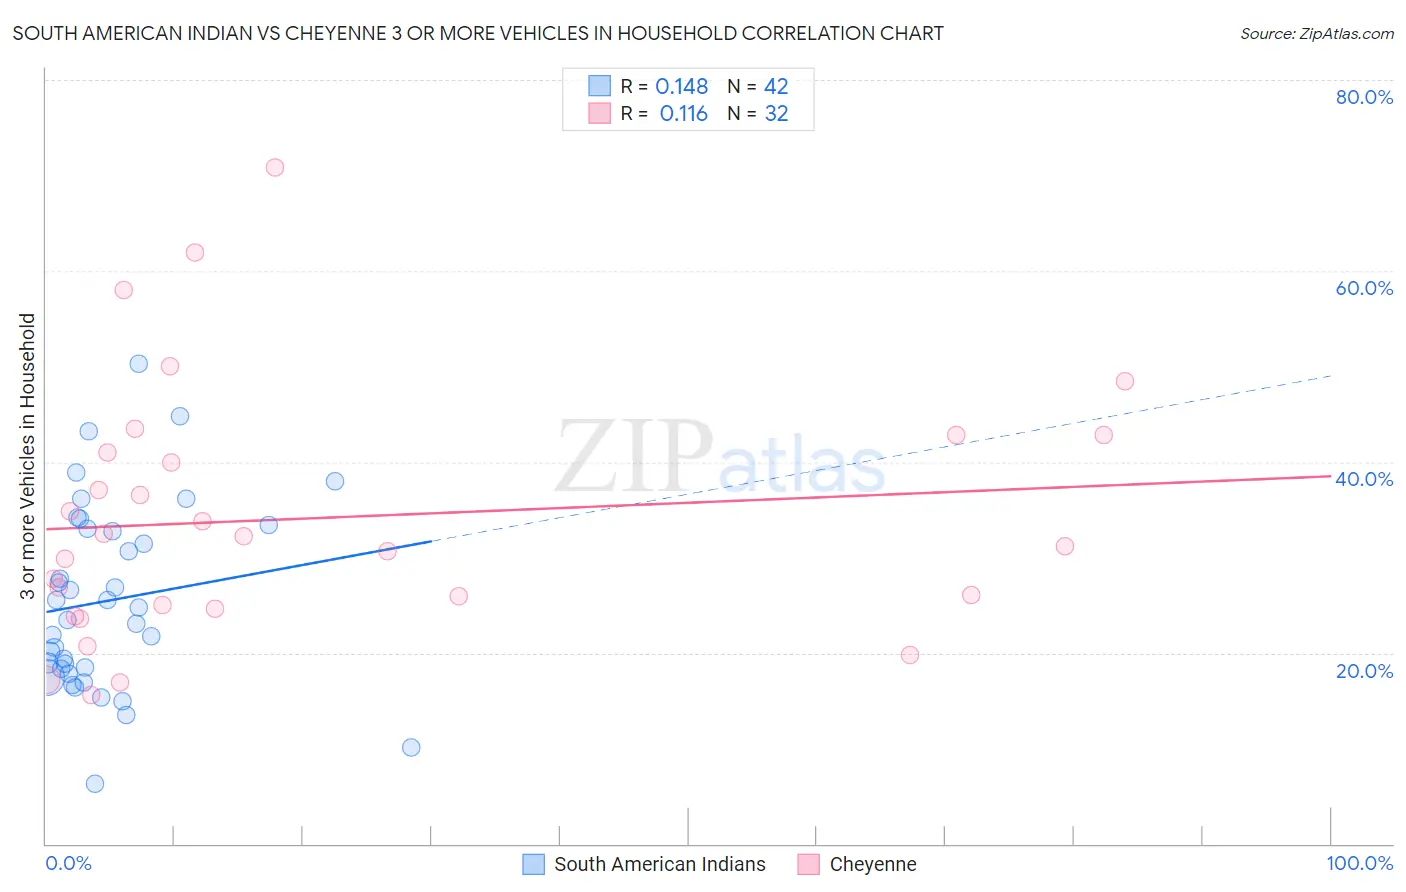
South American Indian vs Cheyenne 3 or more Vehicles in Household Correlation Chart
The statistical analysis conducted on geographies consisting of 164,522,375 people shows a poor positive correlation between the proportion of South American Indians and percentage of households with 3 or more vehicles available in the United States with a correlation coefficient (R) of 0.148 and weighted average of 19.1%. Similarly, the statistical analysis conducted on geographies consisting of 80,705,917 people shows a poor positive correlation between the proportion of Cheyenne and percentage of households with 3 or more vehicles available in the United States with a correlation coefficient (R) of 0.116 and weighted average of 22.7%, a difference of 18.8%.
3 or more Vehicles in Household Correlation Summary
| Measurement | South American Indian | Cheyenne |
| Minimum | 6.3% | 15.6% |
| Maximum | 50.2% | 70.8% |
| Range | 43.9% | 55.2% |
| Mean | 25.5% | 34.1% |
| Median | 24.1% | 31.7% |
| Interquartile 25% (IQ1) | 18.3% | 24.8% |
| Interquartile 75% (IQ3) | 33.0% | 41.9% |
| Interquartile Range (IQR) | 14.7% | 17.1% |
| Standard Deviation (Sample) | 9.8% | 13.3% |
| Standard Deviation (Population) | 9.6% | 13.1% |
Similar Demographics by 3 or more Vehicles in Household
Demographics Similar to South American Indians by 3 or more Vehicles in Household
In terms of 3 or more vehicles in household, the demographic groups most similar to South American Indians are Immigrants from Zimbabwe (19.1%, a difference of 0.010%), Kenyan (19.1%, a difference of 0.060%), Immigrants from Kuwait (19.1%, a difference of 0.070%), Indian (Asian) (19.1%, a difference of 0.070%), and Tsimshian (19.1%, a difference of 0.10%).
| Demographics | Rating | Rank | 3 or more Vehicles in Household |
| Latvians | 35.7 /100 | #184 | Fair 19.3% |
| Immigrants | Sri Lanka | 30.7 /100 | #185 | Fair 19.2% |
| Immigrants | Sweden | 29.0 /100 | #186 | Fair 19.2% |
| Immigrants | Hong Kong | 28.3 /100 | #187 | Fair 19.2% |
| Immigrants | Kuwait | 26.1 /100 | #188 | Fair 19.1% |
| Indians (Asian) | 26.0 /100 | #189 | Fair 19.1% |
| Immigrants | Zimbabwe | 25.5 /100 | #190 | Fair 19.1% |
| South American Indians | 25.4 /100 | #191 | Fair 19.1% |
| Kenyans | 24.7 /100 | #192 | Fair 19.1% |
| Tsimshian | 24.4 /100 | #193 | Fair 19.1% |
| Serbians | 24.0 /100 | #194 | Fair 19.1% |
| Immigrants | Moldova | 23.6 /100 | #195 | Fair 19.1% |
| Central American Indians | 22.2 /100 | #196 | Fair 19.0% |
| Immigrants | Japan | 22.0 /100 | #197 | Fair 19.0% |
| Egyptians | 19.5 /100 | #198 | Poor 19.0% |
Demographics Similar to Cheyenne by 3 or more Vehicles in Household
In terms of 3 or more vehicles in household, the demographic groups most similar to Cheyenne are Ute (22.7%, a difference of 0.10%), Osage (22.7%, a difference of 0.13%), German (22.7%, a difference of 0.25%), Native/Alaskan (22.7%, a difference of 0.25%), and American (22.6%, a difference of 0.29%).
| Demographics | Rating | Rank | 3 or more Vehicles in Household |
| Swedes | 100.0 /100 | #37 | Exceptional 23.0% |
| Dutch | 100.0 /100 | #38 | Exceptional 22.9% |
| Yaqui | 100.0 /100 | #39 | Exceptional 22.9% |
| Europeans | 100.0 /100 | #40 | Exceptional 22.9% |
| Germans | 100.0 /100 | #41 | Exceptional 22.7% |
| Natives/Alaskans | 100.0 /100 | #42 | Exceptional 22.7% |
| Osage | 100.0 /100 | #43 | Exceptional 22.7% |
| Cheyenne | 100.0 /100 | #44 | Exceptional 22.7% |
| Ute | 100.0 /100 | #45 | Exceptional 22.7% |
| Americans | 100.0 /100 | #46 | Exceptional 22.6% |
| Malaysians | 100.0 /100 | #47 | Exceptional 22.6% |
| Scottish | 100.0 /100 | #48 | Exceptional 22.6% |
| Scotch-Irish | 100.0 /100 | #49 | Exceptional 22.6% |
| Sioux | 100.0 /100 | #50 | Exceptional 22.6% |
| Whites/Caucasians | 100.0 /100 | #51 | Exceptional 22.6% |