South American Indian vs Cree Nursery School
COMPARE
South American Indian
Cree
Nursery School
Nursery School Comparison
South American Indians
Cree
97.8%
NURSERY SCHOOL
8.0/ 100
METRIC RATING
214th/ 347
METRIC RANK
98.3%
NURSERY SCHOOL
97.7/ 100
METRIC RATING
103rd/ 347
METRIC RANK
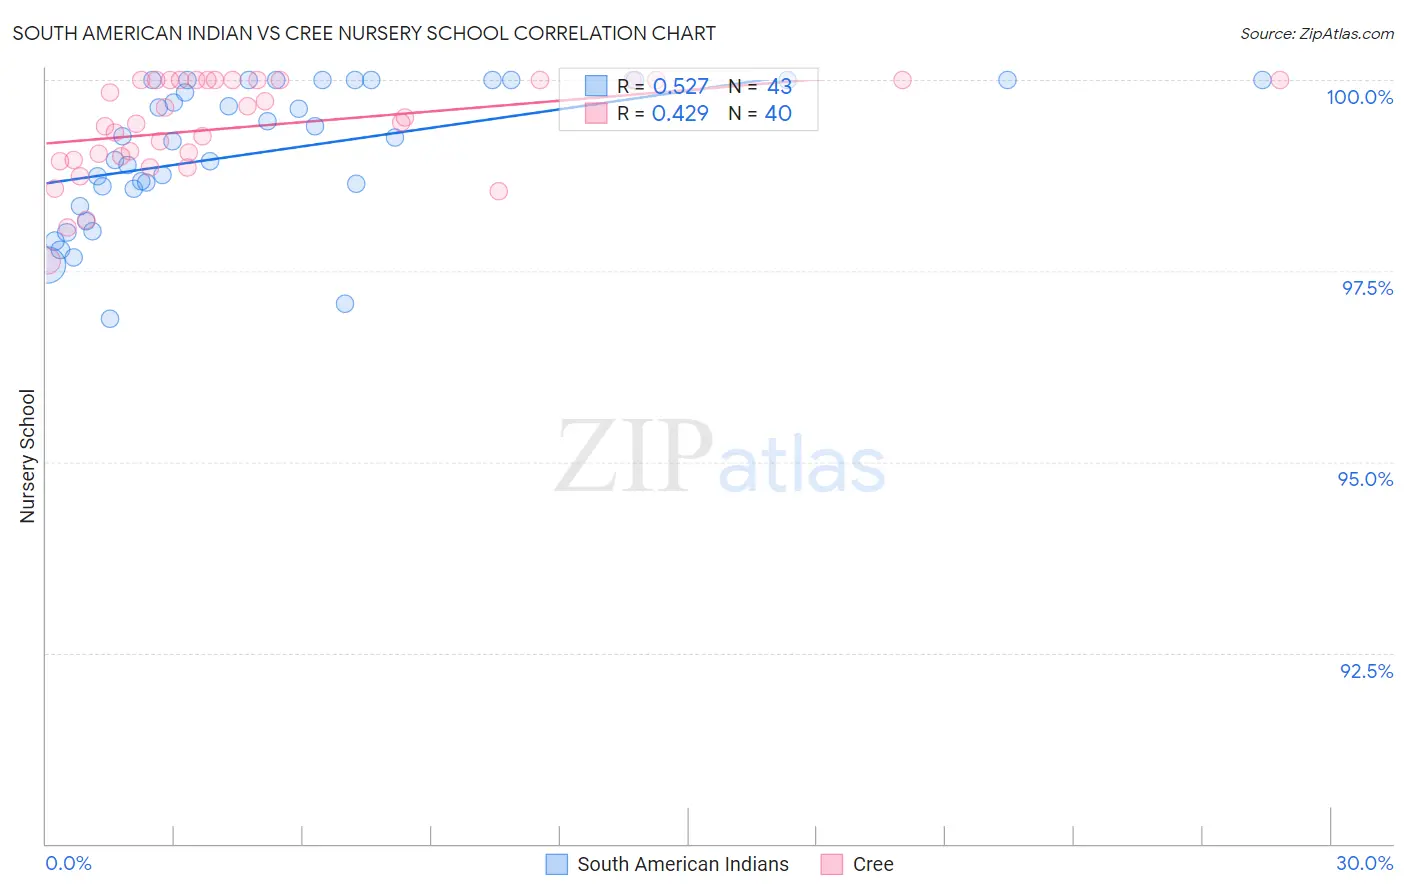
South American Indian vs Cree Nursery School Correlation Chart
The statistical analysis conducted on geographies consisting of 164,573,401 people shows a substantial positive correlation between the proportion of South American Indians and percentage of population with at least nursery school education in the United States with a correlation coefficient (R) of 0.527 and weighted average of 97.8%. Similarly, the statistical analysis conducted on geographies consisting of 76,204,399 people shows a moderate positive correlation between the proportion of Cree and percentage of population with at least nursery school education in the United States with a correlation coefficient (R) of 0.429 and weighted average of 98.3%, a difference of 0.46%.
Nursery School Correlation Summary
| Measurement | South American Indian | Cree |
| Minimum | 96.9% | 97.6% |
| Maximum | 100.0% | 100.0% |
| Range | 3.1% | 2.4% |
| Mean | 99.1% | 99.4% |
| Median | 99.2% | 99.5% |
| Interquartile 25% (IQ1) | 98.6% | 99.0% |
| Interquartile 75% (IQ3) | 100.0% | 100.0% |
| Interquartile Range (IQR) | 1.4% | 1.0% |
| Standard Deviation (Sample) | 0.91% | 0.63% |
| Standard Deviation (Population) | 0.89% | 0.63% |
Similar Demographics by Nursery School
Demographics Similar to South American Indians by Nursery School
In terms of nursery school, the demographic groups most similar to South American Indians are Moroccan (97.8%, a difference of 0.0%), Immigrants from Bahamas (97.8%, a difference of 0.010%), Bahamian (97.8%, a difference of 0.010%), Uruguayan (97.8%, a difference of 0.010%), and Immigrants from Oceania (97.8%, a difference of 0.020%).
| Demographics | Rating | Rank | Nursery School |
| Africans | 15.4 /100 | #207 | Poor 97.9% |
| Immigrants | Northern Africa | 11.7 /100 | #208 | Poor 97.8% |
| Costa Ricans | 11.3 /100 | #209 | Poor 97.8% |
| Immigrants | Oceania | 10.2 /100 | #210 | Poor 97.8% |
| Laotians | 9.8 /100 | #211 | Tragic 97.8% |
| Immigrants | Bahamas | 8.6 /100 | #212 | Tragic 97.8% |
| Moroccans | 8.3 /100 | #213 | Tragic 97.8% |
| South American Indians | 8.0 /100 | #214 | Tragic 97.8% |
| Bahamians | 7.4 /100 | #215 | Tragic 97.8% |
| Uruguayans | 7.1 /100 | #216 | Tragic 97.8% |
| Samoans | 6.3 /100 | #217 | Tragic 97.8% |
| Immigrants | Panama | 5.3 /100 | #218 | Tragic 97.8% |
| Immigrants | Morocco | 5.1 /100 | #219 | Tragic 97.8% |
| Immigrants | Zaire | 4.4 /100 | #220 | Tragic 97.8% |
| Tongans | 4.3 /100 | #221 | Tragic 97.8% |
Demographics Similar to Cree by Nursery School
In terms of nursery school, the demographic groups most similar to Cree are Immigrants from Ireland (98.3%, a difference of 0.0%), Puget Sound Salish (98.3%, a difference of 0.010%), Romanian (98.3%, a difference of 0.010%), Bhutanese (98.2%, a difference of 0.010%), and Turkish (98.2%, a difference of 0.010%).
| Demographics | Rating | Rank | Nursery School |
| Cypriots | 98.3 /100 | #96 | Exceptional 98.3% |
| Immigrants | Nonimmigrants | 98.3 /100 | #97 | Exceptional 98.3% |
| Choctaw | 98.3 /100 | #98 | Exceptional 98.3% |
| Colville | 98.2 /100 | #99 | Exceptional 98.3% |
| Puget Sound Salish | 98.0 /100 | #100 | Exceptional 98.3% |
| Romanians | 97.9 /100 | #101 | Exceptional 98.3% |
| Immigrants | Ireland | 97.7 /100 | #102 | Exceptional 98.3% |
| Cree | 97.7 /100 | #103 | Exceptional 98.3% |
| Bhutanese | 97.4 /100 | #104 | Exceptional 98.2% |
| Turks | 97.4 /100 | #105 | Exceptional 98.2% |
| Immigrants | Switzerland | 97.3 /100 | #106 | Exceptional 98.2% |
| Basques | 97.3 /100 | #107 | Exceptional 98.2% |
| Pima | 97.1 /100 | #108 | Exceptional 98.2% |
| German Russians | 97.1 /100 | #109 | Exceptional 98.2% |
| Immigrants | Singapore | 96.9 /100 | #110 | Exceptional 98.2% |