Immigrants from Malaysia vs Cree 3 or more Vehicles in Household
COMPARE
Immigrants from Malaysia
Cree
3 or more Vehicles in Household
3 or more Vehicles in Household Comparison
Immigrants from Malaysia
Cree
18.3%
3 OR MORE VEHICLES IN HOUSEHOLD
3.6/ 100
METRIC RATING
236th/ 347
METRIC RANK
21.0%
3 OR MORE VEHICLES IN HOUSEHOLD
98.4/ 100
METRIC RATING
96th/ 347
METRIC RANK
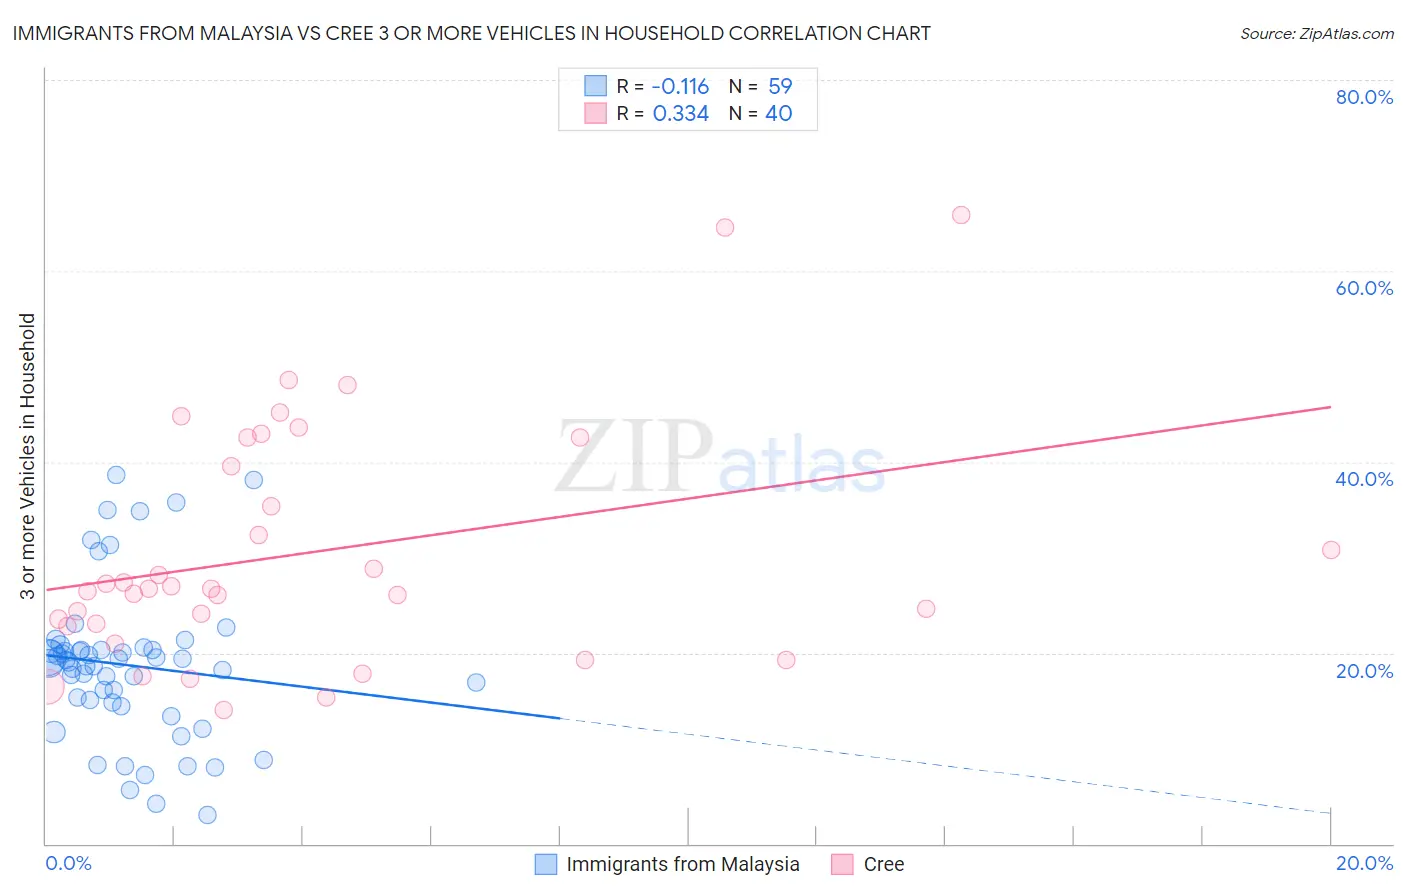
Immigrants from Malaysia vs Cree 3 or more Vehicles in Household Correlation Chart
The statistical analysis conducted on geographies consisting of 197,846,297 people shows a poor negative correlation between the proportion of Immigrants from Malaysia and percentage of households with 3 or more vehicles available in the United States with a correlation coefficient (R) of -0.116 and weighted average of 18.3%. Similarly, the statistical analysis conducted on geographies consisting of 76,210,632 people shows a mild positive correlation between the proportion of Cree and percentage of households with 3 or more vehicles available in the United States with a correlation coefficient (R) of 0.334 and weighted average of 21.0%, a difference of 14.9%.
3 or more Vehicles in Household Correlation Summary
| Measurement | Immigrants from Malaysia | Cree |
| Minimum | 3.0% | 14.0% |
| Maximum | 38.6% | 65.8% |
| Range | 35.6% | 51.8% |
| Mean | 18.7% | 30.6% |
| Median | 19.1% | 26.7% |
| Interquartile 25% (IQ1) | 14.8% | 22.9% |
| Interquartile 75% (IQ3) | 20.3% | 41.0% |
| Interquartile Range (IQR) | 5.5% | 18.1% |
| Standard Deviation (Sample) | 8.0% | 12.6% |
| Standard Deviation (Population) | 7.9% | 12.4% |
Similar Demographics by 3 or more Vehicles in Household
Demographics Similar to Immigrants from Malaysia by 3 or more Vehicles in Household
In terms of 3 or more vehicles in household, the demographic groups most similar to Immigrants from Malaysia are Indonesian (18.3%, a difference of 0.040%), Sierra Leonean (18.3%, a difference of 0.18%), Immigrants from Honduras (18.2%, a difference of 0.28%), Immigrants from Middle Africa (18.2%, a difference of 0.28%), and Immigrants from China (18.2%, a difference of 0.41%).
| Demographics | Rating | Rank | 3 or more Vehicles in Household |
| Immigrants | Switzerland | 5.0 /100 | #229 | Tragic 18.4% |
| Immigrants | Western Asia | 4.8 /100 | #230 | Tragic 18.4% |
| Immigrants | Belgium | 4.8 /100 | #231 | Tragic 18.4% |
| Immigrants | Uganda | 4.6 /100 | #232 | Tragic 18.4% |
| Hondurans | 4.6 /100 | #233 | Tragic 18.4% |
| Immigrants | North Macedonia | 4.4 /100 | #234 | Tragic 18.4% |
| Sierra Leoneans | 3.9 /100 | #235 | Tragic 18.3% |
| Immigrants | Malaysia | 3.6 /100 | #236 | Tragic 18.3% |
| Indonesians | 3.5 /100 | #237 | Tragic 18.3% |
| Immigrants | Honduras | 3.1 /100 | #238 | Tragic 18.2% |
| Immigrants | Middle Africa | 3.1 /100 | #239 | Tragic 18.2% |
| Immigrants | China | 2.9 /100 | #240 | Tragic 18.2% |
| Africans | 2.7 /100 | #241 | Tragic 18.2% |
| Hopi | 2.5 /100 | #242 | Tragic 18.2% |
| Immigrants | Europe | 2.4 /100 | #243 | Tragic 18.1% |
Demographics Similar to Cree by 3 or more Vehicles in Household
In terms of 3 or more vehicles in household, the demographic groups most similar to Cree are Pakistani (21.0%, a difference of 0.090%), Canadian (21.0%, a difference of 0.11%), Hmong (21.0%, a difference of 0.16%), Alaska Native (21.0%, a difference of 0.17%), and Comanche (21.0%, a difference of 0.21%).
| Demographics | Rating | Rank | 3 or more Vehicles in Household |
| Marshallese | 99.2 /100 | #89 | Exceptional 21.3% |
| Immigrants | Afghanistan | 99.1 /100 | #90 | Exceptional 21.2% |
| Belgians | 98.9 /100 | #91 | Exceptional 21.2% |
| Apache | 98.9 /100 | #92 | Exceptional 21.2% |
| Immigrants | Indonesia | 98.8 /100 | #93 | Exceptional 21.1% |
| Immigrants | Cambodia | 98.6 /100 | #94 | Exceptional 21.1% |
| Pakistanis | 98.5 /100 | #95 | Exceptional 21.0% |
| Cree | 98.4 /100 | #96 | Exceptional 21.0% |
| Canadians | 98.3 /100 | #97 | Exceptional 21.0% |
| Hmong | 98.2 /100 | #98 | Exceptional 21.0% |
| Alaska Natives | 98.2 /100 | #99 | Exceptional 21.0% |
| Comanche | 98.2 /100 | #100 | Exceptional 21.0% |
| Blackfeet | 97.9 /100 | #101 | Exceptional 20.9% |
| Seminole | 97.8 /100 | #102 | Exceptional 20.9% |
| Dutch West Indians | 97.8 /100 | #103 | Exceptional 20.9% |