Potawatomi vs Immigrants from Scotland In Labor Force | Age 30-34
COMPARE
Potawatomi
Immigrants from Scotland
In Labor Force | Age 30-34
In Labor Force | Age 30-34 Comparison
Potawatomi
Immigrants from Scotland
82.8%
IN LABOR FORCE | AGE 30-34
0.0/ 100
METRIC RATING
291st/ 347
METRIC RANK
85.1%
IN LABOR FORCE | AGE 30-34
94.9/ 100
METRIC RATING
111th/ 347
METRIC RANK
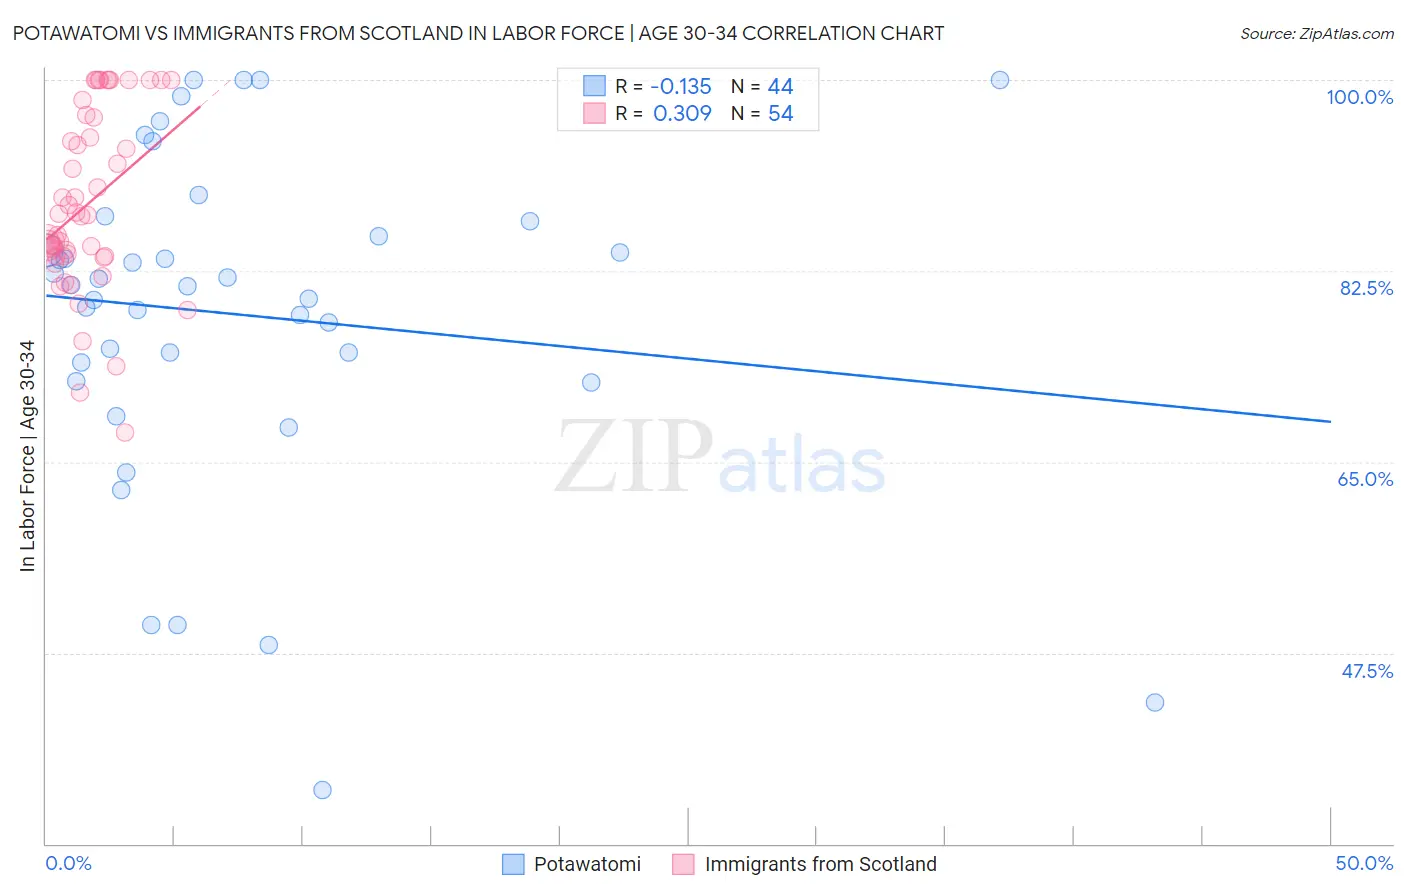
Potawatomi vs Immigrants from Scotland In Labor Force | Age 30-34 Correlation Chart
The statistical analysis conducted on geographies consisting of 117,760,740 people shows a poor negative correlation between the proportion of Potawatomi and labor force participation rate among population between the ages 30 and 34 in the United States with a correlation coefficient (R) of -0.135 and weighted average of 82.8%. Similarly, the statistical analysis conducted on geographies consisting of 196,354,267 people shows a mild positive correlation between the proportion of Immigrants from Scotland and labor force participation rate among population between the ages 30 and 34 in the United States with a correlation coefficient (R) of 0.309 and weighted average of 85.1%, a difference of 2.8%.
In Labor Force | Age 30-34 Correlation Summary
| Measurement | Potawatomi | Immigrants from Scotland |
| Minimum | 34.9% | 67.7% |
| Maximum | 100.0% | 100.0% |
| Range | 65.1% | 32.3% |
| Mean | 78.5% | 88.6% |
| Median | 81.2% | 87.6% |
| Interquartile 25% (IQ1) | 73.3% | 83.9% |
| Interquartile 75% (IQ3) | 86.4% | 96.5% |
| Interquartile Range (IQR) | 13.1% | 12.7% |
| Standard Deviation (Sample) | 15.3% | 8.2% |
| Standard Deviation (Population) | 15.2% | 8.1% |
Similar Demographics by In Labor Force | Age 30-34
Demographics Similar to Potawatomi by In Labor Force | Age 30-34
In terms of in labor force | age 30-34, the demographic groups most similar to Potawatomi are Blackfeet (82.8%, a difference of 0.020%), Black/African American (82.8%, a difference of 0.020%), Nepalese (82.7%, a difference of 0.080%), American (82.7%, a difference of 0.11%), and Pennsylvania German (82.6%, a difference of 0.23%).
| Demographics | Rating | Rank | In Labor Force | Age 30-34 |
| Immigrants | Belize | 0.0 /100 | #284 | Tragic 83.2% |
| Cree | 0.0 /100 | #285 | Tragic 83.2% |
| Immigrants | Latin America | 0.0 /100 | #286 | Tragic 83.1% |
| Native Hawaiians | 0.0 /100 | #287 | Tragic 83.0% |
| Central American Indians | 0.0 /100 | #288 | Tragic 83.0% |
| Hawaiians | 0.0 /100 | #289 | Tragic 83.0% |
| Blackfeet | 0.0 /100 | #290 | Tragic 82.8% |
| Potawatomi | 0.0 /100 | #291 | Tragic 82.8% |
| Blacks/African Americans | 0.0 /100 | #292 | Tragic 82.8% |
| Nepalese | 0.0 /100 | #293 | Tragic 82.7% |
| Americans | 0.0 /100 | #294 | Tragic 82.7% |
| Pennsylvania Germans | 0.0 /100 | #295 | Tragic 82.6% |
| Chippewa | 0.0 /100 | #296 | Tragic 82.6% |
| Comanche | 0.0 /100 | #297 | Tragic 82.6% |
| Aleuts | 0.0 /100 | #298 | Tragic 82.6% |
Demographics Similar to Immigrants from Scotland by In Labor Force | Age 30-34
In terms of in labor force | age 30-34, the demographic groups most similar to Immigrants from Scotland are Immigrants from Hungary (85.1%, a difference of 0.0%), Immigrants from Romania (85.1%, a difference of 0.010%), Yugoslavian (85.1%, a difference of 0.010%), Immigrants from South Central Asia (85.1%, a difference of 0.010%), and Egyptian (85.1%, a difference of 0.010%).
| Demographics | Rating | Rank | In Labor Force | Age 30-34 |
| Immigrants | Ghana | 96.5 /100 | #104 | Exceptional 85.2% |
| Alsatians | 96.3 /100 | #105 | Exceptional 85.2% |
| Immigrants | Middle Africa | 96.3 /100 | #106 | Exceptional 85.2% |
| Immigrants | Northern Africa | 96.3 /100 | #107 | Exceptional 85.2% |
| Immigrants | Zimbabwe | 95.8 /100 | #108 | Exceptional 85.1% |
| Argentineans | 95.8 /100 | #109 | Exceptional 85.1% |
| Immigrants | South Africa | 95.3 /100 | #110 | Exceptional 85.1% |
| Immigrants | Scotland | 94.9 /100 | #111 | Exceptional 85.1% |
| Immigrants | Hungary | 94.8 /100 | #112 | Exceptional 85.1% |
| Immigrants | Romania | 94.7 /100 | #113 | Exceptional 85.1% |
| Yugoslavians | 94.7 /100 | #114 | Exceptional 85.1% |
| Immigrants | South Central Asia | 94.6 /100 | #115 | Exceptional 85.1% |
| Egyptians | 94.5 /100 | #116 | Exceptional 85.1% |
| Immigrants | Denmark | 94.3 /100 | #117 | Exceptional 85.1% |
| Immigrants | Malaysia | 94.2 /100 | #118 | Exceptional 85.1% |