Immigrants from Middle Africa vs Paiute 3 or more Vehicles in Household
COMPARE
Immigrants from Middle Africa
Paiute
3 or more Vehicles in Household
3 or more Vehicles in Household Comparison
Immigrants from Middle Africa
Paiute
18.2%
3 OR MORE VEHICLES IN HOUSEHOLD
3.1/ 100
METRIC RATING
239th/ 347
METRIC RANK
23.8%
3 OR MORE VEHICLES IN HOUSEHOLD
100.0/ 100
METRIC RATING
20th/ 347
METRIC RANK
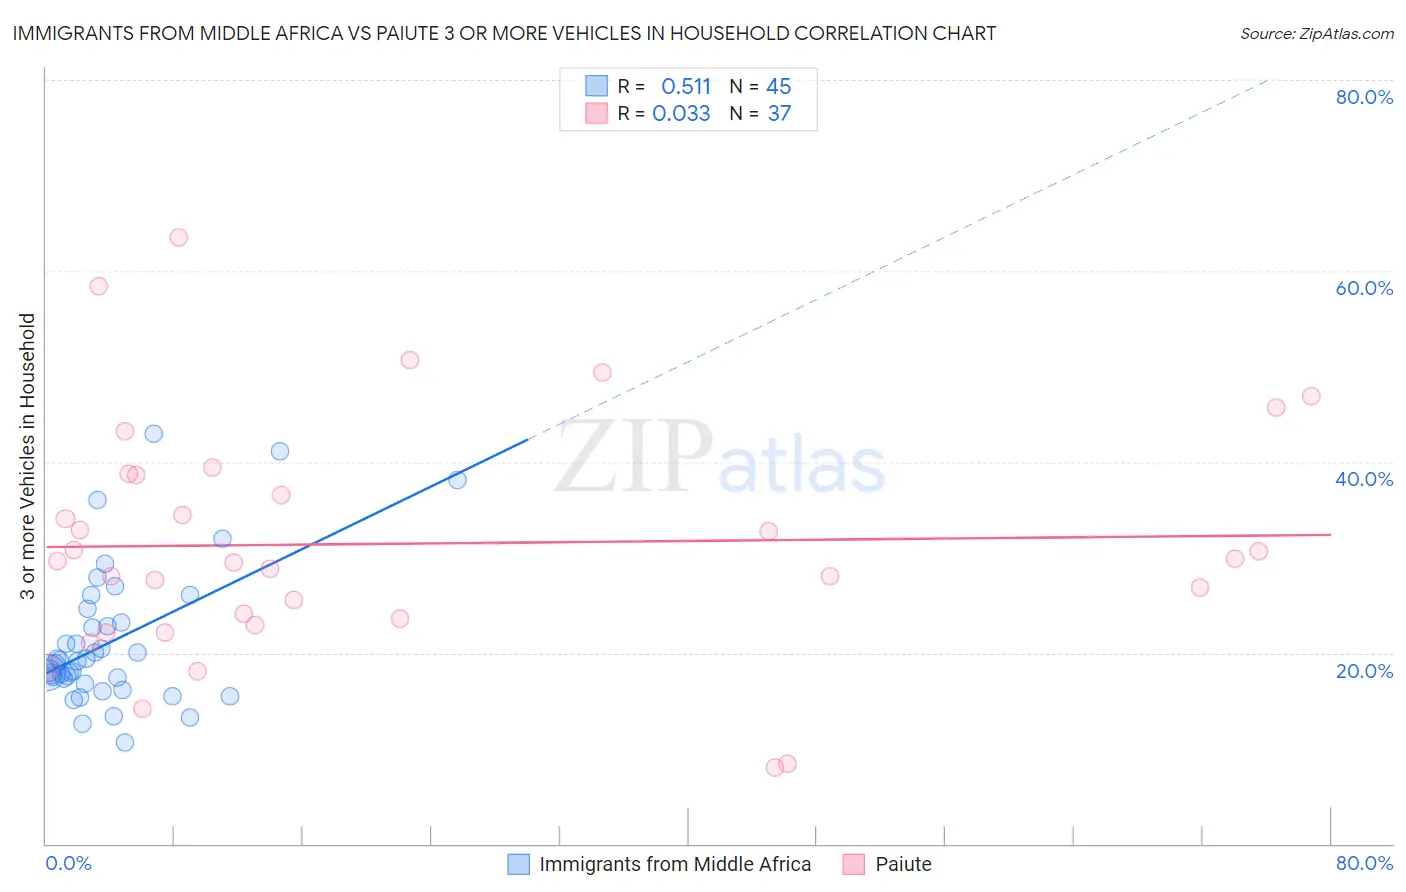
Immigrants from Middle Africa vs Paiute 3 or more Vehicles in Household Correlation Chart
The statistical analysis conducted on geographies consisting of 202,639,411 people shows a substantial positive correlation between the proportion of Immigrants from Middle Africa and percentage of households with 3 or more vehicles available in the United States with a correlation coefficient (R) of 0.511 and weighted average of 18.2%. Similarly, the statistical analysis conducted on geographies consisting of 58,394,165 people shows no correlation between the proportion of Paiute and percentage of households with 3 or more vehicles available in the United States with a correlation coefficient (R) of 0.033 and weighted average of 23.8%, a difference of 30.5%.
3 or more Vehicles in Household Correlation Summary
| Measurement | Immigrants from Middle Africa | Paiute |
| Minimum | 10.6% | 7.9% |
| Maximum | 42.9% | 63.5% |
| Range | 32.3% | 55.5% |
| Mean | 21.2% | 31.4% |
| Median | 19.1% | 29.6% |
| Interquartile 25% (IQ1) | 17.0% | 23.2% |
| Interquartile 75% (IQ3) | 23.8% | 38.7% |
| Interquartile Range (IQR) | 6.8% | 15.5% |
| Standard Deviation (Sample) | 7.3% | 12.4% |
| Standard Deviation (Population) | 7.2% | 12.3% |
Similar Demographics by 3 or more Vehicles in Household
Demographics Similar to Immigrants from Middle Africa by 3 or more Vehicles in Household
In terms of 3 or more vehicles in household, the demographic groups most similar to Immigrants from Middle Africa are Immigrants from Honduras (18.2%, a difference of 0.010%), Immigrants from China (18.2%, a difference of 0.13%), Indonesian (18.3%, a difference of 0.24%), Immigrants from Malaysia (18.3%, a difference of 0.28%), and African (18.2%, a difference of 0.32%).
| Demographics | Rating | Rank | 3 or more Vehicles in Household |
| Immigrants | Uganda | 4.6 /100 | #232 | Tragic 18.4% |
| Hondurans | 4.6 /100 | #233 | Tragic 18.4% |
| Immigrants | North Macedonia | 4.4 /100 | #234 | Tragic 18.4% |
| Sierra Leoneans | 3.9 /100 | #235 | Tragic 18.3% |
| Immigrants | Malaysia | 3.6 /100 | #236 | Tragic 18.3% |
| Indonesians | 3.5 /100 | #237 | Tragic 18.3% |
| Immigrants | Honduras | 3.1 /100 | #238 | Tragic 18.2% |
| Immigrants | Middle Africa | 3.1 /100 | #239 | Tragic 18.2% |
| Immigrants | China | 2.9 /100 | #240 | Tragic 18.2% |
| Africans | 2.7 /100 | #241 | Tragic 18.2% |
| Hopi | 2.5 /100 | #242 | Tragic 18.2% |
| Immigrants | Europe | 2.4 /100 | #243 | Tragic 18.1% |
| Mongolians | 2.3 /100 | #244 | Tragic 18.1% |
| Immigrants | Belize | 2.1 /100 | #245 | Tragic 18.1% |
| Immigrants | Australia | 2.0 /100 | #246 | Tragic 18.1% |
Demographics Similar to Paiute by 3 or more Vehicles in Household
In terms of 3 or more vehicles in household, the demographic groups most similar to Paiute are Immigrants from Vietnam (23.8%, a difference of 0.12%), Immigrants from Philippines (23.8%, a difference of 0.18%), Chinese (23.9%, a difference of 0.29%), Norwegian (23.9%, a difference of 0.33%), and Scandinavian (23.6%, a difference of 0.77%).
| Demographics | Rating | Rank | 3 or more Vehicles in Household |
| Mexicans | 100.0 /100 | #13 | Exceptional 24.7% |
| Immigrants | Mexico | 100.0 /100 | #14 | Exceptional 24.6% |
| Hawaiians | 100.0 /100 | #15 | Exceptional 24.3% |
| Basques | 100.0 /100 | #16 | Exceptional 24.3% |
| Koreans | 100.0 /100 | #17 | Exceptional 24.1% |
| Norwegians | 100.0 /100 | #18 | Exceptional 23.9% |
| Chinese | 100.0 /100 | #19 | Exceptional 23.9% |
| Paiute | 100.0 /100 | #20 | Exceptional 23.8% |
| Immigrants | Vietnam | 100.0 /100 | #21 | Exceptional 23.8% |
| Immigrants | Philippines | 100.0 /100 | #22 | Exceptional 23.8% |
| Scandinavians | 100.0 /100 | #23 | Exceptional 23.6% |
| Sri Lankans | 100.0 /100 | #24 | Exceptional 23.6% |
| Immigrants | Central America | 100.0 /100 | #25 | Exceptional 23.4% |
| Mexican American Indians | 100.0 /100 | #26 | Exceptional 23.3% |
| Guamanians/Chamorros | 100.0 /100 | #27 | Exceptional 23.2% |