Paiute vs West Indian 2 or more Vehicles in Household
COMPARE
Paiute
West Indian
2 or more Vehicles in Household
2 or more Vehicles in Household Comparison
Paiute
West Indians
55.8%
2 OR MORE VEHICLES IN HOUSEHOLD
68.0/ 100
METRIC RATING
159th/ 347
METRIC RANK
41.3%
2 OR MORE VEHICLES IN HOUSEHOLD
0.0/ 100
METRIC RATING
331st/ 347
METRIC RANK
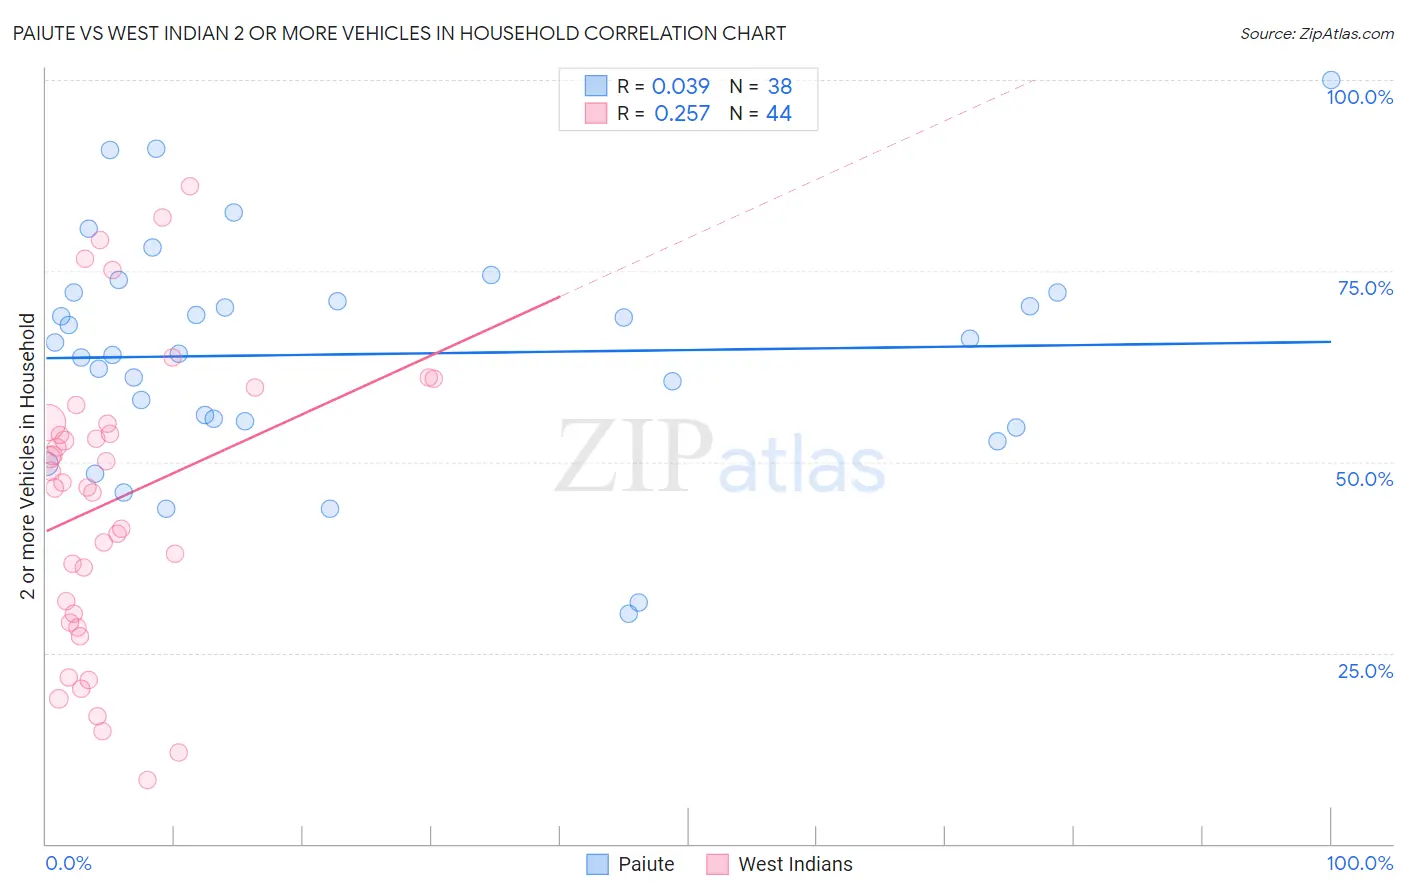
Paiute vs West Indian 2 or more Vehicles in Household Correlation Chart
The statistical analysis conducted on geographies consisting of 58,398,670 people shows no correlation between the proportion of Paiute and percentage of households with 2 or more vehicles available in the United States with a correlation coefficient (R) of 0.039 and weighted average of 55.8%. Similarly, the statistical analysis conducted on geographies consisting of 253,888,227 people shows a weak positive correlation between the proportion of West Indians and percentage of households with 2 or more vehicles available in the United States with a correlation coefficient (R) of 0.257 and weighted average of 41.3%, a difference of 35.1%.
2 or more Vehicles in Household Correlation Summary
| Measurement | Paiute | West Indian |
| Minimum | 30.2% | 8.3% |
| Maximum | 100.0% | 86.1% |
| Range | 69.8% | 77.8% |
| Mean | 64.1% | 44.9% |
| Median | 64.9% | 47.0% |
| Interquartile 25% (IQ1) | 55.3% | 29.6% |
| Interquartile 75% (IQ3) | 72.1% | 55.1% |
| Interquartile Range (IQR) | 16.8% | 25.5% |
| Standard Deviation (Sample) | 15.1% | 19.3% |
| Standard Deviation (Population) | 14.9% | 19.1% |
Similar Demographics by 2 or more Vehicles in Household
Demographics Similar to Paiute by 2 or more Vehicles in Household
In terms of 2 or more vehicles in household, the demographic groups most similar to Paiute are Tlingit-Haida (55.8%, a difference of 0.020%), Crow (55.7%, a difference of 0.050%), Immigrants from Kuwait (55.8%, a difference of 0.10%), Immigrants from Lithuania (55.8%, a difference of 0.11%), and Immigrants from Venezuela (55.8%, a difference of 0.12%).
| Demographics | Rating | Rank | 2 or more Vehicles in Household |
| Immigrants | Pakistan | 78.1 /100 | #152 | Good 56.1% |
| Lumbee | 71.9 /100 | #153 | Good 55.9% |
| Ukrainians | 70.8 /100 | #154 | Good 55.8% |
| Immigrants | Venezuela | 70.7 /100 | #155 | Good 55.8% |
| Immigrants | Lithuania | 70.4 /100 | #156 | Good 55.8% |
| Immigrants | Kuwait | 70.2 /100 | #157 | Good 55.8% |
| Tlingit-Haida | 68.5 /100 | #158 | Good 55.8% |
| Paiute | 68.0 /100 | #159 | Good 55.8% |
| Crow | 67.0 /100 | #160 | Good 55.7% |
| Colville | 61.1 /100 | #161 | Good 55.6% |
| German Russians | 60.9 /100 | #162 | Good 55.6% |
| Immigrants | Zimbabwe | 60.2 /100 | #163 | Good 55.6% |
| Dutch West Indians | 59.8 /100 | #164 | Average 55.6% |
| Immigrants | El Salvador | 59.4 /100 | #165 | Average 55.6% |
| Immigrants | Sri Lanka | 58.3 /100 | #166 | Average 55.5% |
Demographics Similar to West Indians by 2 or more Vehicles in Household
In terms of 2 or more vehicles in household, the demographic groups most similar to West Indians are Immigrants from Dominica (41.6%, a difference of 0.85%), Trinidadian and Tobagonian (40.9%, a difference of 0.98%), Ecuadorian (42.0%, a difference of 1.7%), Immigrants from Ecuador (40.5%, a difference of 1.9%), and Immigrants from Trinidad and Tobago (40.3%, a difference of 2.5%).
| Demographics | Rating | Rank | 2 or more Vehicles in Household |
| Immigrants | Cabo Verde | 0.0 /100 | #324 | Tragic 43.3% |
| Immigrants | West Indies | 0.0 /100 | #325 | Tragic 43.1% |
| Immigrants | Senegal | 0.0 /100 | #326 | Tragic 43.0% |
| Immigrants | Yemen | 0.0 /100 | #327 | Tragic 42.8% |
| Inupiat | 0.0 /100 | #328 | Tragic 42.6% |
| Ecuadorians | 0.0 /100 | #329 | Tragic 42.0% |
| Immigrants | Dominica | 0.0 /100 | #330 | Tragic 41.6% |
| West Indians | 0.0 /100 | #331 | Tragic 41.3% |
| Trinidadians and Tobagonians | 0.0 /100 | #332 | Tragic 40.9% |
| Immigrants | Ecuador | 0.0 /100 | #333 | Tragic 40.5% |
| Immigrants | Trinidad and Tobago | 0.0 /100 | #334 | Tragic 40.3% |
| Immigrants | Bangladesh | 0.0 /100 | #335 | Tragic 38.8% |
| Vietnamese | 0.0 /100 | #336 | Tragic 38.5% |
| Barbadians | 0.0 /100 | #337 | Tragic 38.3% |
| Immigrants | Uzbekistan | 0.0 /100 | #338 | Tragic 37.9% |